Key Findings
-
Taxpayers reported about $11 trillion of total income on their 2017 taxA tax is a mandatory payment or charge collected by local, state, and national governments from individuals or businesses to cover the costs of general government services, goods, and activities. returns.
-
About 68.8 percent ($7.5 trillion) of total income reported on Form 1040 consisted of wages and salaries, and about 82.5 percent of all tax filers reported earning wage income.
-
Retirement accounts (such as 401(k)s and Individual Retirement Accounts, or IRAs) and pensions are important sources of capital income for the middle class. Pensions and annuities ($729 billion), IRA distributions ($286 billion), and Social Security benefits ($309 billion) combine to create about $1.3 trillion in taxable retirement income.
-
Business income is another large component of reported personal income. Businesses that report income taxes through the individual income taxAn individual income tax (or personal income tax) is levied on the wages, salaries, investments, or other forms of income an individual or household earns. The U.S. imposes a progressive income tax where rates increase with income. The Federal Income Tax was established in 1913 with the ratification of the 16th Amendment. Though barely 100 years old, individual income taxes are the largest source, like S corporations, sole proprietorships, and partnerships, account for $1.1 trillion in personal income.
-
Net capital gains, taxable interest, and ordinary dividends accounted for more than $1.2 trillion in investment income for tax year 2017, slightly more than business income and slightly less than income from retirement accounts and Social Security.
Introduction
The individual income tax is the federal government’s largest source of revenue. More than 150 million individual income tax returns were filed for tax year 2017.[1] Each household with taxable incomeTaxable income is the amount of income subject to tax, after deductions and exemptions. Taxable income differs from—and is less than—gross income. files a return to the Internal Revenue Service (IRS). On the IRS individual income tax form (Form 1040), all sources of taxable income are listed on the first page and added to reach total income. From there, the tax return calculates the taxpayer’s deductions and credits to determine tax liability and tax owed or refunded.
This report will focus on sources of reported total income in 2017,[2] which amounted to just over $11 trillion.[3] We will review the component parts of total income reported on lines 7 to 22 of the 2017 Form 1040. Reviewing reported income helps to understand the composition of the federal government’s revenue base and how Americans earn their taxable income.[4]
This paper divides income into four major categories—wages and salaries, busines income, investment income, and retirement income—and reviews each of these four categories for tax year 2017.
| Income Type | Amount |
|---|---|
|
Salaries and Wages |
$7,577 |
|
Capital Gains Less Losses |
$854 |
|
Taxable Pensions and Annuities |
$729 |
|
Partnership and S Corporation Net Income |
$680 |
|
Business or Profession Net Income (Less Losses) |
$346 |
|
Taxable Social Security Benefits |
$309 |
|
Taxable Individual Retirement Arrangement (IRA) distributions |
$286 |
|
Ordinary Dividends* |
$282 |
|
Taxable Interest** |
$106 |
|
Total Rental and Royalty net Income |
$105 |
|
*Tax-free interest, such as interest on municipal bonds, adds another $60 billion. **The IRS excludes qualified dividends from total income, which amounts to about $217 billion. Source: Internal Revenue Service, “SOI Tax Stats – Individual Income Tax Returns Publication 1304 (Complete Report),” Table 1.3, https://www.irs.gov/statistics/soi-tax-stats-individual-income-tax-returns-publication-1304-complete-report. |
|
Wages and Salaries Make up 68.8 Percent of Total Income at $7.5 Trillion
For most tax filers in the U.S., the largest number on Form 1040 appears on line 7, the very first line related to income. On this line, taxpayers mark wages, salaries, tips, and other compensation for their work. Most Americans get that number from their W-2 forms, supplied by their employers. In total, just over 126 million tax filers in 2017 reported $7.5 trillion in wage income, or 68.8 percent of total income.
Most Americans report labor income, and most of their income comes from labor; most of the American economy is made up of labor compensation. Any meaningful attempt to raise revenue through the income tax will almost necessarily include wages and salaries in the base, simply by virtue of the math: Not much income tax revenue can be raised by excluding 70 percent of income.
The amounts reported on Form 1040 reflect most, but not all, labor compensation. Firms also pay for employee health benefits and make contributions to Social Security, both of which are excluded from income taxation. Although neither of these is subject to the personal income tax, the IRS plays a role in both. For example, the IRS administers the payroll taxA payroll tax is a tax paid on the wages and salaries of employees to finance social insurance programs like Social Security, Medicare, and unemployment insurance. Payroll taxes are social insurance taxes that comprise 24.8 percent of combined federal, state, and local government revenue, the second largest source of that combined tax revenue. through employer withholding.
Business Income Totals $1.1 Trillion of Personal Income
In the United States, the dominant tax filing structure for firms is as “pass-through” entities, so labeled because their income immediately passes through to individual owners’ tax returns using schedules C, E, and F. According to the U.S. Census Bureau, in 2017, 92.5 percent of businesses used this structure, and the majority were sole proprietorships, fully owned by a single individual.[5]
Pass-through firms employ most of the private-sector workforce in the U.S., and account for most business income.[6] Partnerships and S corporations accounted for $680 billion of net income in 2017, and individuals reported an additional $346 billion of business income, for a total of about $1.1 trillion when also including income from estates, farms, trusts, rents, and royalties.[7]
Investment Income Accounts for Over $1.2 Trillion of Personal Income
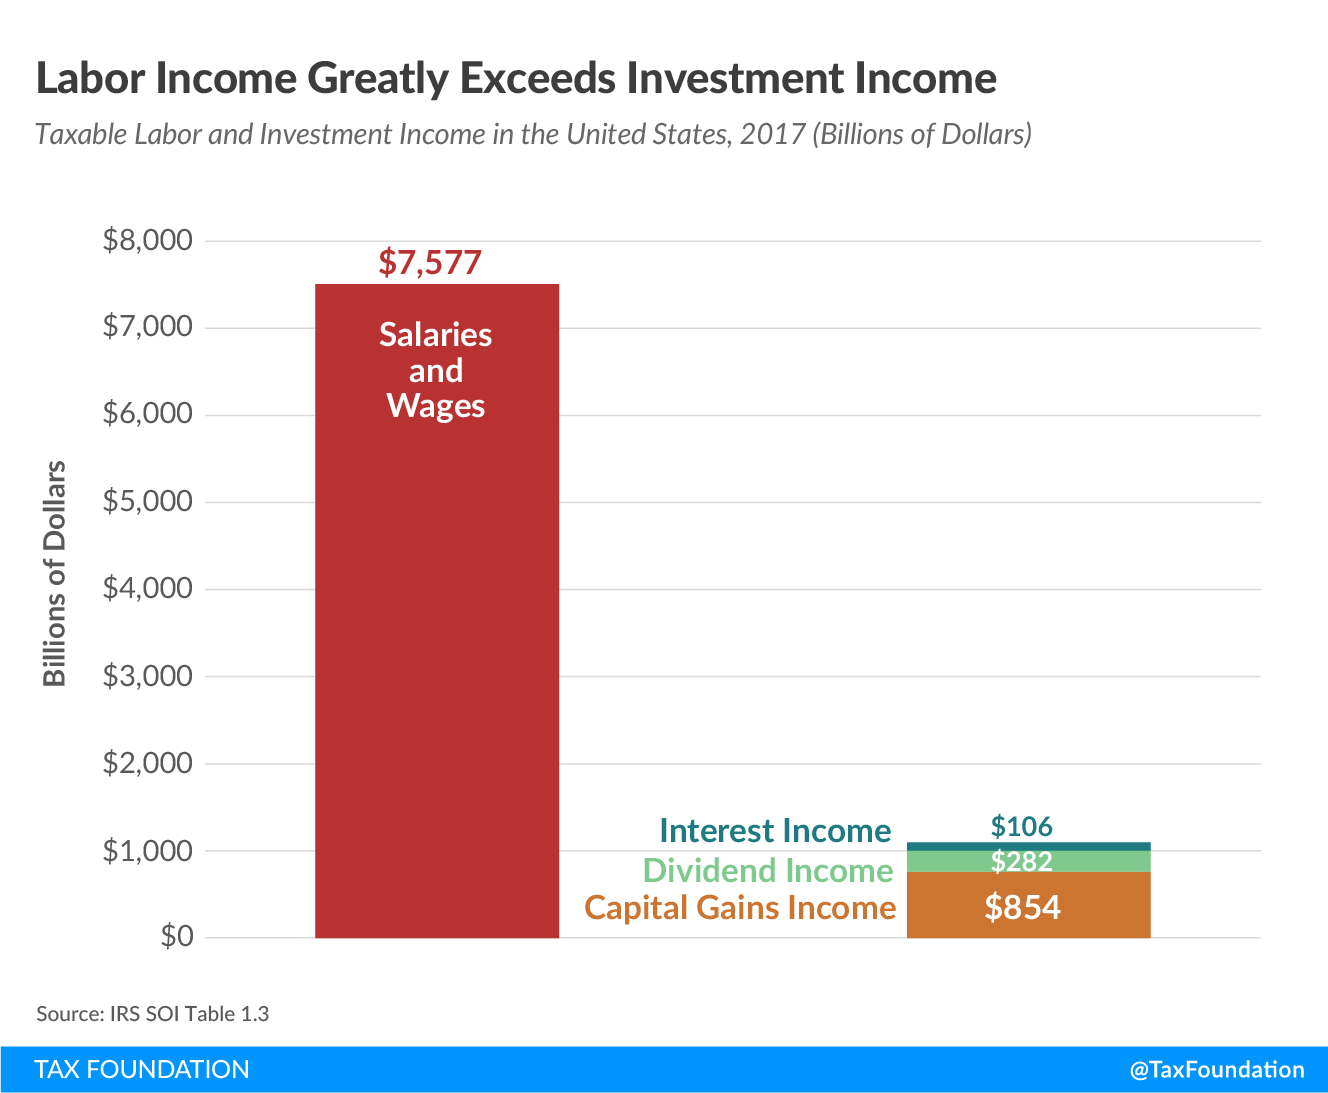
Taxpayers reported $282 billion of taxable (ordinary) dividends in 2017, and $854 billion of net capital gains, only some of which comes from the sale of corporate stock.[8] Taxable interest accounted for about $106 billion. Overall taxable investment income amounted to about $1.24 trillion in 2017. The returns to corporate stock, as found on individual income tax returns, are substantial, but they are small compared to the amount earned in labor income, which totaled $7.6 trillion in tax year 2017.
Taxable labor compensation is much larger than taxable investment income (Figure 1). Increasing taxes on investment income would not have a substantial effect on the U.S. budget deficit, as it is simply too small a portion of the economy.
Retirement Income Adds Up to Over $1.3 Trillion of Personal Income
In 2017, taxpayers earned about $729 billion from pensions and annuities, and about $286 billion in taxable Individual Retirement Account (IRA) distributions.[9] America’s system of retirement accounts, while overly complex, is taxed neutrally, removing the bias against saving.[10]
In addition to private saving, taxpayers earned about $309 billion in taxable Social Security benefits in tax year 2017. Notably, the income received from retirement accounts is slightly above the capital gains and dividend income reported outside of retirement accounts.
It is often hard to track capital income in retirement accounts, especially because it does not appear on IRS forms until it is distributed. Economists often struggle with categorizing this income correctly. For example, the Congressional Budget Office (CBO) released a report in 2011 on trends in the distribution of income.[11]
The report accounted for all the sources of income, including some nontaxable sources. The authors categorized incomes by source, sorting pensions into a separate category from labor income and capital income. Pensions are, in part, compensation for labor. Workers also earn capital income by deferring their labor income and having that income invested, often amounting to multiples of their original contributions. While it is difficult to allocate pension income precisely between labor and capital, workers earn capital income through their pensions. The CBO report sorted retirement income into a category called “other.”
The CBO report shows that while it is true that middle-class Americans do not report much investment income such as dividends or capital gains on their tax returns, they still earn returns to capital through their retirement savings. In retirement accounts, savings enjoys proper tax treatment.
Reviewing the sources of personal income by income bracket shows the importance of retirement income to the middle class (Figure 2). Retirement income is most important as a source of personal income for taxpayers reporting between $50,000 and $100,000 of income, making up about 18 percent of total income. In practice, of course, this means that a minority of middle-class taxpayers—the retirees—rely on this income, while the majority, those of working age, do not.
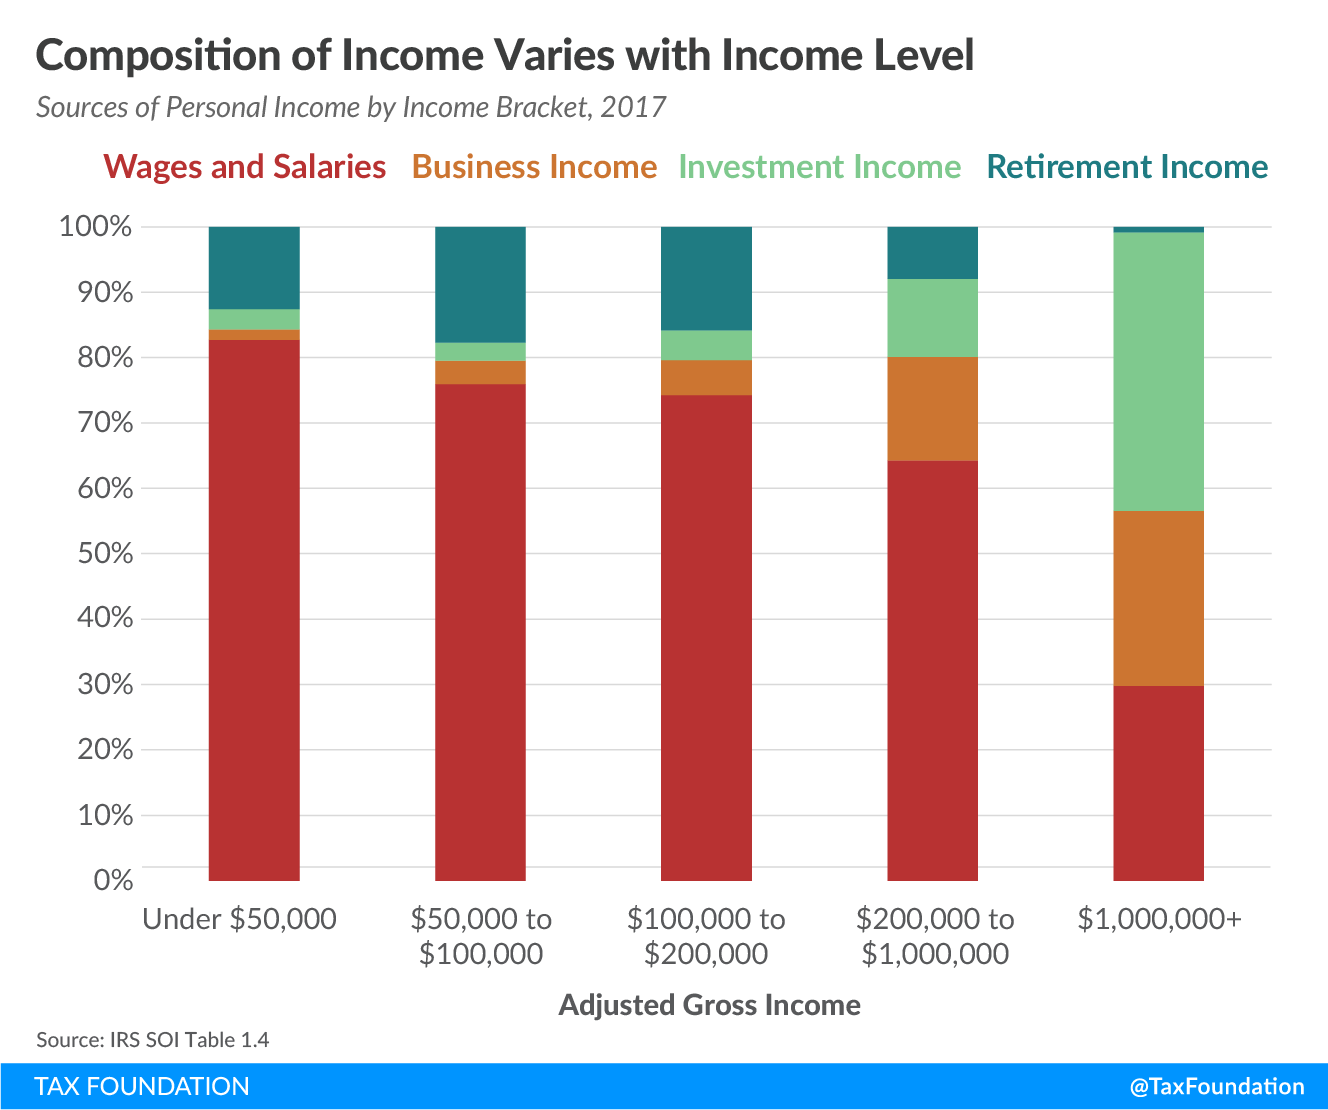
Retirement income is difficult to account for, and the tax rules governing retirement accounts are not obvious to people unfamiliar with tax data. Pension and other retirement income is, in economic terms, partially capital income; it is about as important as any other kind of capital income; and it is most important to middle-class workers, given the accessibility of retirement options to those workers. It is important to consider tax reforms that would expand the accessibility of retirement and savings accounts that are neutral with respect to saving and consumption.[12]
Conclusion
Reviewing the sources of personal income shows that the personal income tax is largely a tax on labor, primarily because our personal income is mostly derived from labor. However, varied sources of capital income also play a role in American incomes. While these sources are small compared to labor income, they are still significant and need to be accounted for, both by policymakers trying to collect revenue efficiently and by those attempting to understand the distribution of personal income.
| Wages and Salaries | Business Income | Investment Income | Retirement Income | |
|---|---|---|---|---|
| Under $50,000 | $1,616 | $31 | $62 | $247 |
| $50,000 to $100,000 | $1,871 | $87 | $70 | $437 |
| $100,000 to $200,000 | $2,015 | $145 | $128 | $430 |
| $200,000 to $1,000,000 | $1,586 | $390 | $297 | $196 |
| $1,000,000 and above | $489 | $439 | $699 | $14 |
|
Source: Internal Revenue Service, “SOI Tax Stats – Individual Income Tax Returns Publication 1304 (Complete Report),” Table 1.4, https://www.irs.gov/statistics/soi-tax-stats-individual-income-tax-returns-publication-1304-complete-report. |
||||
| Income Type | 1990 | 1995 | 2000 | 2001 | 2002 | 2003 | 2004 | 2005 | 2006 | 2007 | 2008 | 2009 | 2010 | 2011 | 2012 | 2013 | 2014 | 2015 | 2016 |
|---|---|---|---|---|---|---|---|---|---|---|---|---|---|---|---|---|---|---|---|
| Source: IRS, Table A. Selected Income and Tax Items for Tax Years, 1990-2016, in Current Dollars. Note: Capital Gains includes net capital gain less loss and capital gain distributions reported on Form 1040. | |||||||||||||||||||
| Wages and Salaries | $2,599 | $3,201 | $4,456 | $4,565 | $4,560 | $4,650 | $4,922 | $5,155 | $5,469 | $5,842 | $5,951 | $5,707 | $5,837 | $6,055 | $6,301 | $6,475 | $6,785 | $7,112 | $7,217 |
| Taxable Interest | $227 | $155 | $199 | $198 | $149 | $127 | $125 | $162 | $223 | $268 | $223 | $168 | $140 | $120 | $112 | $101 | $94 | $96 | $97 |
| Tax-exempt Interest | $40 | $49 | $54 | $56 | $55 | $54 | $52 | $58 | $73 | $79 | $80 | $74 | $75 | $73 | $71 | $68 | $62 | $62 | $61 |
| Ordinary Dividends | $80 | $95 | $147 | $120 | $103 | $115 | $147 | $166 | $199 | $237 | $219 | $163 | $184 | $195 | $260 | $215 | $255 | $260 | $254 |
| Qualified Dividends | N/A | N/A | N/A | N/A | N/A | $81 | $111 | $119 | $137 | $156 | $159 | $124 | $136 | $142 | $204 | $158 | $192 | $203 | $202 |
| State Income Tax Refunds | $10 | $12 | $18 | $21 | $24 | $23 | $23 | $22 | $24 | $27 | $28 | $30 | $27 | $28 | $27 | $28 | $30 | $31 | $33 |
| Alimony | $4 | $4 | $6 | $7 | $7 | $6 | $7 | $8 | $8 | $9 | $9 | $9 | $9 | $9 | $9 | $9 | $10 | $10 | $10 |
| Sole Proprietorship | $141 | $169 | $214 | $217 | $221 | $230 | $247 | $270 | $282 | $280 | $264 | $245 | $267 | $283 | $304 | $302 | $317 | $332 | $328 |
| Capital Gains | $114 | $170 | $626 | $327 | $239 | $294 | $474 | $668 | $779 | $908 | $469 | $232 | $364 | $377 | $623 | $490 | $699 | $707 | $621 |
| Sale of Noncapital Property | $1 | ($3) | ($1) | ($2) | ($2) | $0 | $3 | $4 | $4 | $4 | ($8) | ($18) | ($18) | ($14) | ($9) | $1 | $9 | $12 | $6 |
| Total IRA Distributions | $35 | $60 | $138 | $119 | $120 | $121 | $131 | $147 | $166 | $190 | $216 | $179 | $291 | $263 | $272 | $261 | $279 | $295 | $300 |
| Taxable IRA Distributions | $18 | $37 | $99 | $94 | $88 | $88 | $102 | $112 | $125 | $148 | $162 | $135 | $194 | $217 | $231 | $214 | $235 | $253 | $258 |
| Total Pensions and Annuities | $214 | $311 | $552 | $533 | $561 | $565 | $628 | $685 | $781 | $852 | $845 | $823 | $881 | $911 | $975 | $1,048 | $1,111 | $1,169 | $1,108 |
| Taxable Pensions and Annuitites | $159 | $221 | $326 | $339 | $358 | $373 | $394 | $420 | $450 | $491 | $506 | $523 | $559 | $581 | $613 | $639 | $663 | $690 | $694 |
| S corporation, Partnership, Rent, Royalty, Estate, Trust | $75 | $149 | $252 | $268 | $278 | $296 | $357 | $447 | $466 | $453 | $418 | $385 | $446 | $486 | $613 | $614 | $679 | $713 | $706 |
| Farm | $0 | ($8) | ($9) | ($11) | ($14) | ($12) | ($13) | ($12) | ($15) | ($15) | ($15) | ($14) | ($12) | ($10) | ($6) | ($8) | ($8) | ($14) | $(18) |
| Unemployment Compensation | $15 | $19 | $17 | $27 | $43 | $44 | $33 | $28 | $27 | $29 | $44 | $84 | $120 | $92 | $71 | $52 | $33 | $27 | $25 |
| Total Social Security Benefits | $100 | $119 | $187 | $197 | $206 | $214 | $232 | $252 | $340 | $382 | $416 | $457 | $478 | $491 | $527 | $554 | $575 | $605 | $620 |
| Taxable Social Security Benefits | $20 | $46 | $90 | $94 | $93 | $98 | $110 | $125 | $144 | $167 | $168 | $175 | $191 | $202 | $224 | $243 | $261 | $277 | $286 |
| Gambling Earnings | N/A | $8 | $17 | $17 | $19 | $19 | $23 | $25 | $28 | $30 | $27 | $24 | $25 | $27 | $29 | $30 | $29 | $33 | $32 |
| Other | $18 | $16 | $25 | $20 | $19 | $21 | $23 | $27 | $30 | $36 | $34 | $31 | $35 | $34 | $37 | $37 | $39 | $40 | $38 |
| Total Personal Income | $3,439 | $4,230 | $6,424 | $6,231 | $6,111 | $6,295 | $6,887 | $7,532 | $8,145 | $8,811 | $8,384 | $7,739 | $8,208 | $8,498 | $9,234 | $9,234 | $9,916 | $10,360 | $10,379 |
Stay informed on the tax policies impacting you.
Subscribe to our free newsletter to get the latest tax data, news and analysis.
Subscribe[1] Internal Revenue Service, “SOI Tax Stats – Individual Income Tax Returns Publication 1304 (Complete Report),” Table 1.3, https://www.irs.gov/statistics/soi-tax-stats-individual-income-tax-returns-publication-1304-complete-report.
[2] Note that this data is from 2017, prior to passage of the Tax Cuts and Jobs Act (TCJA).
[3] IRS, “SOI Tax Stats,” Table 1.3.
[4] There are limitations on using data from Form 1040 to understand the nature of income in the U.S. economy. Not all economic activity is found on personal income tax forms—for example, employer-provided health insurance and returns to owner-occupied housing are excluded. Both of these are substantial components of economic output that do not appear on income tax returns. As broad economic aggregates, though, the categories of income established on Form 1040 are still useful and instructive.
[5] U.S. Census Bureau, “County Business Patterns (CBP),” https://census.gov/programs-surveys/cbp.html, and U.S. Census Bureau, “Nonemployer Statistics (NES),” https://census.gov/programs-surveys/nonemployer-statistics.html.
[6] Scott Greenberg, “Pass-Through Businesses: Data and Policy,” Tax Foundation, Jan. 17, 2017, https://taxfoundation.org/pass-through-businesses-data-and-policy.
[7] IRS, “SOI Tax Stats,” Table 1.3.
[8] IRS, “SOI Tax Stats.”
[9] IRS, “SOI Tax Stats,” Table 1.3.
[10] See generally, Erica York, “The Complicated Taxation of America’s Retirement Accounts,” Tax Foundation, May 22, 2018, https://taxfoundation.org/retirement-accounts-taxation/.
[11] Congressional Budget Office, “Trends in the Distribution of Household Income between 1979 and 2007,” Oct. 25, 2011, http://cbo.gov/sites/default/files/10-25-HouseholdIncome_0.pdf.
[12] See Erica York, “The Complicated Taxation of America’s Retirement Accounts” and Robert Bellafiore, “The Case for Universal Savings Accounts,” Tax Foundation, Feb. 26, 2019, https://taxfoundation.org/case-for-universal-savings-accounts/.
Share this article