All Related Articles
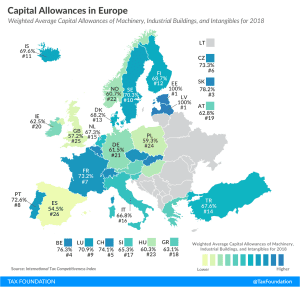
Capital Allowances in Europe, 2019
3 min read

Income Taxes on the Top 0.1 Percent Weren’t Much Higher in the 1950s
Recent plans to increase the tax burden on wealthy Americans, such as higher marginal income tax rates and wealth taxes, are flawed in several ways, including in their lack of understanding of tax history.
4 min read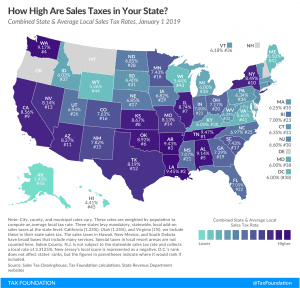
State and Local Sales Tax Rates, 2019
11 min read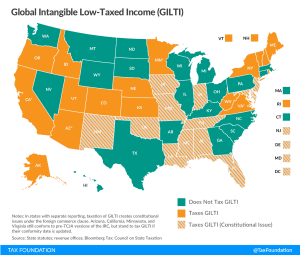
GILTI Minds: Why Some States Want to Tax International Income—And Why They Shouldn’t
The new federal tax on Global Intangible Low-Taxed Income (GILTI) is something of a misnomer: it’s certainly global and it’s definitely income, but the rest of it is, at best, an approximation. It’s not exclusively levied on low-taxed income, nor just on the economic returns from intangible property. So what is GILTI, why might states tax it, and what’s the problem with that?
8 min readToward a State of Conformity: State Tax Codes a Year After Federal Tax Reform
States incorporate provisions of the federal tax code into their own codes in varying degrees, meaning that federal tax reform has implications for state revenue beyond any broader economic effects of tax reform.
73 min read
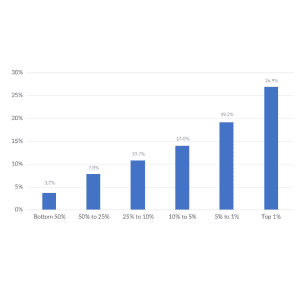
America Already Has a Progressive Tax System
Recent interest in raising the tax burden on high-income individuals glosses over the fact that the U.S. federal tax code is already progressive.
3 min read
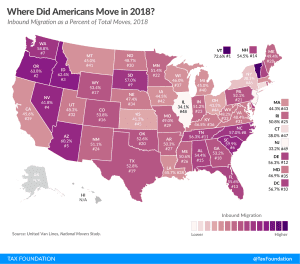
Where Did Americans Move in 2018?
2 min read
We Shouldn’t Scrap Dynamic Scoring
2 min read
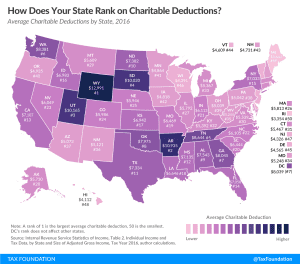
Charitable Deductions by State
2 min read

Wireless Taxes and Fees Climb Again in 2018
A typical family with four cell phones paying $100 per month for service can expect to pay about $229 per year in wireless taxes, fees, and surcharges. Nationally, these impositions make up about 19.1 percent of the average customer’s cell phone bill.
35 min read