All Related Articles

Capital Cost Recovery across the OECD, 2018
One hundred percent expensing for short-life business investments was a great start but needs to be enacted on a permanent basis for it to have an impact on long-term decision-making.
15 min read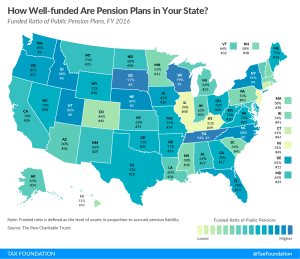
How Well-Funded are Pension Plans in Your State?
More than half the states have pension plans that are less than two-thirds funded, and five states have pension plans that are less than 50 percent funded.
2 min read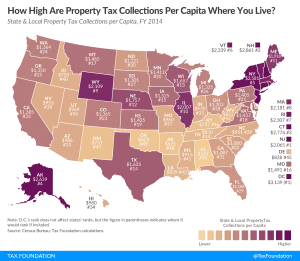
Average Per Capita Property Taxes: How Does Your State Compare?
While property taxes inevitably draw the ire of some residents living in high-tax jurisdictions, property values are a relatively good indicator of the value of local services received, such as well-funded roads and schools. At the same time, good local public services can make municipalities more desirable, thereby increasing residential property value.
3 min read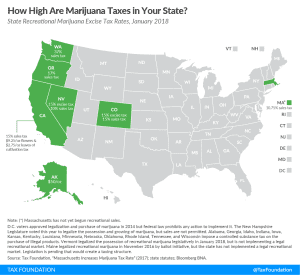
Recreational Marijuana Taxes by State, 2018
As public opinion increasingly favors the legalization of recreational marijuana, a growing number of states must determine how to structure marijuana taxes.
3 min read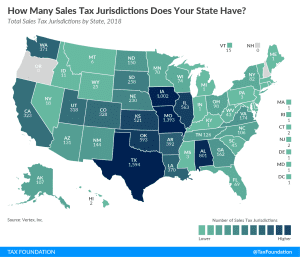
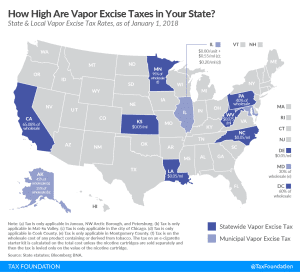
Vaping Taxes by State, 2018
A variety of taxing methods and a wide range of rates indicates that there is little consensus on the best way to levy vapor taxes in the U.S.
3 min read
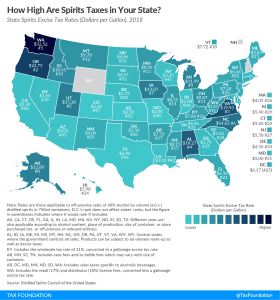
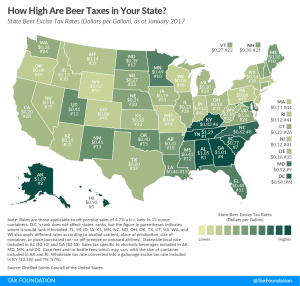
Distilled Spirits Taxes by State, 2018
2 min read
Facts and Figures 2018: How Does Your State Compare?
Facts and Figures is a one-stop data resource comparing the 50 states on over 40 measures of individual and corporate income taxes, sales taxes, excise taxes, property taxes, business tax climates, and more.
1 min readShould Congress Act Before SCOTUS On Online Sales Taxes?
The U.S. Supreme Court is hearing a case on the constitutionality of a South Dakota law requiring internet vendors collect online sales tax, but should Congress fix the problem first?
13 min read
New Tariff Plan Could Cost States $9 Billion
While the burden of Trump’s tariffs will ultimately be felt by most U.S. consumers, two-thirds of the new taxes will be initially borne by 10 states.
6 min read
State Individual Income Tax Rates and Brackets, 2018
Individual income tax rates and brackets vary widely by state. Keep track of top marginal income tax rates in your state and others with our new guide.
4 min read
Sources of Personal Income, Tax Year 2015
Taxpayers reported $10.4 trillion of total income on their 2015 tax returns. This report breaks down the sources of this income: wages and salaries, business income, investment income, and retirement income.
9 min read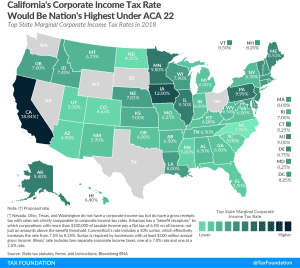

State and Local Sales Tax Rates, 2018
In addition to state-level sales taxes, consumers also face local sales taxes in 38 states. These rates can be substantial, so a state with a moderate statewide sales tax rate could actually have a very high combined state and local rate.
11 min read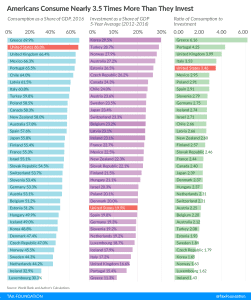
Americans Consume Much More than They Invest
Recent data show that Americans stand out for consuming much more than they invest, and this is due in part to the tax code’s bias against savings.
3 min read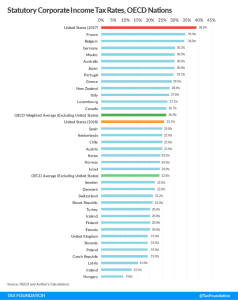
The United States’ Corporate Income Tax Rate is Now More in Line with Those Levied by Other Major Nations
The Tax Cuts and Jobs Act significantly reduced the federal statutory corporate income tax rate. When combined with state and local taxes, it put the U.S.’s corporate tax rate in line with the average among OECD nations.
4 min read
State Corporate Income Tax Rates and Brackets, 2018
State corporate income tax rates range from 3 percent in North Carolina to 12 percent in Iowa. Download and compare each state’s 2018 rates and brackets here.
6 min read