Americans were on the move in 2021, and they chose low-tax states over high-taxA tax is a mandatory payment or charge collected by local, state, and national governments from individuals or businesses to cover the costs of general government services, goods, and activities. ones. That’s the finding of recent U.S. Census Bureau population data, along with commercial datasets released this week by U-Haul and United Van Lines.
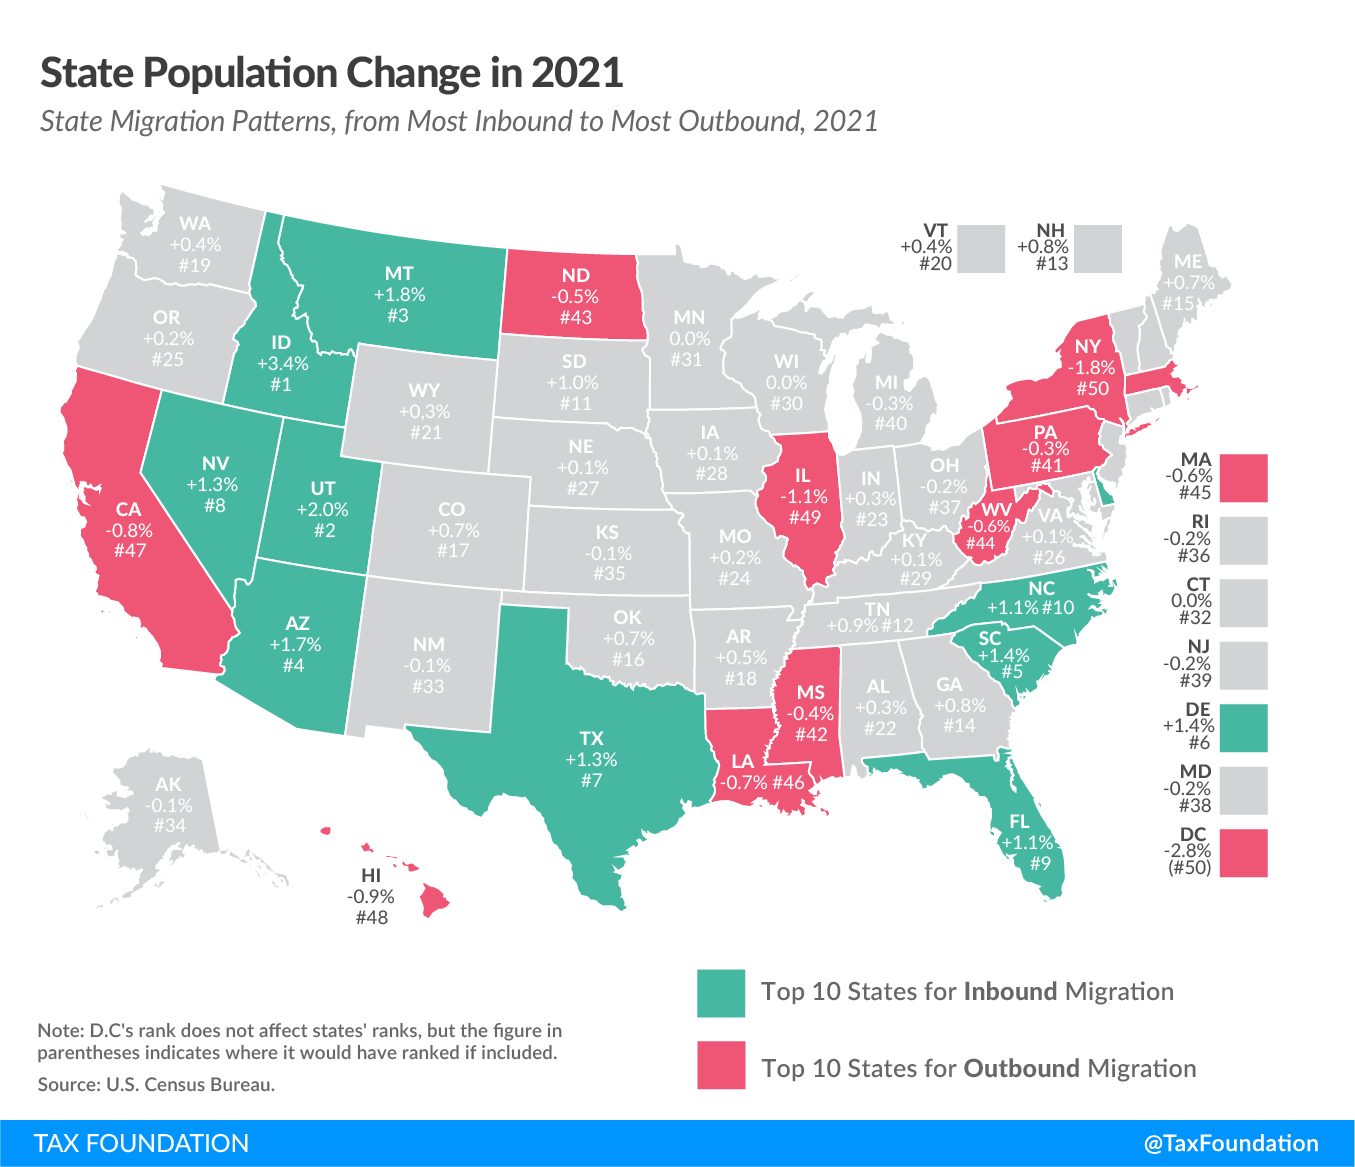
Nationally, the U.S. population only grew by 0.1 percent between July 2020 and July 2021, the lowest rate since the nation’s founding. Pandemic-induced excess deaths, virtually nonexistent international in-migration, and an already-declining birth rate yielded an almost flat population trend nationwide. This, however, belies state-level and regional differences. Whereas the District of Columbia’s population shrunk by 2.8 percent between April 2020 (roughly the start of the pandemic) to July 2021, New York lost 1.8 percent of its population, and Illinois, Hawaii, and California rounded out the top five jurisdictions for population loss, Idaho was gaining 3.4 percent, while Utah, Montana, Arizona, South Carolina, Delaware, Texas, Nevada, Florida, and North Carolina all saw population gains of 1 percent or more.
The picture painted by this population shift is a clear one of people leaving high-tax, high-cost states for lower-tax, lower-cost alternatives. The individual income taxAn individual income tax (or personal income tax) is levied on the wages, salaries, investments, or other forms of income an individual or household earns. The U.S. imposes a progressive income tax where rates increase with income. The Federal Income Tax was established in 1913 with the ratification of the 16th Amendment. Though barely 100 years old, individual income taxes are the largest source of tax revenue in the U.S. is only one component of overall tax burdens, but it is often highly salient, and is illustrative here. If we include the District of Columbia, then in the top one-third of states for population growth since the start of the pandemic (April 2020 to July 2021 data), the average combined top marginal state and local income tax rate is 3.5 percent, while in the bottom third of states, it is about 7.3 percent.
Six states in the top third forgo individual income taxes (Florida, Tennessee, Texas, Nevada, New Hampshire, and South Dakota) and the highest top rate is Maine’s 7.15 percent. Among the bottom third, four jurisdictions—California, New Jersey, New York, and the District of Columbia—have double-digit income tax rates, and the lowest rate is in Pennsylvania, where a low state rate of 3.07 percent is paired with some of the highest local income tax rates in the country. Five states in the bottom third have local income taxes; none in the top third do.
Not content to rest on their laurels, nine states in the top third either implemented or enacted individual or corporate income taxA corporate income tax (CIT) is levied by federal and state governments on business profits. Many companies are not subject to the CIT because they are taxed as pass-through businesses, with income reportable under the individual income tax. cuts in 2021. Only two states in the bottom third did so, and in one (Louisiana), commensurate base broadeningBase broadening is the expansion of the amount of economic activity subject to tax, usually by eliminating exemptions, exclusions, deductions, credits, and other preferences. Narrow tax bases are non-neutral, favoring one product or industry over another, and can undermine revenue stability. , while good policy, made the reform essentially revenue neutral. Meanwhile, New York and the District of Columbia actually raised income taxes in 2021, the only places to do so.
The Census data shows population gains and losses, but not cross-border migration. (Census provides migration data, but on a longer time delay.) Moving data from U-Haul and United Van Lines, while less robust—and undoubtedly influenced by their geographic coverage—speaks more directly to cross-border migration, and is confirmatory. Both companies see states like California, Illinois, Massachusetts, and New York as the biggest losers, while states like Texas, Florida, and Tennessee are among the largest net gainers.
| Census Population Data (April 2020 – July 2021) and Industry Moving Data (2021) | |||
|---|---|---|---|
| State | Census | U-Haul | UVL |
| Alabama | 22 | 46 | 6 |
| Alaska | 34 | 16 | n.a. |
| Arizona | 4 | 5 | 18 |
| Arkansas | 18 | 41 | 21 |
| California | 47 | 50 | 45 |
| Colorado | 17 | 7 | 28 |
| Connecticut | 32 | 18 | 46 |
| Delaware | 6 | 30 | 12 |
| Florida | 9 | 2 | 5 |
| Georgia | 14 | 23 | 20 |
| Hawaii | 48 | n.a. | n.a. |
| Idaho | 1 | 9 | 9 |
| Illinois | 49 | 49 | 48 |
| Indiana | 23 | 6 | 27 |
| Iowa | 28 | 27 | 29 |
| Kansas | 35 | 40 | 39 |
| Kentucky | 29 | 38 | 25 |
| Louisiana | 46 | 43 | 42 |
| Maine | 15 | 8 | 14 |
| Maryland | 38 | 34 | 35 |
| Massachusetts | 45 | 47 | 43 |
| Michigan | 40 | 42 | 44 |
| Minnesota | 31 | 17 | 38 |
| Mississippi | 42 | 37 | 33 |
| Missouri | 24 | 39 | 32 |
| Montana | 3 | 22 | 23 |
| Nebraska | 27 | 20 | 40 |
| Nevada | 8 | 29 | 31 |
| New Hampshire | 13 | 25 | 19 |
| New Jersey | 39 | 36 | 49 |
| New Mexico | 33 | 10 | 15 |
| New York | 50 | 45 | 47 |
| North Carolina | 10 | 19 | 13 |
| North Dakota | 43 | 33 | 36 |
| Ohio | 37 | 24 | 41 |
| Oklahoma | 16 | 44 | 24 |
| Oregon | 25 | 14 | 8 |
| Pennsylvania | 41 | 48 | 37 |
| Rhode Island | 36 | 32 | 10 |
| South Carolina | 5 | 4 | 3 |
| South Dakota | 11 | 11 | 2 |
| Tennessee | 12 | 3 | 7 |
| Texas | 7 | 1 | 17 |
| Utah | 2 | 28 | 16 |
| Vermont | 20 | 12 | 1 |
| Virginia | 26 | 31 | 30 |
| Washington | 19 | 15 | 22 |
| West Virginia | 44 | 26 | 4 |
| Wisconsin | 30 | 13 | 34 |
| Wyoming | 21 | 21 | 26 |
| District of Columbia | 51 | 35 | 11 |
|
Sources: U.S. Census Bureau; U-Haul; United Van Lines. |
|||
These industry studies record total migrations, whereas population data can be put in percentage terms, so large states like Texas—which, according to the Census Bureau, had the most population growth in nominal terms, but seventh-most in percentage terms—show up prominently while smaller states that saw large population surges, like Idaho, are somewhat lower on the list. Another story that can be seen in the industry data, however, which is less apparent in Census population data, is regional competition, even among comparatively high-tax states. Vermont is first in the United Van Lines data but middle-of-the-pack for overall population change, because the state benefited from outmigration—some temporary, some likely permanent—from densely populated Northeastern cities at the height of the pandemic.
U-Haul has relatively few inbound trips to states in the Deep South (see, for instance, Alabama and Arkansas) compared to United Van Lines and, more importantly, to Census data on population growth. Relatively local moves, such as those within the D.C. metropolitan area, can make a jurisdiction like the District of Columbia look like it is doing well on United Van Lines data even though the Census data tells a different story. The industry data has limitations, but it remains interesting.
People move for many reasons. Sometimes taxes are expressly part of the calculation. Often they play an indirect role by contributing to a broadly favorable economic environment. And sometimes, of course, they play little or no role. The Census data and these industry studies cannot tell us exactly why each person moved, but there is no denying a very strong correlation between low-tax, low-cost states and population growth. With many states responding to robust revenues and heightened state competition by cutting taxes, moreover, these trends may only get larger.
Early in 2020, it was hard to disentangle preliminary data on migration, determining what was a temporary safety-based relocation and what might be a longer-term move. With Census data through July 2021, however, and industry data for all of 2021, we now have a clearer picture of which moves were for the long haul. The pandemic has accelerated changes in the way we live and work, making it far easier for people to move—and they have. As states work to maintain their competitive advantage, they should pay attention to where people are moving, and try to understand why.
Share