Property taxes are an important source of revenue for local and state governments. In fiscal year (FY) 2018 (the most recent year of data available), property taxes generated 31.1 percent of total U.S. state and local taxA tax is a mandatory payment or charge collected by local, state, and national governments from individuals or businesses to cover the costs of general government services, goods, and activities. collections and 71.7 percent of local tax collections. Local governments rely heavily on property taxes to fund schools, roads, police departments, and fire and emergency medical services, as well as other services associated with residency or property ownership.
On average, state and local governments collected $1,675 per capita in property taxes nationwide in FY 2018, but collections vary widely from state to state. The highest state and local property taxA property tax is primarily levied on immovable property like land and buildings, as well as on tangible personal property that is movable, like vehicles and equipment. Property taxes are the single largest source of state and local revenue in the U.S. and help fund schools, roads, police, and other services. collections per capita are found in the District of Columbia ($3,740), followed by New Jersey ($3,378), New Hampshire ($3,362), Connecticut ($3,107), New York ($3,025), and Vermont ($2,738). The lowest collections per capita are found in Alabama ($598), Oklahoma ($771), Arkansas ($776), Tennessee ($799), and New Mexico ($832).
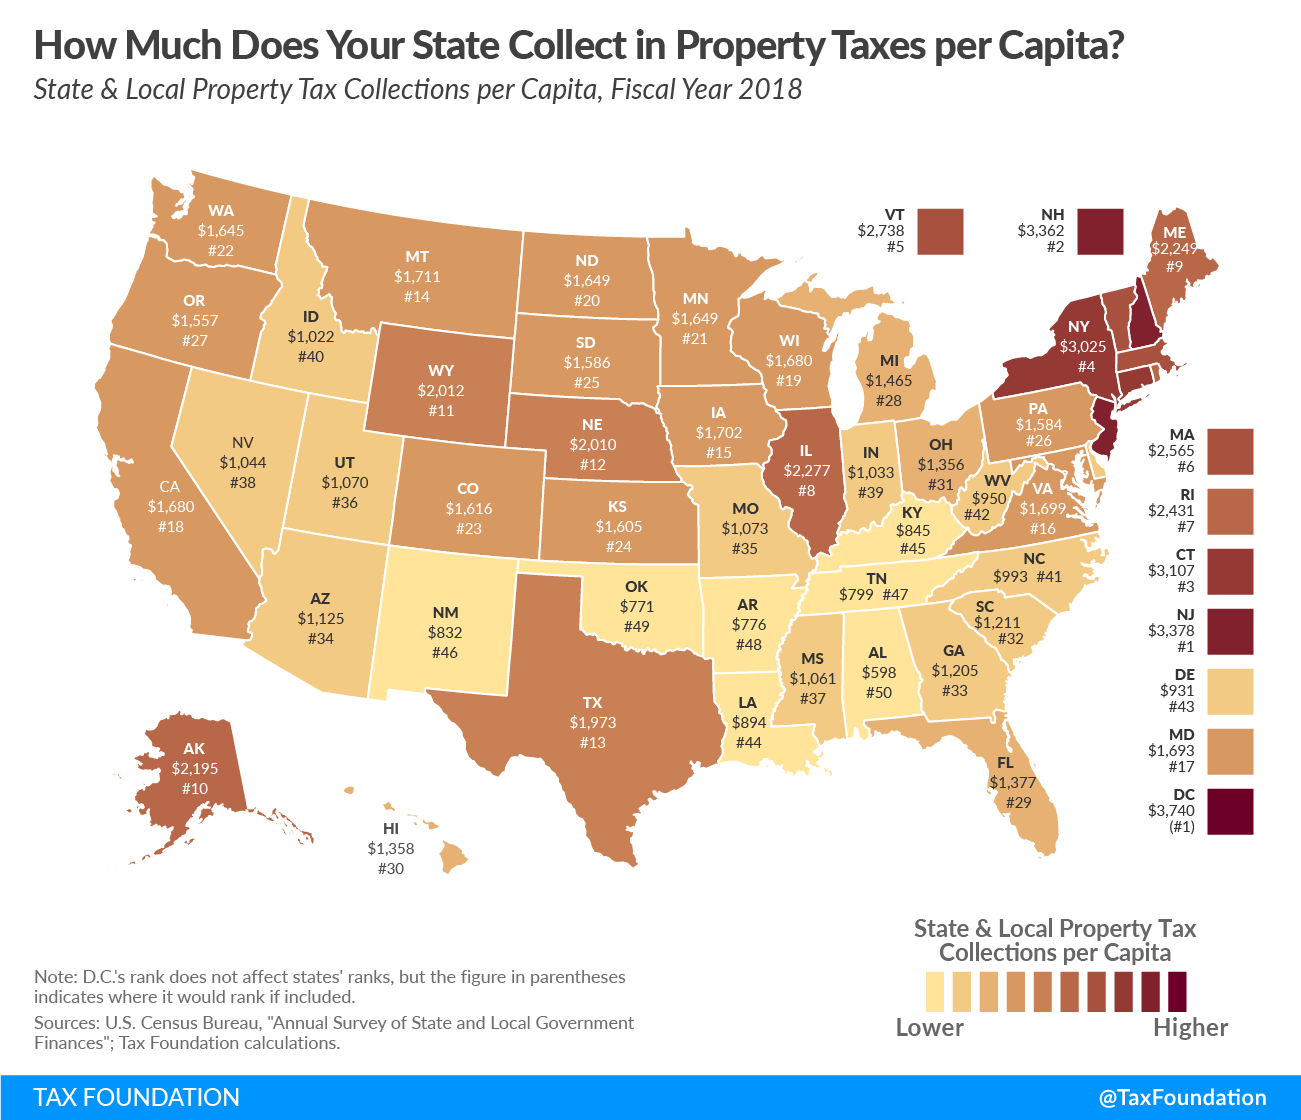 This map can only tell so much, as property taxes vary not only from state to state but also within states. While those with high property taxes are not celebrating these payments, it’s important to remember that property taxes are largely rooted in the “benefit principle,” meaning that the amount of tax paid is roughly commensurate with the value of public benefits received. Police and fire services, for instance, are, among other things, protection against loss of property—and the cost of private insurance and security services rises as the value of the protected property increases. At the same time, good local public services can make municipalities more desirable, thereby increasing residential property value. As such, higher property taxes tend to be found in urban and higher-income areas.
Property tax collection practices also vary from state to state, and sometimes within states. While some jurisdictions impose a rate or millage on the fair market value of property, others impose property taxes on some percentage (the assessment ratio) of the property’s fair market value, yielding an assessed value, with different assessment ratios for different classes of property (like residential, commercial, industrial, and agricultural). In some cases, moreover, agricultural and occasionally commercial property can be assessed on something other than fair market value, like the property’s income-producing potential.
Note: This map is part of a series on state and local tax collections per capita.
Facts and Figures: How Does Your State Compare?
Stay informed on the tax policies impacting you.
Subscribe to our free newsletter to get the latest tax data, news and analysis.
Subscribe