Key Findings
- Sales taxes account for about one-third of state taxA tax is a mandatory payment or charge collected by local, state, and national governments from individuals or businesses to cover the costs of general government services, goods, and activities. revenue, but most sales taxes are imposed on narrow—and still-narrowing—bases, with average sales taxA sales tax is levied on retail sales of goods and services and, ideally, should apply to all final consumption with few exemptions. Many governments exempt goods like groceries; base broadening, such as including groceries, could keep rates lower. A sales tax should exempt business-to-business transactions which, when taxed, cause tax pyramiding. breadth of only 30.63 percent and a median of 36.26 percent.
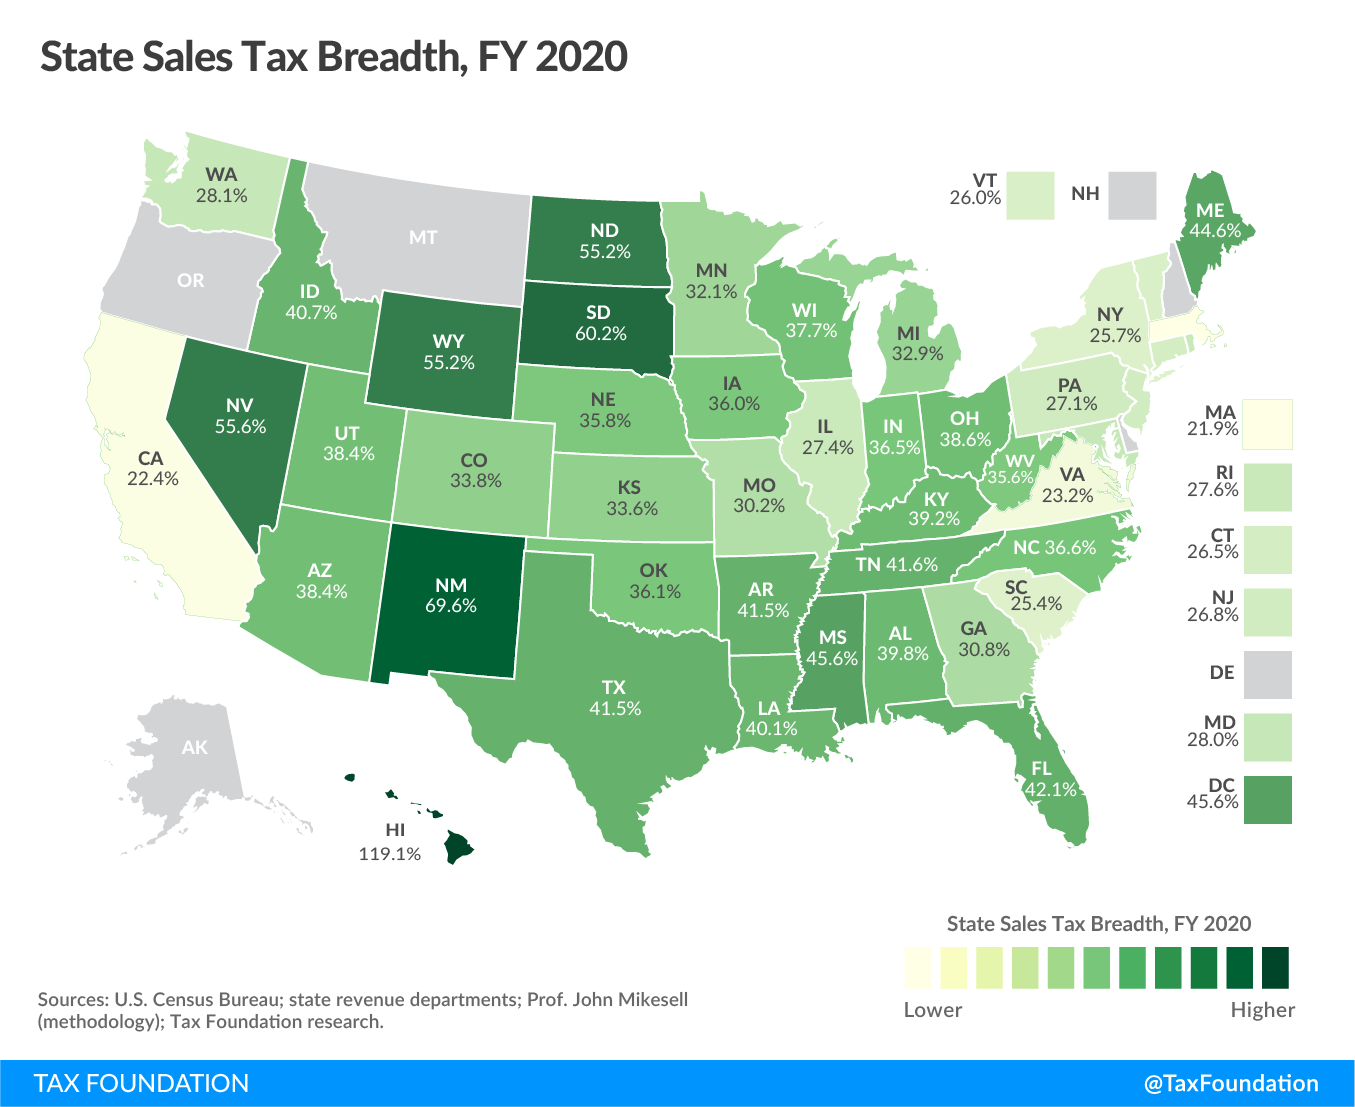
- Sales tax bases range from 21.91 percent of personal income in Massachusetts to 119.10 percent in Hawaii; the Massachusetts base is extremely narrow, while the Hawaii base features significant tax pyramidingTax pyramiding occurs when the same final good or service is taxed multiple times along the production process. This yields vastly different effective tax rates depending on the length of the supply chain and disproportionately harms low-margin firms. Gross receipts taxes are a prime example of tax pyramiding in action. .
- Within states with a sales tax, the mean taxpayer cost of sales taxes is $1,063, or about $178 per percentage point on the tax rate.
- An ideal sales tax is imposed on all final consumption, both goods and services, but excludes intermediate transactions to avoid tax pyramiding.
- Sales tax breadth has declined from a mean of 49.98 percent in 2000 to the current 30.63 percent, reflecting continued erosion that has largely been offset by an increase in the mean state rate from 5.16 to 5.99 percent over the period.
Introduction
Sales taxes account for almost exactly one-third of all state tax revenue, second only to individual income taxes (36 percent) in their contribution to state receipts. Reliance on sales taxes, however, ranges from a low of less than 16 percent in Vermont (neglecting the five states which do not impose state-level sales taxes) to a high of nearly 68 percent in Texas. State reliance on sales tax depends on its mix of other taxes (Texas, for instance, forgoes income taxes, while Vermont has high-rate income taxes), its sales tax rate, and, importantly, the breadth of its sales tax base.
The narrowest base, in Massachusetts, is less than 22 percent of personal income, whereas the broadest base, in Hawaii, is almost six times that at 119 percent of personal income. The ideal sales tax baseThe tax base is the total amount of income, property, assets, consumption, transactions, or other economic activity subject to taxation by a tax authority. A narrow tax base is non-neutral and inefficient. A broad tax base reduces tax administration costs and allows more revenue to be raised at lower rates. consists of all final consumption, both goods and services, while exempting intermediate goods to avoid tax pyramiding, where the tax is imposed multiple times on the same final product. The Massachusetts base is woefully narrow, riddled with exemptions and excluding vast swaths of personal consumption. Hawaii’s base, by contrast, while including certain economically inefficient inclusions, has elements of gross receipts taxation and frequently double-taxes transactions. (It also benefits substantially from spending by tourists.) Both states miss the mark—in opposite directions.
Consumption taxes are among the more economically efficient forms of taxation and are a major component of tax systems across the world. However, consumption taxes play a much smaller role in the United States than they do in most other highly developed countries, which often impose value-added taxes (VATs) at the national level. In fact, the U.S. is the only nation in the Organisation for Economic Co-operation and Development (OECD) which does not levy a VAT, and overall American reliance (at all levels of government) on consumption taxes is scarcely more than one-third the OECD average.[1] While the federal government does impose excise taxes on certain goods and services, like motor fuel, tobacco, alcohol, airfare, and certain health expenditures, most consumption taxA consumption tax is typically levied on the purchase of goods or services and is paid directly or indirectly by the consumer in the form of retail sales taxes, excise taxes, tariffs, value-added taxes (VAT), or income taxes where all savings are tax-deductible. revenue in the United States is generated at the state and local level—primarily through retail sales taxes.
Despite the importance of sales taxes to state coffers, and notwithstanding the economic arguments for reliance on a broad-based, low-rate sales tax regime (for which the case is made below), state sales tax bases are narrowing, forcing states to either raise rates or shift to other sources of tax revenue in response to this continuous erosion. These trends will continue until states undertake meaningful sales tax modernization.[2]
Standardized Collections and Burdens
In fiscal year 2020, state retail sales taxes yielded $340 billion in revenue and accounted for 33.1 percent of state tax collections at a tax cost of $1,035 per person. Five states—Alaska, Delaware, Montana, New Hampshire, and Oregon—forgo a state-level sales tax. Among the 45 states and the District of Columbia which levy state-level sales taxes, reliance is 33.8 percent, and the per capita burden is $1,063 with a weighted average state sales tax rate of 5.99 percent (excluding local sales taxes).
For purposes of these calculations, states’ reported sales tax collections are adjusted to reflect the different ways states report their sales tax revenues to the U.S. Census Bureau. In most states, for instance, the sale of an automobile—a big-ticket item that generates substantial sales tax revenue—is subject to state sales tax (sometimes with a dollar cap) and the resulting revenue is reported as sales tax revenue. In 10 states, however, the tax on automobiles is imposed at the same rate as the general sales tax, and revenues are deposited into the general fund, but the state reports this revenue as selective rather than general sales tax revenue. Since the tax treatment is functionally identical regardless of the name or reporting standards applied, we adjust to “normalize” the treatment. Similarly, some state-collected shares of local sales taxes are included in Census data, along with revenues that are properly attributable to separate excise or gross receipts taxes. We account for these and other disparities in revenue reporting.[3]
Accordingly, the adjusted retail sales tax figures used here differ from those reported by the U.S. Census Bureau, which are frequently cited, including by the Tax Foundation, in other contexts. In these adjustments, and in our broader methodology and approach, we continue the work of the late Professor John Mikesell, the former Chancellor’s Professor of Public and Environmental Affairs Emeritus at Indiana University, who developed this methodology and maintained these datasets for many years.[4]
Table 1 presents data on total state tax revenues, adjusted sales tax revenues, per capita sales tax burdens overall and per percentage point of the state sales tax rate, and sales tax revenues as a percentage of personal income. Notably, states which generate low sales tax revenue per percentage of the rate, indicative of a narrower sales tax base (see Table 2), tend not to make up the difference through higher rates, though rates are strongly inversely correlated with both per capita collections per percentage of rate and sales tax breadth, with coefficients of -0.30 and -0.31 respectively. The average sales tax rate is just under 0.5 percent higher among states in the bottom third on collections per percentage of the rate as it is for those in the top third, and 0.37 percentage points lower when ranked by sales tax breadth as a percentage of state personal income.
| State | Total State Tax Revenue (in thousands) | Adjusted Sales Tax Revenue (in thousands) | Per Capita Retail Sales Tax Revenue | Per Capita Sales Tax Revenue per Percentage of Rate | Sales Tax Revenue as a Percentage of Personal Income |
|---|---|---|---|---|---|
| Alabama | $11,709,000 | $3,448,943 | $703.41 | $175.85 | 1.59% |
| Arizona | $16,808,000 | $7,203,137 | $989.62 | $176.72 | 2.15% |
| Arkansas | $10,273,000 | $3,633,000 | $1,203.86 | $185.21 | 2.70% |
| California | $169,866,000 | $42,717,000 | $1,081.11 | $149.12 | 1.62% |
| Colorado | $14,195,000 | $3,448,000 | $598.74 | $206.46 | 0.98% |
| Connecticut | $15,095,000 | $4,639,000 | $1,301.16 | $204.91 | 1.68% |
| District of Columbia | $8,373,000 | $1,609,000 | $2,279.85 | $379.97 | 2.73% |
| Florida | $44,034,000 | $28,467,000 | $1,325.42 | $220.90 | 2.53% |
| Georgia | $22,947,000 | $6,307,000 | $594.02 | $148.51 | 1.23% |
| Hawaii | $7,897,000 | $3,845,761 | $2,716.18 | $679.04 | 4.76% |
| Idaho | $5,290,000 | $2,004,000 | $1,121.39 | $186.90 | 2.44% |
| Illinois | $45,290,000 | $12,771,494 | $1,007.87 | $161.26 | 1.72% |
| Indiana | $20,960,000 | $8,364,445 | $1,242.45 | $177.49 | 2.55% |
| Iowa | $10,546,000 | $3,532,000 | $1,119.47 | $186.58 | 2.16% |
| Kansas | $9,670,000 | $3,400,000 | $1,167.06 | $179.55 | 2.18% |
| Kentucky | $12,882,000 | $4,598,414 | $1,029.26 | $171.54 | 2.35% |
| Louisiana | $11,971,000 | $3,941,000 | $847.75 | $190.50 | 1.79% |
| Maine | $4,867,000 | $1,670,000 | $1,242.36 | $225.88 | 2.45% |
| Maryland | $22,910,000 | $6,574,402 | $1,087.45 | $181.24 | 1.68% |
| Massachusetts | $28,875,000 | $7,002,000 | $1,015.89 | $162.54 | 1.37% |
| Michigan | $27,811,000 | $9,711,000 | $972.38 | $162.06 | 1.98% |
| Minnesota | $26,790,000 | $7,319,149 | $1,297.81 | $188.77 | 2.21% |
| Mississippi | $8,013,000 | $3,694,000 | $1,241.20 | $177.31 | 3.19% |
| Missouri | $12,409,000 | $3,811,000 | $620.94 | $146.97 | 1.28% |
| Nebraska | $5,811,000 | $2,077,282 | $1,073.86 | $195.25 | 1.97% |
| Nevada | $9,870,000 | $5,999,000 | $1,947.63 | $284.33 | 3.81% |
| New Jersey | $37,927,000 | $11,121,000 | $1,252.06 | $188.99 | 1.78% |
| New Mexico | $7,278,000 | $3,238,532 | $1,544.49 | $301.36 | 3.56% |
| New York | $80,885,000 | $14,345,195 | $737.41 | $184.35 | 1.03% |
| North Carolina | $28,172,000 | $8,708,000 | $830.28 | $174.79 | 1.74% |
| North Dakota | $4,337,000 | $1,204,520 | $1,580.61 | $316.12 | 2.76% |
| Ohio | $30,581,000 | $13,012,000 | $1,113.17 | $193.60 | 2.22% |
| Oklahoma | $9,929,000 | $3,039,830 | $768.22 | $170.72 | 1.62% |
| Pennsylvania | $39,087,000 | $12,075,000 | $943.21 | $157.20 | 1.63% |
| Rhode Island | $3,564,000 | $1,155,000 | $1,090.28 | $155.75 | 1.93% |
| South Carolina | $11,305,000 | $3,571,000 | $693.57 | $115.60 | 1.53% |
| South Dakota | $2,015,000 | $1,292,873 | $1,461.44 | $324.76 | 2.71% |
| Tennessee | $16,564,000 | $9,681,000 | $1,417.59 | $202.51 | 2.91% |
| Texas | $58,527,000 | $39,734,894 | $1,370.36 | $219.26 | 2.59% |
| Utah | $9,073,000 | $2,920,000 | $910.80 | $149.31 | 1.86% |
| Vermont | $3,423,000 | $538,812 | $863.50 | $114.18 | 1.24% |
| Virginia | $23,129,000 | $5,373,245 | $629.50 | $118.78 | 1.06% |
| Washington | $27,220,000 | $8,995,457 | $1,181.30 | $181.74 | 1.82% |
| West Virginia | $5,587,000 | $1,618,565 | $903.14 | $150.52 | 2.13% |
| Wisconsin | $18,903,000 | $5,836,000 | $1,002.33 | $200.47 | 1.88% |
| Wyoming | $1,968,000 | $795,000 | $1,373.63 | $343.41 | 2.21% |
| Mean | $1,063.01 | $177.53 | 1.83% | ||
| Median | $1,088.87 | $183.04 | 1.97% | ||
|
Sources: U.S. Census Bureau; state revenue departments; Prof. John Mikesell (methodology); Tax Foundation research. |
|||||
Sales Tax Breadth and Reliance
Public finance scholars and tax policy researchers have their fair share of disagreements on taxation, but the sales tax is an area of surprising consensus. Decades ago, scholar John Due wrote that “sales tax structure should produce a uniform distribution in consumption, should be neutral regarding methods of production and distribution, and should be collected at a reasonable cost.”[5] Another leading tax scholar, Charles McLure, identified the ideal sales tax as a destination-based tax on all final consumption (but only final consumption).[6] These standards are broadly accepted, as are several related precepts and observations:
- An ideal sales tax is imposed on all final consumption, both goods and services;
- An ideal sales tax exempts all intermediate transactions (business inputs) to avoid tax pyramiding;
- Sales taxes should be destination-based, meaning that tax is owed in the state and jurisdiction where the good or service is consumed;
- The sales tax is more economically efficient than many competing forms of taxation, including the income tax, because it only falls on present consumption, not saving or investment;
- Because lower-income individuals have lower savings rates and consume a greater share of their income, the sales tax can be regressive, though broadening the base to include additional consumer services (much more heavily consumed by higher-income individuals) represents a progressive change;
- The sales tax scales well with ability to pay, because it grows with consumption and is therefore more discretionary than many other forms of taxation; and
- Consumption is a more stable tax base than income, though the failure to tax most consumer services is leading to a gradual erosion of sales tax revenues as services become an ever-larger share of consumption.
Taxes should apply to all final consumption in service of economic neutrality, the idea that taxes should not interfere with economic decision-making any more than is strictly necessary, nor should they pick winners and losers. It is not the role of the tax code to favor piano lessons over baseball bats or e-books over hardcovers. It makes little sense to tax the purchase of a lawnmower but not tax the purchase of lawn care services that obviate the need to own a mower.
The sales tax should also be broad-based in service of tax equity.[7] Sales taxes have two potential sources of regressivity: one, the propensity of lower-income individuals to consume a greater share of their income, and two, a scope of taxable consumption that is more likely to fall on the sorts of transactions which dominate the consumption of lower- and middle-income individuals.
Policymakers often exempt or lower rates on certain classes of consumption as a progressive reform. Utah’s reduced rate on groceries is one such example—though there is reason to believe it may not be terribly effective. Prepared foods are taxed at the standard rate and most of the progressivity of taxing unprepared foods is addressed by the exemption for SNAP (food stamps) and WIC purchases, while the exemption is enjoyed by high-income earners as well—who often spend considerably more on groceries.
In fact, while not enough work has been undertaken to establish a consensus, there is research finding that lower-income taxpayers would actually be better off if groceries were fully included in sales tax bases (while retaining the federally-indicated exemption of SNAP and WIC purchases) and revenue-neutral adjustments made to the tax rate.[8] The lower grocery rate is designed to create progressivity but largely fails to do so. Yet, at the same time, policymakers have largely neglected a much more straightforward way to promote equity within the sales tax.
Consumption of personal services tends to be more discretionary than consumption of goods. Consequently, higher-income individuals tend to spend a greater share of income on services, which are frequently untaxed. Expanding the sales tax base to additional services rights an accidental wrong in the sales tax as currently formulated, one that presently favors wealthier individuals.
While ideal sales tax bases are broad, however, they should not be so broad as to cover intermediate transactions, often called business inputs. To varying degrees, these business-to-business transactions are taxed in every state with a sales tax, meaning that the sales tax is often embedded in the final price of a good or service several times over. This is not an ineluctable law of consumption taxes, but it has, unfortunately, been the reality in the United States.
In Europe, VATs are structurally designed to avoid such double taxation; while each stage of production is taxed, the tax only falls on the incremental increase in value, such that, when the product is finally sold to a consumer, the VAT is imposed on 100 percent of its value—no more, no less. Theoretically, a retail sales tax could also exempt business inputs altogether, either by adopting a sufficiently robust set of exemptions or by tying the exemption to the identity of the purchaser rather than the nature of the product. In practice, though, no state has succeeded in eliminating all business inputs from the sales tax base, even though state revenue offices frequently cite it as an important principle of sales taxation.
A well-structured sales tax is imposed on all final consumer goods and services while exempting all purchases made by businesses that will be used as inputs in the production process. This is not because businesses deserve special treatment under the tax code, but because applying the sales tax to business inputs results in multiple layers of taxation embedded in the price of goods once they reach final consumers, a process known as “tax pyramiding.” The result is higher and inequitable effective tax rates for different industries and products, which is both nonneutral and nontransparent, hiding actual tax costs from consumers.
Fundamentally, the sales tax is designed as a tax on household consumption, and it works poorly when applied to any other base. As Professor Mikesell, who created and long maintained this series on sales tax breadth, once explained:
What tax policy is a retail sales tax expected to be carrying out? Its essential logic is to distribute the cost of government according to household consumption expenditure. It is not an effective handle on any other fundamental base. It is not an income tax because it makes no allowance for costs associated with generating receipts from sales. It is not a punitive excise on use of resources in ways that are luxurious or harmful to ourselves or others. It is not a business activity tax with intent to distribute the cost of government according to business utilization of public services. It is the U.S. approach, albeit an imperfect one, to impose a general levy on consumption expenditure, collected on an indirect or transaction basis like the value-added tax, but applied only at the last transaction in the chain of production and distribution leading to the household consumer. If the intent is to distribute governmental cost on a basis other than household consumption, some tax format other than the retail sales tax should be applied.[9]
Table 2 provides data on sales tax breadth and reliance, along with each state’s statutory state-level rate as of 2020. Reliance is defined as retail sales tax collections as a percentage of total state tax revenue, and breadth represents the share of the state’s economy, as measured by state personal income, included in the sales tax base.
| State | Rate | Reliance | Breadth |
|---|---|---|---|
| Alabama | 4.00% | 29.46% | 39.84% |
| Arizona | 5.60% | 42.86% | 38.37% |
| Arkansas | 6.50% | 35.36% | 41.50% |
| California | 7.25% | 25.15% | 22.38% |
| Colorado | 2.90% | 24.29% | 33.76% |
| Connecticut | 6.35% | 30.73% | 26.51% |
| District of Columbia | 6.00% | 19.22% | 45.56% |
| Florida | 6.00% | 64.65% | 42.14% |
| Georgia | 4.00% | 27.49% | 30.79% |
| Hawaii | 4.00% | 48.70% | 119.10% |
| Idaho | 6.00% | 37.88% | 40.66% |
| Illinois | 6.25% | 28.20% | 27.44% |
| Indiana | 7.00% | 39.91% | 36.46% |
| Iowa | 6.00% | 33.49% | 35.97% |
| Kansas | 6.50% | 35.16% | 33.61% |
| Kentucky | 6.00% | 35.70% | 39.19% |
| Louisiana | 4.45% | 32.92% | 40.14% |
| Maine | 5.50% | 34.31% | 44.61% |
| Maryland | 6.00% | 28.70% | 28.04% |
| Massachusetts | 6.25% | 24.25% | 21.91% |
| Michigan | 6.00% | 34.92% | 32.92% |
| Minnesota | 6.875% | 27.32% | 32.09% |
| Mississippi | 7.00% | 46.10% | 45.57% |
| Missouri | 4.225% | 30.71% | 30.21% |
| Nebraska | 5.50% | 35.75% | 35.82% |
| Nevada | 6.85% | 60.78% | 55.57% |
| New Jersey | 6.625% | 29.32% | 26.82% |
| New Mexico | 5.125% | 44.50% | 69.56% |
| New York | 4.00% | 17.74% | 25.71% |
| North Carolina | 4.75% | 30.91% | 36.59% |
| North Dakota | 5.00% | 27.77% | 55.23% |
| Ohio | 5.75% | 42.55% | 38.57% |
| Oklahoma | 4.50% | 30.62% | 36.06% |
| Pennsylvania | 6.00% | 30.89% | 27.09% |
| Rhode Island | 7.00% | 32.41% | 27.63% |
| South Carolina | 6.00% | 31.59% | 25.44% |
| South Dakota | 4.50% | 64.16% | 60.18% |
| Tennessee | 7.00% | 58.45% | 41.60% |
| Texas | 6.25% | 67.89% | 41.52% |
| Utah | 4.85% | 32.18% | 38.37% |
| Vermont | 6.00% | 15.74% | 26.03% |
| Virginia | 5.30% | 19.91% | 23.23% |
| Washington | 6.50% | 33.05% | 28.06% |
| West Virginia | 6.00% | 28.97% | 35.57% |
| Wisconsin | 5.00% | 30.87% | 37.66% |
| Wyoming | 4.00% | 40.40% | 55.22% |
| Mean | 5.98% | 33.85% | 30.63% |
| Median | 6.00% | 32.30% | 36.26% |
|
Sources: U.S. Census Bureau; state revenue departments; Prof. John Mikesell (methodology); Tax Foundation research. |
|||
The median sales tax rate in 2020 was 6.0 percent, and mean reliance on state sales taxes in the 45 states (plus the District of Columbia) which impose them was 33.85 percent (median of 32.30 percent). Vermont (15.74 percent), New York (17.74 percent), the District of Columbia (19.22 percent), and Virginia (19.91 percent) generate less than 20 percent of state tax revenue from sales taxes, while another four states derive more than 60 percent of revenue from it: led by Texas (67.89 percent), Florida (64.65 percent), South Dakota (64.16 percent), and Nevada (60.78 percent).
Similarly, sales tax breadth is below 30 percent in 13 states, led by Massachusetts (21.91 percent), California (22.38 percent), and Virginia (23.23 percent), and above 60 percent in another three states: Hawaii (119.10 percent), New Mexico (69.56 percent), and South Dakota (60.18 percent). Mean sales tax breadth is 30.63 percent, while the median is notably higher at 36.26 percent. In the vast majority of states, sales taxes continue to be imposed on artificially narrow bases.
Sales tax breadth has narrowed in recent years, as personal services (largely exempted) have grown as a share of final consumption and lawmakers have continued to carve out existing tax bases. Professor Mikesell calculated a mean sales tax breadth of 49.98 percent in 2000,[10] which has plummeted to 30.63 percent in 2020. Unsurprisingly, rates have risen: the mean state rate was 5.16 percent in 2000 compared to 5.99 percent today (medians of 5.0 and 6.0 percent, respectively) even as reliance has fallen slightly, from a mean of 35.29 percent to today’s 33.85 percent (medians of 33.54 and 32.30 percent, respectively).
| FY 2000 | FY 2020 | ||||||
|---|---|---|---|---|---|---|---|
| Rate | Reliance | Breadth | Rate | Reliance | Breadth | ||
| Mean | 5.16% | 35.29% | 49.98% | 5.98% | 33.85% | 30.63% | |
| Median | 5.00% | 33.54% | 48.18% | 6.00% | 32.30% | 36.26% | |
|
Sources: Prof. John Mikesell (2000 calculations); Tax Foundation analysis (2020 calculations). |
|||||||
Conclusion
Sales taxes raise about the same amount as a percentage of state tax revenue as they did two decades ago, but this relative stability belies an important shift, with higher rates compensating for continuous base erosion. By failing to keep pace with modern consumption patterns, sales taxes have become less neutral, less equitable, and less economically efficient over time. States vary dramatically in sales tax breadth, but nearly all are below what most economists and public finance scholars would recommend, even as each state includes some share of intermediate transactions, which should appropriately be exempted to avoid tax pyramiding. The sales tax is too important a part of states’ revenue toolkits to be permitted further erosion, making sales tax modernization a vital project of the 2020s.
Stay informed on the tax policies impacting you.
Subscribe to get insights from our trusted experts delivered straight to your inbox.
Subscribe[1] David Bradbury and Stéphane Buydens, “Consumption Tax Trends 2019 – the United States,” OECD Centre for Tax Policy and Administration, 2019, https://www.oecd.org/tax/consumption/consumption-tax-trends-united-states.pdf.
[2] For a discussion of what sales tax modernization could look like, and why it is worth pursuing, see Jared Walczak, “Modernizing Utah’s Sales Tax: A Guide for Policymakers,” Tax Foundation, June 4, 2019, https://taxfoundation.org/modernizing-utah-sales-tax/.
[3] Additions to Census-reported figures include sales taxes on lodging in Alabama and Illinois, taxes on motor vehicle rentals in Illinois, Minnesota, New Mexico, and Texas; taxes on motor vehicle sales in Illinois, Kentucky, Maryland, Minnesota, New Mexico, North Dakota, Texas, Vermont, Virginia, and West Virginia; watercraft taxes in New Mexico and Virginia; aircraft taxes in Oklahoma and Virginia; the Indiana gasoline usage tax; the Illinois in-lieu cigarette tax; and the South Dakota contractors excise tax. Subtractions include gross receipts taxes in Texas and Washington; state-collected local sales and transportation taxes in Arizona, Nebraska, New York, and Virginia; Arizona severance tax components of the transaction privilege tax; and portions of the Hawaii general excise taxAn excise tax is a tax imposed on a specific good or activity. Excise taxes are commonly levied on cigarettes, alcoholic beverages, soda, gasoline, insurance premiums, amusement activities, and betting, and typically make up a relatively small and volatile portion of state and local and, to a lesser extent, federal tax collections. with nonstandard rates.
[4] For a discussion of his methodology, see John L. Mikesell, “State Retail Sales Taxes: Revenue Performance for Fiscal 2015,” Tax Notes Today State, Mar. 8, 2017, https://www.taxnotes.com/tax-notes-today-state/budgets/state-retail-sales-taxes-revenue-performance-fiscal-2015/2017/03/08/ckzp. For his most recent dataset, see John L. Mikesell, “State Retail Sales Taxes in 2018,” Tax Notes Today State, Aug. 6, 2019, https://www.taxnotes.com/tax-notes-today-state/individual-income-taxation/state-retail-sales-taxes-2018/2019/08/06/29nr3. We have sought to replicate his methodology as closely as possible to permit comparability with his prior published figures.
[5] Quoted in John L. Mikesell, “A Quality Index for State Sales Tax Structure – Measuring the States Against an Ideal Standard,” Tax Notes Today State, Jan. 26, 2005, https://www.taxnotes.com/state-tax-today/sales-and-use-taxation/corrected-full-text-states-mind-quality-index-state-sales-tax-structure-measuring-states-against/2005/01/26/4c5r.
[6] Charles E. McLure Jr., “Rethinking State and Local Reliance on the Retail Sales Tax: Should We Fix the Sales Tax or Discard It?” BYU Law Review 2000:1 (Mar. 1, 2000), 77, https://digitalcommons.law.byu.edu/cgi/viewcontent.cgi?article=2052&context=lawreview.
[7] See generally, Nicole Kaeding, “Sales Tax Base BroadeningBase broadening is the expansion of the amount of economic activity subject to tax, usually by eliminating exemptions, exclusions, deductions, credits, and other preferences. Narrow tax bases are non-neutral, favoring one product or industry over another, and can undermine revenue stability. : Right-Sizing a State Sales Tax,” Tax Foundation, Oct. 24, 2017, https://taxfoundation.org/sales-tax-base-broadening/.
[8] Steven M. Sheffrin and Anna Johnson, “Rethinking the Sales Tax Food Exclusion with SNAP Benefits,” State Tax Notes, Jan. 11, 2016, 157, https://papers.ssrn.com/sol3/papers.cfm?abstract_id=2597228.
[9] John L. Mikesell, “Quality Index for State Sales Tax Structure – Measuring the States Against an Ideal Standard.”
[10] John L. Mikesell, “State Retail Sales Taxes in 2018.”
Share this article