Key Findings
- A typical American household with four phones on a “family share” plan, paying $100 per month for taxable wireless service, would pay nearly $305 per year in taxes, fees, and government surcharges—up slightly from $300 in 2021.
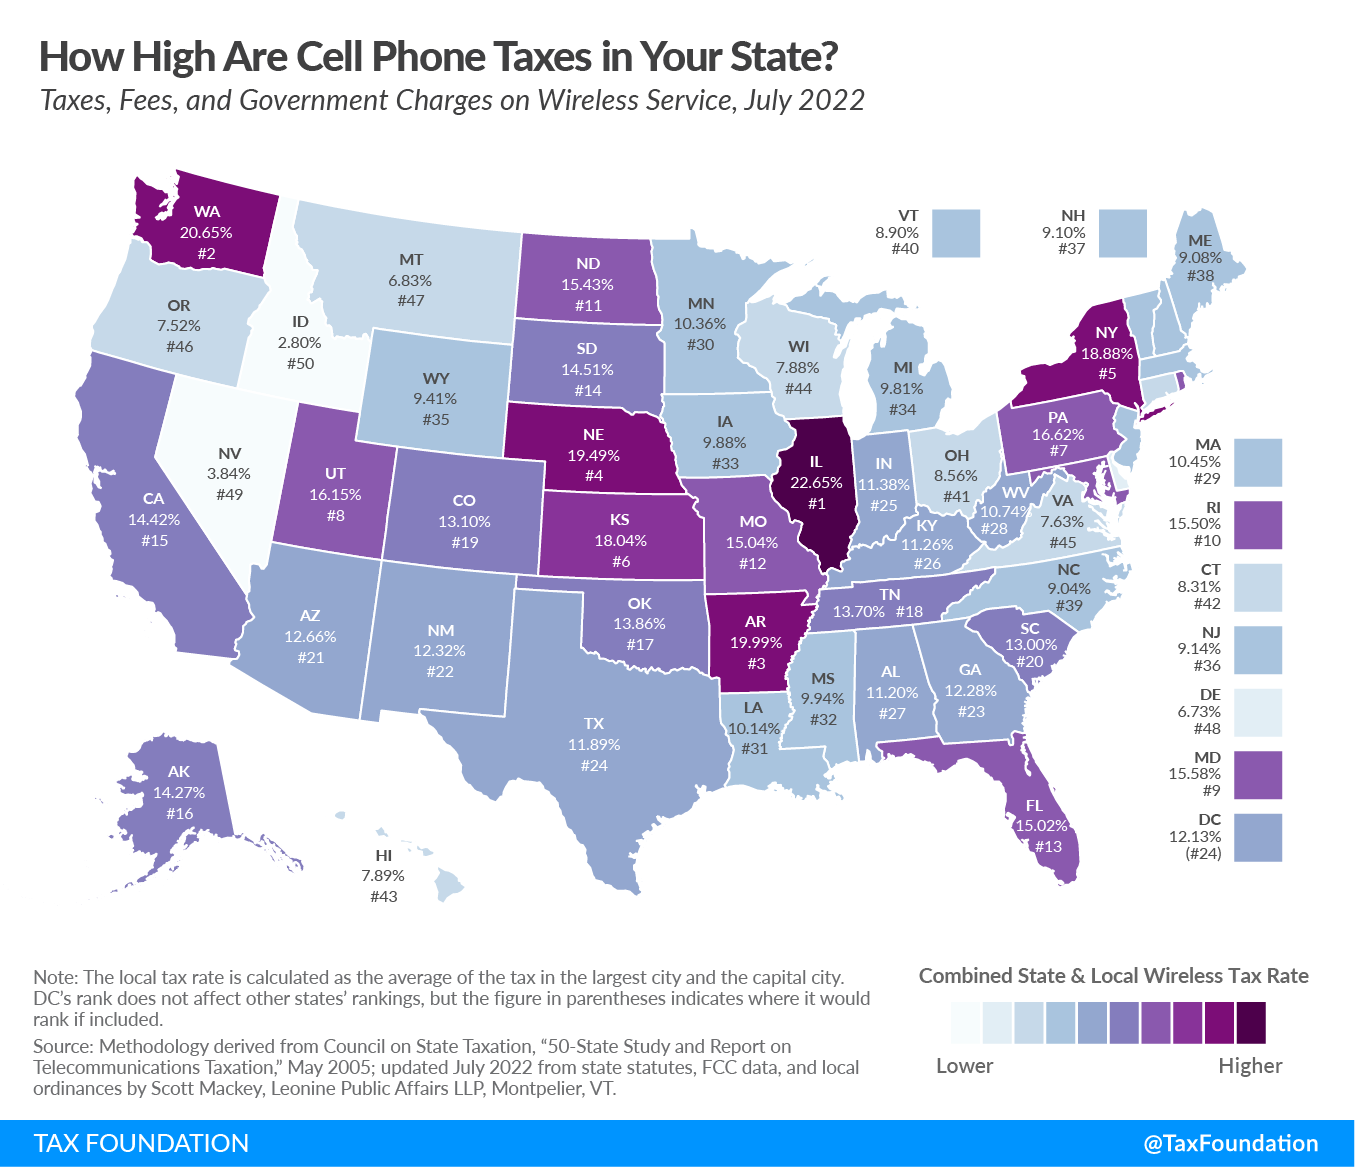
- Nationally, taxes, fees, and government surcharges make up a record-high 25.4 percent taxA tax is a mandatory payment or charge collected by local, state, and national governments from individuals or businesses to cover the costs of general government services, goods, and activities. on taxable voice services. Illinois continues to have the highest wireless taxes in the country at 34.9 percent, followed by Washington at 32.9 percent, and Arkansas at 32.2 percent. Idaho has the lowest wireless tax at 15.0 percent.
- Indiana had the largest wireless tax reduction of any state in 2022—from 12.3 percent to 11.4 percent—because it repealed the utility gross receipts taxGross receipts taxes are applied to a company’s gross sales, without deductions for a firm’s business expenses, like compensation, costs of goods sold, and overhead costs. Unlike a sales tax, a gross receipts tax is assessed on businesses and applies to transactions at every stage of the production process, leading to tax pyramiding..
- For the first time since 2012, state and local wireless tax rates did not increase, dropping slightly from 13.16 percent to 13.15 percent. However, the Federal Universal Service Fund (FUSF) charge increased again, to 12.24 percent of taxable wireless service.
- The federal Permanent Internet Tax Freedom Act prevents state and local governments from imposing taxes and fees on wireless internet access. Without this federal prohibition, taxes and fees that apply to wireless voice services could be applied to internet access and significantly increase the tax burden on wireless bills.
- Including bundled (untaxable) data services, the average tax rateThe average tax rate is the total tax paid divided by taxable income. While marginal tax rates show the amount of tax paid on the next dollar earned, average tax rates show the overall share of income paid in taxes. on voice-and-data plans is 12.1 percent.
- Since 2012, the average charge from wireless providers decreased by 24 percent, from $47.00 per line per month to $35.74 per line. However, during this same time, wireless taxes, fees, and government surcharges increased from 17.2 percent to 25.4 percent of the average taxable portion of wireless bills.
- Roughly 76 percent of low-income adults and 68 percent of all adults lived in wireless-only households. Wireless taxes are regressive and create significant burdens on low-income families.
Table of Contents
Introduction
Taxes and fees on the typical American wireless consumer increased again this year, to a record 25.4 percent of the taxable (voice services) portion of a typical monthly bill. This total includes state and local taxes averaging 13.2 percent and the Federal Universal Service Fund (FUSF) rate of 12.2 percent.[1] State and local taxes and fees fell slightly from 2021 to 2022, but this drop was offset by a FUSF rate increase from 11.8 percent to 12.2 percent.
This is the 13th edition of our report tracking the taxes, fees, and government surcharges imposed on wireless voice service by federal, state, and local governments. Our methodology remains consistent. We compare the percentage rates of the taxes, fees, and government surcharges imposed on taxable wireless service, referred to hereafter as “tax.” Flat rate impositions, such as a $1.00 per month per line 911 fee, are converted to a percentage using the average monthly industry revenue per line as tracked by the Cellular Telecommunications and Internet Association (CTIA).
Over time, markets, product offerings, and government policies change. To incorporate these changes in our report, we include a new, alternate calculation. Federal law prohibits states from taxing internet access—including data plans—and internet access makes up over half of the cost of an average wireless consumer’s bill. To show how this limitation impacts tax collections and effective tax rates, we calculate taxes paid as a percentage of both taxable and non-taxable services. As data makes up a greater portion of our wireless consumption every year, services and products offered by wireless companies have adapted.
The wireless market has become increasingly competitive. The result has been steady declines in the average price for wireless services. Over the last decade, the average monthly revenue per wireless line has fallen from $47.00 per month to $35.74 per month. Unfortunately, this price reduction for consumers was partially offset by higher taxes.
There were about 490 million wireless subscriber connections at the end of 2021.[2] Wireless subscribers will pay approximately $11.2 billion in taxes, fees, and government surcharges to state and local governments in 2022 based on the tax rates calculated in this report:
- $5.5 billion in sales taxes and other non-discriminatory consumption taxes that apply to other taxable goods and services
- $3.7 billion in state and local 911 fees, which includes hundreds of millions of dollars that are not actually used for 911 purposes in some states
- $2.0 billion in additional telecommunications-specific taxes
Wireless service is often the sole means of communication and connectivity for Americans, especially younger people and those with low incomes. According to the Centers for Disease Control and Prevention (CDC), about 76 percent of all low-income adults and 68 percent of all adults lived in wireless-only households in 2021.[3] The $5.7 billion in state and local taxes and fees levied in addition to sales taxes disproportionately impact Americans least able to afford them.
Wireless Taxes and Fees Jump for Fifth Straight Year
Taxes, fees, and government surcharges on wireless service increased for the fifth straight year, driven by another increase in the FUSF rate. The state and local burden decreased slightly, from 13.16 percent to 13.15 percent, while the FUSF surcharge rate increased from 11.8 percent to 12.2 percent. Table 1 highlights the changes in wireless tax rates from 2003 to 2022.
| Weighted Average | ||||||
|---|---|---|---|---|---|---|
| Wireless – State & Local Tax & Fee | Wireless – Federal Tax & Fee | All Wireless Taxes & Fees | General Sales/Use Tax | State & Local Wireless vs. General Sales Tax | ||
| 1/1/2003 | 10.20% | 5.07% | 15.27% | 6.87% | 3.33% | |
| 4/1/2004 | 10.74% | 5.48% | 16.22% | 6.93% | 3.81% | |
| 7/1/2005 | 10.94% | 5.91% | 16.85% | 6.94% | 4.00% | |
| 7/1/2006 | 11.14% | 2.99% | 14.13% | 7.04% | 4.10% | |
| 7/1/2007 | 11.00% | 4.19% | 15.19% | 7.07% | 3.93% | |
| 7/1/2008 | 10.86% | 4.23% | 15.09% | 7.11% | 3.75% | |
| 7/1/2009 | 10.74% | 4.79% | 15.53% | 7.26% | 3.48% | |
| 7/1/2010 | 11.21% | 5.05% | 16.26% | 7.42% | 3.79% | |
| 7/1/2012 | 11.36% | 5.82% | 17.18% | 7.33% | 4.03% | |
| 7/1/2014 | 11.23% | 5.82% | 17.05% | 7.51% | 3.72% | |
| 7/1/2015 | 11.50% | 6.46% | 17.96% | 7.57% | 3.93% | |
| 7/1/2016 | 11.93% | 6.64% | 18.57% | 7.61% | 4.32% | |
| 7/1/2017 | 12.11% | 6.34% | 18.45% | 7.65% | 4.46% | |
| 7/1/2018 | 12.46% | 6.64% | 19.10% | 7.65% | 4.81% | |
| 7/1/2019 | 12.65% | 9.05% | 21.70% | 7.74% | 4.91% | |
| 7/1/2020 | 12.82% | 9.83% | 22.65% | 7.75% | 5.07% | |
| 7/1/2021 | 13.16% | 11.80% | 24.96% | 7.78% | 5.39% | |
| 7/1/2022 | 13.15% | 12.24% | 25.39% | 7.77% | 5.38% | |
|
Note: Federal includes 3 percent federal excise tax (until May 2006) and Federal Universal Service Fund (FUSF) charge, which is set by the FCC and varies quarterly. FUSF charge as of July 1, 2022, is calculated by 37.1 percent interstate safe harbor times 31.8 percent contribution factor, which equals a 11.8 percent effective tax rate. See Universal Service Administrative Co., “Contribution Factors,” https://www.usac.org/service-providers/making-payments/contribution-factors/. Source: Methodology derived from Council on State Taxation, “50-State Study and Report on Telecommunications Taxation,” May 2005; updated July 2022 from state statutes, FCC data, and local ordinances by Scott Mackey, Leonine Public Affairs LLP, Montpelier, VT. |
||||||
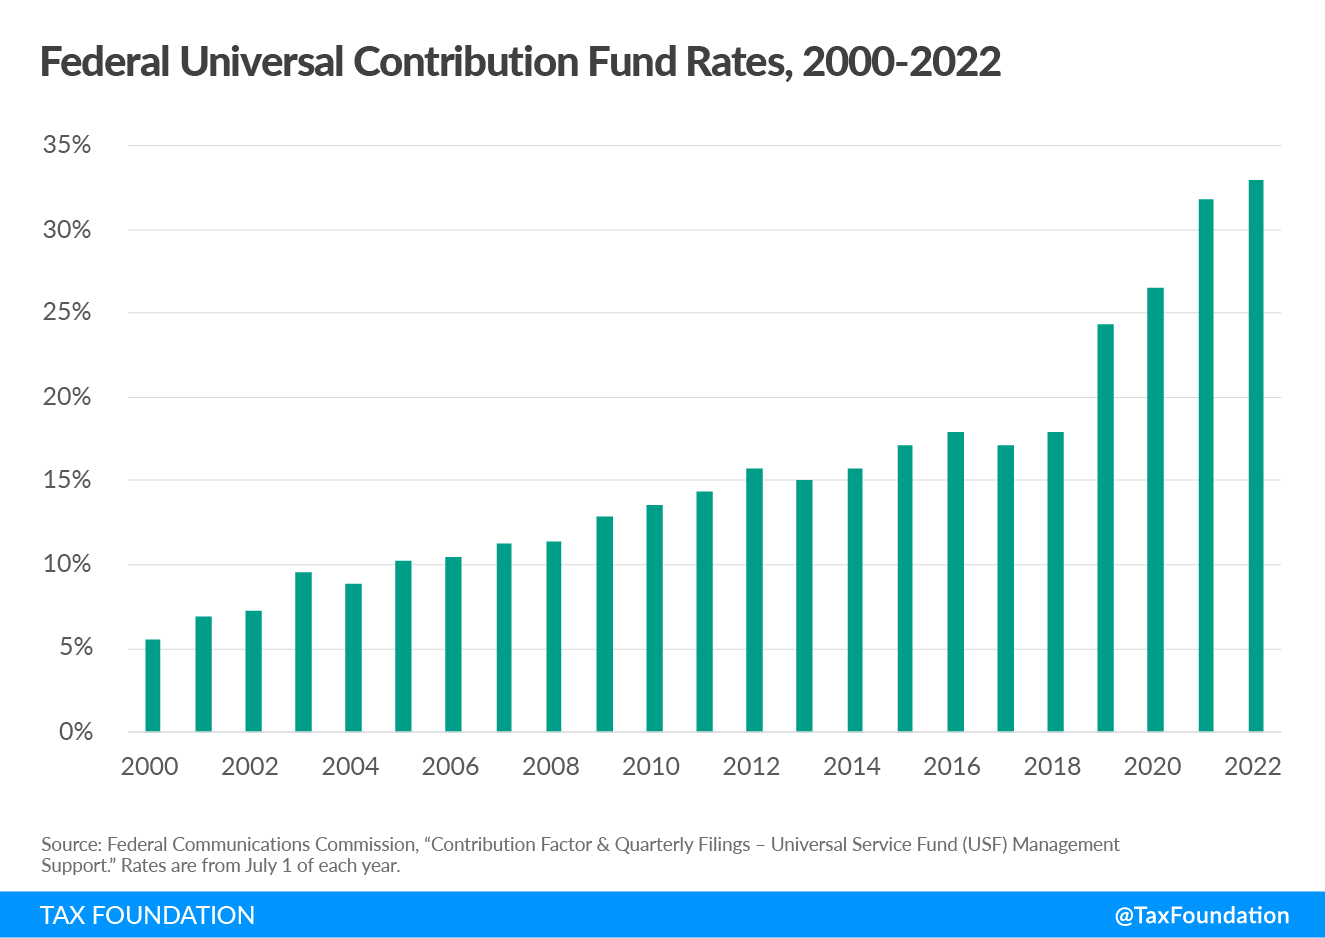
The rate of the FUSF surcharge has increased dramatically since 2018, from an effective rate of 6.6 percent in 2018 to 12.2 percent in 2022. The decline in the price of telecommunications service, combined with the shift in consumer purchases from telecommunications services to internet access, has forced the Federal Communications Commission (FCC) to increase rates just to keep revenues constant. As a result, consumers and businesses who purchase interstate telecommunications services pay very high surcharge rates.
Figure 1 ranks the states from highest to lowest in wireless taxes, fees, and government surcharges. Illinois has the highest wireless taxes in the country with state-local rates of nearly 23 percent. Washington, Arkansas, Nebraska, and New York round out the top five states. Idaho, Nevada, and Delaware have the lowest wireless taxes in the nation. The figure also maps the states by state and local tax rates. High tax states are distributed throughout the county, apart from the New England states, which tend to have lower rates.
States have debated whether to expand the sales tax base from tangible goods to services for decades, with proponents of expanding the sales taxA sales tax is levied on retail sales of goods and services and, ideally, should apply to all final consumption with few exemptions. Many governments exempt goods like groceries; base broadening, such as including groceries, could keep rates lower. A sales tax should exempt business-to-business transactions which, when taxed, cause tax pyramiding. base arguing that the disparity in taxation between taxable tangible goods and exempt services is not sensible. When it comes to wireless service, however, the exact opposite is true. As shown in Table 3, wireless service is subject to state and local taxes 1.7 times higher than the sales taxes imposed on goods, with the average state and local wireless tax rate over 13 percent and the average combined sales tax rate at about 7.8 percent. In 15 states, wireless taxes are more than twice as high as sales taxes. Three states that do not impose a sales tax—Delaware, Montana, and New Hampshire—have special taxes on wireless and other telecommunications services.
Total Taxes Paid
Wireless consumers will pay about $11.2 billion in taxes, fees, and government surcharges to state and local governments in 2022 based on the tax rates calculated in this report. About half of this amount—$5.5 billion—represents state and local sales and use taxes. These taxes are broadly applied to taxable goods and some services and do not apply solely to wireless service. The remaining $5.7 billion are taxes that apply only to wireless and other telecommunications services. These taxes are discussed further in the next section of the report.
Appendix C provides a detailed breakdown of every tax, fee, and government surcharge imposed by state and local governments in each state. In many states, local government impositions vary by individual jurisdictions with some cities or unincorporated areas within a state imposing no taxes and others imposing very high taxes. To facilitate interstate comparisons, local rates in the most populated city and the capital city in each state are averaged into a single rate. For a more detailed discussion of the methodology in this report, please see Appendix A.
The Permanent Internet Tax Freedom Act prevents state and local governments from imposing taxes on internet access services, including wireless internet access. Data from the U.S. Census Bureau suggests that more than half of all wireless service revenues are from internet access.[4] Without the protection of the federal law, the high excise tax rates applied to taxable wireless services could be applied to internet access and consumer tax burdens would be significantly higher.
| Wireless State-Local Rate | Federal USF Rate | Combined Federal/State/Local Rate | ||
|---|---|---|---|---|
| 1 | Illinois | 22.65% | 12.24% | 34.89% |
| 2 | Washington | 20.65% | 12.24% | 32.90% |
| 3 | Arkansas | 19.99% | 12.24% | 32.23% |
| 4 | Nebraska | 19.49% | 12.24% | 31.73% |
| 5 | New York | 18.88% | 12.24% | 31.12% |
| 6 | Kansas | 18.04% | 12.24% | 30.28% |
| 7 | Pennsylvania | 16.62% | 12.24% | 28.86% |
| 8 | Utah | 16.15% | 12.24% | 28.39% |
| 9 | Maryland | 15.58% | 12.24% | 27.83% |
| 10 | Rhode Island | 15.50% | 12.24% | 27.74% |
| 11 | North Dakota | 15.43% | 12.24% | 27.67% |
| 12 | Missouri | 15.04% | 12.24% | 27.28% |
| 13 | Florida | 15.02% | 12.24% | 27.26% |
| 14 | South Dakota | 14.51% | 12.24% | 26.75% |
| 15 | California | 14.42% | 12.24% | 26.67% |
| 16 | Alaska | 14.27% | 12.24% | 26.52% |
| 17 | Oklahoma | 13.86% | 12.24% | 26.10% |
| 18 | Puerto Rico | 13.77% | 12.24% | 26.02% |
| 19 | Tennessee | 13.70% | 12.24% | 25.94% |
| 20 | Colorado | 13.10% | 12.24% | 25.34% |
| 21 | South Carolina | 13.00% | 12.24% | 25.24% |
| 22 | Arizona | 12.66% | 12.24% | 24.90% |
| 23 | New Mexico | 12.32% | 12.24% | 24.57% |
| 24 | Georgia | 12.28% | 12.24% | 24.52% |
| 25 | District of Columbia | 12.13% | 12.24% | 24.37% |
| 26 | Texas | 11.89% | 12.24% | 24.14% |
| 27 | Indiana | 11.38% | 12.24% | 23.62% |
| 28 | Kentucky | 11.26% | 12.24% | 23.51% |
| 29 | Alabama | 11.20% | 12.24% | 23.45% |
| 30 | West Virginia | 10.74% | 12.24% | 22.99% |
| 31 | Massachusetts | 10.45% | 12.24% | 22.69% |
| 32 | Minnesota | 10.36% | 12.24% | 22.60% |
| 33 | Louisiana | 10.14% | 12.24% | 22.38% |
| 34 | Mississippi | 9.94% | 12.24% | 22.18% |
| 35 | Iowa | 9.88% | 12.24% | 22.12% |
| 36 | Michigan | 9.81% | 12.24% | 22.05% |
| 37 | Wyoming | 9.41% | 12.24% | 21.65% |
| 38 | New Jersey | 9.14% | 12.24% | 21.39% |
| 39 | New Hampshire | 9.10% | 12.24% | 21.34% |
| 40 | Maine | 9.08% | 12.24% | 21.32% |
| 41 | North Carolina | 9.04% | 12.24% | 21.29% |
| 42 | Vermont | 8.90% | 12.24% | 21.14% |
| 43 | Ohio | 8.56% | 12.24% | 20.80% |
| 44 | Connecticut | 8.31% | 12.24% | 20.55% |
| 45 | Hawaii | 7.89% | 12.24% | 20.13% |
| 46 | Wisconsin | 7.88% | 12.24% | 20.12% |
| 47 | Virginia | 7.63% | 12.24% | 19.87% |
| 48 | Oregon | 7.52% | 12.24% | 19.77% |
| 49 | Montana | 6.83% | 12.24% | 19.07% |
| 50 | Delaware | 6.73% | 12.24% | 18.98% |
| 51 | Nevada | 3.84% | 12.24% | 16.09% |
| 52 | Idaho | 2.80% | 12.24% | 15.04% |
| Weighted Avg. | 13.15% | 12.24% | 25.39% | |
| Simple Avg. | 12.09% | 12.24% | ||
|
Source: Methodology from COST, “50-State Study and Report on Telecommunications Taxation,” May 2005. Updated July 2022 using state statutes, FCC data, and local ordinances. |
||||
| State-Local Sales Tax | State-Local Wireless Tax | Wireless Over/Under Sales Tax | Disparity Multiple | |
|---|---|---|---|---|
| Illinois | 10.00% | 22.65% | 12.65% | 2.26 |
| Nebraska | 7.13% | 19.49% | 12.36% | 2.74 |
| Alaska | 2.50% | 14.27% | 11.77% | 5.71 |
| Washington | 9.83% | 20.65% | 10.82% | 2.10 |
| Arkansas | 9.19% | 19.99% | 10.80% | 2.17 |
| New York | 8.44% | 18.88% | 10.44% | 2.24 |
| Kansas | 8.33% | 18.04% | 9.71% | 2.17 |
| Pennsylvania | 7.00% | 16.62% | 9.62% | 2.37 |
| Maryland | 6.00% | 15.58% | 9.58% | 2.60 |
| New Hampshire | 0.00% | 9.10% | 9.10% | NA |
| Utah | 7.50% | 16.15% | 8.65% | 2.15 |
| Rhode Island | 7.00% | 15.50% | 8.50% | 2.21 |
| North Dakota | 7.25% | 15.43% | 8.18% | 2.13 |
| South Dakota | 6.50% | 14.51% | 8.01% | 2.23 |
| Oregon | 0.00% | 7.52% | 7.52% | NA |
| Florida | 7.50% | 15.02% | 7.52% | 2.00 |
| Montana | 0.00% | 6.83% | 6.83% | NA |
| Delaware | 0.00% | 6.73% | 6.73% | NA |
| Missouri | 8.54% | 15.04% | 6.50% | 1.76 |
| District of Columbia | 6.00% | 12.13% | 6.13% | 2.02 |
| California | 9.13% | 14.42% | 5.30% | 1.58 |
| Oklahoma | 8.58% | 13.86% | 5.28% | 1.62 |
| Kentucky | 6.00% | 11.26% | 5.26% | 1.88 |
| Colorado | 8.51% | 13.10% | 4.59% | 1.54 |
| South Carolina | 8.50% | 13.00% | 4.50% | 1.53 |
| Indiana | 7.00% | 11.38% | 4.38% | 1.63 |
| New Mexico | 8.03% | 12.32% | 4.29% | 1.53 |
| Massachusetts | 6.25% | 10.45% | 4.20% | 1.67 |
| Tennessee | 9.50% | 13.70% | 4.20% | 1.44 |
| Georgia | 8.25% | 12.28% | 4.03% | 1.49 |
| Arizona | 8.65% | 12.66% | 4.01% | 1.46 |
| Wyoming | 5.50% | 9.41% | 3.91% | 1.71 |
| Michigan | 6.00% | 9.81% | 3.81% | 1.63 |
| West Virginia | 7.00% | 10.74% | 3.74% | 1.53 |
| Texas | 8.25% | 11.89% | 3.64% | 1.44 |
| Maine | 5.50% | 9.08% | 3.58% | 1.65 |
| Hawaii | 4.50% | 7.89% | 3.39% | 1.75 |
| Iowa | 7.00% | 9.88% | 2.88% | 1.41 |
| New Jersey | 6.63% | 9.14% | 2.52% | 1.38 |
| Mississippi | 7.50% | 9.94% | 2.44% | 1.33 |
| Vermont | 6.50% | 8.90% | 2.40% | 1.37 |
| Minnesota | 7.96% | 10.36% | 2.40% | 1.30 |
| Wisconsin | 5.50% | 7.88% | 2.38% | 1.43 |
| Puerto Rico | 11.50% | 13.77% | 2.27% | 1.20 |
| Connecticut | 6.35% | 8.31% | 1.96% | 1.31 |
| North Carolina | 7.25% | 9.04% | 1.79% | 1.25 |
| Alabama | 9.63% | 11.20% | 1.58% | 1.16 |
| Virginia | 6.00% | 7.63% | 1.63% | 1.27 |
| Ohio | 7.75% | 8.56% | 0.81% | 1.10 |
| Louisiana | 9.70% | 10.14% | 0.44% | 1.05 |
| Idaho | 6.00% | 2.80% | -3.20% | 0.47 |
| Nevada | 8.33% | 3.84% | -4.49% | 0.46 |
| U.S. Weighted Average | 7.77% | 13.15% | 5.38% | 1.69 |
|
Methodology from COST, “50-State Study and Report on Telecommunications Taxation,” May 2005. Updated July 2022 using state statutes, FCC data, and local ordinances. |
||||
State Trends in Wireless Taxes
911 and 988 Fees
Most states impose per-line fees on telecommunications customers to fund capital and operating expenses for state and local emergency (911) systems. These fees vary significantly, from zero in Missouri to a high of $5.00 per line in Chicago.[5] In 2022, Connecticut was the only state to increase its 911 fee, from 68 cents per month to 70 cents per month per line. Colorado lowered its state 911 fee from 10 cents to 9 cents per month and Minnesota lowered its 911 fee from 95 cents to 80 cents per month.
In 2021 and 2022, a new fee began appearing on customer bills in three states. The FCC mandated that a new three-digit number (988) will be designated nationally to contact suicide prevention hotlines operated in the states. A law passed by Congress authorized states to impose “988 fees” to pay for some of the creation and operation of 988 crisis hotline centers. In 2021, Virginia was the first state to impose a new 988 fee, which is 12 cents per line per month. Colorado (18 cents per month) and Washington (24 cents per month) added new 988 fees in 2022.
State Universal Service Funds
Twenty-two states impose their own “universal service fund” (USF) charges on wireless service that provide subsidies for many of the same purposes as the FUSF. Under federal law, the federal government imposes a charge as a percentage of interstate revenues and states may impose a surcharge as a percentage of intrastate revenues. Recently, however, some states have shifted to a per-line USF imposition, resulting in a large portion of the state USF burden being borne by wireless family share plans.
As detailed in Appendix Table B1, the highest per-line charge is currently in Nebraska at $1.75 per line. A family with a share plan with four lines pays $7.00 per month ($84 per year) even if they have the lowest-price wireless plan. Oklahoma became the latest state to impose a per-line USF charge, setting the charge at $1.14 per line in 2022. Other per-line state USF impositions are in New Mexico, Maine, Utah, Kentucky, and Maryland.
The remaining states continue to impose their USF charges on a percentage basis. The highest rate is in Kansas at 7.2 percent, followed closely by Arkansas (7.1 percent) and Alaska (6.3 percent). The Texas Public Utility Commission recently approved a massive increase in the rate of the Texas USF from about 2.1 percent to 15 percent. While this increase happened after the July 1 cutoff for this report, if this action is not reversed, wireless consumers will pay the highest wireless taxes in the country. Other states that increased their USF surcharges include California, Indiana, Kansas, Nevada, South Carolina, Wisconsin, and Wyoming. New Mexico reduced its USF surcharge rate and Michigan allowed its intrastate toll assessment to expire.
State Wireless Taxes
In addition to 911 fees, 988 fees, and state USF charges, 14 states impose wireless taxes that are either on top of sales taxes or in lieu of sales taxes but at a higher rate than the sales tax. Table 4 shows these states by type of wireless tax. Indiana repealed the 1.4 percent utility gross receipts tax that applied to wireless and other telecommunications services. Indiana is the first state to eliminate a discriminatory wireless tax since Virginia reformed its communications taxes in 2004.
| State Gross Receipts Tax in Addition to Sales Tax | Higher State Tax Rate in Lieu of Sales Tax | Wireless Tax but No State Sales Tax |
|---|---|---|
| Kentucky | District of Columbia | Delaware |
| New York | Florida | Montana |
| North Dakota | Illinois | New Hampshire |
| Pennsylvania | Maine | |
| Rhode Island | ||
| South Dakota | ||
|
Source: State statutes. |
||
Local Wireless Taxes
Local governments throughout the country also impose taxes on wireless service that are not imposed on other goods and services. Many are the result of legacy taxes that were established during the regulated telephone monopoly era that existed prior to the 1980s breakup of AT&T. Local governments in some states have longstanding authority to impose right-of-way (ROW) fees on telephone companies for placing poles, wires, and equipment on local property. In other states, localities impose franchise or license taxes on telephone companies in exchange for the privilege of doing business in a city.
In the late 1990s and early 2000s, when wireless service began to compete with wireline service, localities became concerned about losing revenues from local taxes on wireline telephone companies and sought to extend these taxes to wireless service. This occurred in some states even though wireless providers typically did not use the public right-of-way to place equipment or, when they did use public property (e.g., the top of buildings), the usage was de minimis and paid for through negotiated rental agreements. This response to changing consumer behavior also occurs in local taxation of streaming services and cable companies, where localities are fighting to retain revenue by taxing streaming services as if they were using ROW like cable companies.[6]
Local governments in 14 states currently impose some type of tax on wireless service in addition to local option sales taxes. In most of those states, the taxes are additive and only further increase the tax burden on wireless service. California and Illinois are the exceptions; in those states, wireless service is subject to taxes in lieu of the sales tax. But in most cases, the wireless tax is higher than the sales tax. Table 5 depicts the types of local wireless taxes that apply. Local taxes have a significant impact on the overall wireless service tax burden in several of the states with the highest wireless taxes, including Illinois, Washington, Nebraska, New York, Utah, and Maryland.
| Privilege, License or User Taxes | State-Authorized Telecom Taxes | School District and Other Special District Taxes |
|---|---|---|
| Arizona | Florida | Kentucky |
| California | Illinois | New York |
| Maryland | Maryland | |
| Missouri | New York | |
| Nebraska | Utah | |
| Nevada | ||
| South Carolina | ||
| Washington | ||
|
Note: Excludes local general sales taxes. Source: State statutes. |
||
California has the highest local taxes, with rates up to 11 percent. Washington follows closely with local taxes as high as 9 percent, followed by Illinois (up to 7 percent), Florida (up to 7 percent), and Nebraska (up to 6.25 percent). In addition to these percentage-based taxes, Illinois allows local per-line taxes of $5.00 per line in Chicago, and Maryland allows Baltimore to charge $4.00 per line.
The Regressive Impact of Wireless Taxes
Economists use the term “regressive” to describe tax systems that impose higher tax burdens on low-income taxpayers than on high-income taxpayers, measured as a percentage of income. Because low-income households pay a greater percentage of their budgets on wireless service taxes than high-income households, wireless service taxes are regressive.
The trend of increasing per-line impositions—for 911 fees, state USF surcharges, per-line general wireless taxes, and 988 fees—makes wireless taxes even more regressive. While regressivity is not in itself justification for abandoning wireless taxes (most consumption taxes are regressive), lawmakers should be cautious when increasing regressive tax burdens, particularly in the case of a targeted excise taxAn excise tax is a tax imposed on a specific good or activity. Excise taxes are commonly levied on cigarettes, alcoholic beverages, soda, gasoline, insurance premiums, amusement activities, and betting, and typically make up a relatively small and volatile portion of state and local and, to a lesser extent, federal tax collections. that does not meaningfully internalize any external harms and often far exceeds any amount necessary to pay for related government programs.
Excessive taxes and fees increase the cost of wireless service at a time when citizens are relying on wireless service more than ever for access to government services (including education), health care, remote work, and commerce. In fact, wireless service is becoming the sole means of communication and connectivity for many Americans, especially those struggling with poverty. More than 76 percent of all low-income adults and 68 percent of all adults have wireless-only service.
Table 6 shows the impact of these high local taxes on wireless consumers in selected cities. In Chicago, a family of four paying $100 per month for taxable wireless service would pay about $34 per month (over $400 per year) in state and local taxes on wireless services. That same family in Baltimore would pay almost $340 in state and local wireless taxes annually.
| City | Tax on 4-line Voice Plan Costing $100 per Month | Effective Tax Rate |
|---|---|---|
| Chicago, IL | $34.08 | 34.08% |
| Baltimore, MD | $28.20 | 28.20% |
| Omaha, NE | $22.17 | 22.17% |
| Little Rock, AR | $21.03 | 21.03% |
| Seattle, WA | $21.01 | 21.01% |
| New York, NY | $20.47 | 20.47% |
| Philadelphia, PA | $19.60 | 19.60% |
| Salt Lake City, UT | $18.53 | 18.53% |
| Providence, RI | $17.00 | 17.00% |
| Tallahassee, FL | $15.94 | 15.94% |
| City | Tax on Single Line Voice Plan Costing $35.74 per Month | Effective Tax Rate |
| Chicago, IL | $10.00 | 27.99% |
| Baltimore, MD | $7.69 | 21.53% |
| Seattle, WA | $7.00 | 19.58% |
| Omaha, NE | $6.97 | 19.49% |
| Little Rock, AR | $6.94 | 19.43% |
| New York, NY | $6.67 | 18.67% |
| Philadelphia, PA | $6.30 | 17.62% |
| Salt Lake City, UT | $5.86 | 16.40% |
| Providence, RI | $5.54 | 15.50% |
| Tallahassee, FL | $5.53 | 15.46% |
|
Source: Author’s calculations, using state statutes and local ordinances. |
||
Alternative Tax Comparisons
Wireless service provided to consumers has changed dramatically since this report was first published in 2003. When we first wrote the report, all components of a consumer’s typical wireless bill were subject to tax, including voice service, text messaging, data usage, and related ancillary services in most states. Today, however, most wireless plans include both taxable wireless services as well as non-taxable data plans used to access the internet.
This section of the report presents alternative measures of the tax burden on wireless consumers that account for the non-taxable internet access included in wireless plans. The average monthly revenue per wireless line is $35.74 per month. Of this amount, about 52 percent of the typical bill is non-taxable internet access ($18.66 per month) and the remainder is taxable wireless service ($17.08 per month), according to Census Bureau data.[7]
The first column in Table 7 ranks the states based on the total amount of state and local tax paid on a typical consumer’s bill. By this measure, Illinois still has the highest wireless tax burden in the country, with the typical consumer paying about $5.66 in state and local taxes per month. Column two shows the effective state and local tax rate as a percentage of the price paid for the taxable wireless service. Once again, Illinois has the highest tax burden with the typical consumer paying almost one-third of the taxable portion in state and local taxes. The third column shows the effective state and local tax rate as a share of the entire bill, which includes both taxable and non-taxable services. Even including the non-taxable portion in the calculation, the effective state and local tax rate is nearly 16 percent in Illinois. Finally, column four shows the effective state and local tax rate using the Committee on State Taxation (COST) methodology traditionally used in this report.
Taken together, the typical bundled plan, with taxable voice services and an untaxed data component, is taxed at an average rate of 12.1 percent. Even with over half of the bill legally untaxable, the bundled plan is taxed at an effective rate that is twice the average state sales tax rate.
The declining portion of taxable services may explain why more states have begun to rely more heavily on per-line taxes, fees, and government surcharges. For example, while most states have always imposed per-line 911 fees, more states are shifting their state USF impositions from a percentage of intrastate revenue to a flat per-line amount. Nebraska, New Mexico, Oklahoma, and Utah have all recently made this change and other states are considering it as well.
Under the alternative comparisons in Table 7, states that disproportionately rely on per-line taxes—such as Illinois, Maryland, and West Virginia—have higher overall tax rankings than states that rely predominately on percentage-based taxes—like California and Florida. By their very nature, per-line taxes are regressive and tend to burden lower-income wireless users more heavily than percentage-based taxes. They also burden families because most wireless providers charge less per line for each additional line added to a family plan. While family and lower-income wireless users bear a higher burden, consumers of higher-priced plans, generally business consumers, pay comparatively less on a percentage basis because the per-line taxes represent a lower relative cost to the price of their wireless plans.
| Rank | State | Monthly Estimated State-Local Tax/Fee Paid | Monthly Estimated Tax Paid as % of Taxable Service | Monthly Estimated Tax Paid as % of Voice/Internet Bundle | Current Report Methodology: Adjusted State-Local Statutory Tee/Fee Rate |
|---|---|---|---|---|---|
| 1 | .Illinois | $5.58 | 32.65% | 15.60% | 22.65% |
| 2 | Nebraska | $4.49 | 26.31% | 12.57% | 19.49% |
| 3 | Maryland | $4.45 | 26.08% | 12.46% | 15.58% |
| 4 | New York | $4.24 | 24.83% | 11.86% | 18.88% |
| 5 | Washington | $4.15 | 24.29% | 11.61% | 20.65% |
| 6 | Arkansas | $4.11 | 24.05% | 11.49% | 19.99% |
| 7 | West Virginia | $3.84 | 22.48% | 10.74% | 10.74% |
| 8 | Pennsylvania | $3.70 | 21.66% | 10.35% | 16.62% |
| 9 | Utah | $3.70 | 21.66% | 10.35% | 16.15% |
| 10 | North Dakota | $3.70 | 21.64% | 10.34% | 15.43% |
| 11 | Kansas | $3.55 | 20.79% | 9.94% | 18.04% |
| 12 | Alaska | $3.46 | 20.27% | 9.68% | 14.27% |
| 13 | Oklahoma | $3.35 | 19.64% | 9.38% | 13.86% |
| 14 | Rhode Island | $3.30 | 19.32% | 9.23% | 15.50% |
| 15 | South Dakota | $3.21 | 18.79% | 8.98% | 14.51% |
| 16 | Tennessee | $3.12 | 18.28% | 8.74% | 13.70% |
| 17 | Colorado | $3.07 | 18.00% | 8.60% | 13.10% |
| 18 | New Mexico | $3.00 | 17.55% | 8.39% | 12.32% |
| 19 | Louisiana | $2.98 | 17.44% | 8.34% | 10.00% |
| 20 | Alabama | $2.88 | 16.89% | 8.07% | 11.20% |
| 21 | Georgia | $2.88 | 16.86% | 8.06% | 12.28% |
| 22 | Florida | $2.77 | 16.24% | 7.76% | 15.02% |
| 23 | California | $2.62 | 15.34% | 7.33% | 14.42% |
| 24 | Puerto Rico | $2.61 | 15.30% | 7.31% | 13.77% |
| 25 | Missouri | $2.57 | 15.04% | 7.19% | 15.04% |
| 26 | Massachusetts | $2.57 | 15.03% | 7.18% | 10.45% |
| 27 | South Carolina | $2.56 | 14.99% | 7.16% | 13.00% |
| 28 | Indiana | $2.48 | 14.53% | 6.94% | 11.38% |
| 29 | District of Columbia | $2.47 | 14.45% | 6.91% | 12.13% |
| 30 | Michigan | $2.38 | 13.96% | 6.67% | 9.81% |
| 31 | Kentucky | $2.38 | 13.95% | 6.67% | 11.26% |
| 32 | Texas | $2.32 | 13.60% | 6.50% | 11.89% |
| 33 | Arizona | $2.27 | 13.27% | 6.34% | 12.66% |
| 34 | Mississippi | $2.25 | 13.15% | 6.28% | 9.94% |
| 35 | Iowa | $2.23 | 13.03% | 6.23% | 9.88% |
| 36 | Minnesota | $2.22 | 12.99% | 6.21% | 10.36% |
| 37 | Maine | $2.12 | 12.44% | 5.95% | 9.08% |
| 38 | New Jersey | $2.03 | 11.89% | 5.68% | 9.14% |
| 39 | Wyoming | $2.02 | 11.82% | 5.65% | 9.41% |
| 40 | Oregon | $1.98 | 11.62% | 5.55% | 7.52% |
| 41 | New Hampshire | $1.95 | 11.39% | 5.44% | 9.10% |
| 42 | North Carolina | $1.93 | 11.27% | 5.39% | 9.04% |
| 43 | Virginia | $1.79 | 10.50% | 5.02% | 7.29% |
| 44 | Connecticut | $1.78 | 10.45% | 4.99% | 8.31% |
| 45 | Montana | $1.74 | 10.19% | 4.87% | 6.83% |
| 46 | Wisconsin | $1.74 | 10.17% | 4.86% | 7.88% |
| 47 | Hawaii | $1.69 | 9.91% | 4.73% | 7.89% |
| 48 | Ohio | $1.59 | 9.32% | 4.46% | 8.56% |
| 49 | Vermont | $1.52 | 8.90% | 4.25% | 8.90% |
| 50 | Delaware | $1.47 | 8.63% | 4.12% | 6.73% |
| 51 | Nevada | $1.31 | 7.65% | 3.65% | 3.84% |
| 52 | Idaho | $1.00 | 5.85% | 2.80% | 2.80% |
| Average Monthly Revenue Estimates Used in Calculations | |||||
| Dollars ($) | Percent | ||||
| Monthly Service Revenue (taxable & non-taxable) | $35.74 | 100% | |||
| Monthly Wireless Telecom Revenue (taxable)* | $17.08 | 47.79% | |||
| Monthly Internet Access Revenue (not taxable)* | $18.66 | 52.21% | |||
| Source: CTIA estimated wireless monthly service revenues; Internet Access service percentage of wireless service revenues from US Census Bureau survey, see https://www.census.gov/services/qss/qss-current.pdf Excludes equipment sales and repair revenues. | |||||
The Economic Impact of Excessive Wireless Taxes
Policymakers should be cautious about expanding wireless taxes, fees, and government surcharges for two primary reasons. First, as discussed above, wireless taxes are regressive and have a disproportionate impact on low-income consumers. Excessive taxes and fees increase the cost of access to wireless service for low-income consumers.
Second, discriminatory taxes may slow investment in wireless infrastructure. Ample evidence suggests that investments in wireless networks provide economic benefits to the broader economy because so many sectors—transportation, health care, energy, education, and even government—use wireless networks to boost productivity and efficiency. These economic benefits proved especially important during the COVID-19 pandemic because wireless networks helped employees work remotely and allowed students to continue their studies.
Network investment is important not only to consumers and businesses that use these wireless networks but also to the entire American economy. A report by the International Chamber of Commerce (ICC) surveyed the evidence from the United States and Europe as well as from the developing world. They consistently found that wireless infrastructure investment enables an entire entrepreneurial culture to focus on creating applications and devices to make businesses more productive and improve consumers’ lives. These tools in turn make businesses more successful and able to create new jobs that generate economic activity and tax revenues for governments.
The International Chamber of Commerce notes, “Remedying the discriminatory tax treatment of telecom goods and services may reduce tax receipts in the short-term, but the longer-term increase in the use of advanced capability devices, service demand, and network deployment resulting from these tax reductions is likely to counteract this loss of revenue over time.” [8] Policymakers need to weigh the trade-offs between the short-term revenue benefits of excessive wireless taxes and the long-term economic impact on the state from reduced infrastructure investment.
Applying the sales tax, a traditional broad-based consumption taxA consumption tax is typically levied on the purchase of goods or services and is paid directly or indirectly by the consumer in the form of retail sales taxes, excise taxes, tariffs, value-added taxes (VAT), or income taxes where all savings are tax-deductible., is perfectly appropriate. But excessive, targeted taxation of wireless services lacks the traditional justifications—a “user-pays” system or the internalization of social costs—for excise taxation, raising consumer costs and undercutting investment in a vital market.
Conclusion
High taxes, fees, and government surcharges in many states and localities throughout the country continue to burden wireless consumers. About half of the $11.2 billion in state and local taxes imposed on wireless service are discriminatory in nature, as they only apply to telecommunications services. These taxes disproportionately burden low-income Americans and disincentivize investment in new wireless services.
To alleviate the regressive impact on wireless consumers, states should consider policies that transition their tax systems away from narrowly-based wireless taxes and toward broad-based tax sources that do not distort the economy and do not slow investment in critical infrastructure like wireless broadband.
Stay informed on the tax policies impacting you.
Subscribe to our free newsletter to get the latest tax data, news and analysis.
SubscribeAppendix A: Methodology
The methodology used in this report to calculate wireless taxes compares the applicable federal, state, and local rates on wireless voice service in the capital city and the most populated city in each state. This methodology was developed by the Committee on State Taxation (COST) in its landmark “50-State Study and Report on Telecommunications Taxation,” first published in 2000.
The use of a consistent methodology allows for accurate time-series comparisons across states and over time. However, changes in consumer demand for wireless services pose challenges when measuring the impact of wireless taxes on consumer bills. Three trends in the industry are significantly impacting the amount of taxes that wireless consumers pay on their monthly bills.
First, a growing share of wireless consumer purchases is for internet access. U.S. Census Bureau data from 2019 suggests that about 52.2 percent of total wireless service revenues (which excludes sales and rental of equipment and other non-service operating revenue) for the industry are from the sale of internet access.[9] This percentage will continue to grow as wireless consumers utilize more internet access and less voice telephone service each year.
Under federal law, as of July 1, 2020, all states are precluded from imposing taxes on internet access. This suggests that of the “typical” consumer’s monthly expenditure of $35.74 per month, approximately $18.66 is for non-taxable internet access and $17.08 is for taxable wireless service. A consumer applying the tax rates in this report to their total bill will find that the effective tax rate overstates their actual tax paid if their calling plan includes both taxable voice service and exempt internet access.
Second, the report’s methodology understates the tax rate impact of flat rate taxes and fees—those that are imposed as a set dollar amount per line. Under the report’s methodology, a $1.00 per month per line tax is converted to a percentage amount by dividing $1.00 by the $35.74 average monthly bill, resulting in a tax rate of 2.8 percent in this example. However, these flat rate taxes and fees are only permitted to be imposed on the portion of the wireless bill that is not internet access. In this same example, if the $1.00 per month were divided by the taxable portion of the bill ($17.08), the tax rate would be 5.9 percent.
Third, the methodology for calculating the rate for the Federal Universal Service Fund charge relies on the use of the FCC 37.1 percent “safe harbor” for determining the share of a bundled service plan that represents Interstate telecommunications service. Telecommunications providers have the option of either using the safe harbor percentage or a “traffic study” to determine the actual percentage of interstate revenues.
Since the traffic study typically results in a lower share of Interstate revenues than the safe harbor percentage, wireless carriers use their own traffic studies which result in a lower effective rate for the FUSF than the rate calculated in this report. The report therefore overstates somewhat the rate of the FUSF. The report also understates the rate of the state USF impositions since carriers must rely on the same traffic studies to calculate the intrastate portion of their revenues because a traffic study that reduces assessable interstate revenues will increase assessable intrastate revenues. For a more detailed discussion, please see Appendix B.
Due to the changes in product offerings and consumer behavior, we have included a section in this year’s report that provides alternative comparison methodologies that allow readers to understand the impact of the internet access exemption on the effective rates paid by wireless consumers. This section is also helpful when considering why lawmakers have routinely increased rates on the taxable share of wireless services.
However, despite these changing behaviors and services, the authors have determined that there are benefits to also retaining the current methodology, providing a consistent measurement of trends in tax rates over time by continuing to calculate the effective tax rate for the taxable voice and text share of consumers’ wireless bills as well.
Appendix B: What Are Universal Service Funds?
The Federal Universal Service Fund
The Federal Universal Service Fund (FUSF) is administered by the FCC under open-ended authority from Congress. The program subsidizes telecommunications services for schools, libraries, hospitals, low-income people, and rural telephone companies operating in high-cost areas. The FCC has also recently decided to use funds to subsidize broadband deployment.
The FCC has the authority to set spending for these programs outside of the normal congressional appropriations process. After deciding what to spend on the various programs, the FCC sets the quarterly “contribution factor” or surcharge rate that telecommunications providers must remit to the FUSF to generate sufficient revenues to fund the expenditure commitments. Providers may elect to surcharge these “contributions” on their customer bills.
FUSF surcharges apply only to revenues from interstate telecommunications services. They currently do not apply to internet access services, information services, and intrastate telecommunications services.
Wireless carriers generally sell plans that include either unlimited voice minutes or a fixed number of voice minutes for a set amount. Since these plans include both interstate calls (subject to the FUSF) and intrastate calls (not subject to FUSF), the FCC allows providers to allocate the fixed monthly plans to interstate and intrastate calls by one of two methods. Carriers may use “traffic studies” to show the actual split between interstate and intrastate calls for all subscribers and apply the FUSF to the aggregated interstate portion of subscriber calls.
Alternatively, carriers may use a single uniform national “safe harbor” percentage to their fixed monthly plans. The FCC currently sets this safe harbor at 37.1 percent of the fixed monthly charge. For example, when determining the FUSF, a $50 monthly wireless voice calling plan is deemed to include $18.55 in interstate calls and $31.45 in intrastate calls. If a carrier elects to use the safe harbor, the FUSF rate would be applied to $18.55 of the bill each month.
The FUSF rate is set by the FCC each quarter. For the period beginning July 1, 2022, the rate is 33.0 percent. Thus, the FUSF rate applied on assessable wireless revenues using the FCC safe harbor amount is 12.2 percent (33.0 percent times 37.1 percent).[10] Figure B1 highlights the significant growth in the FCC contribution rate since 2003.
Despite the FUSF rate, Congress has shown little interest in restricting or otherwise limiting the growth of the programs funded through the FSUF or changing the methodology used to fund the FUSF programs.
State Universal Service Funds
States also have the authority to supplement the programs funded through the FUSF with their own programs funded through state universal service funds. The state programs are funded by surcharges applied to the intrastate portion of telephone charges. In this report, the inverse of the FUSF safe harbor is used to calculate the rates of the state USF in all states except Vermont, which imposes its state USF on both interstate and intrastate charges. As in the previous example, if a consumer has a $50 monthly wireless voice plan, 62.9 percent of that charge ($31.45) is deemed to be an intrastate service subject to the state USF charge and $18.55 is an interstate service not subject to state USF charges.
Like the FUSF, state universal service fund charges do not apply to internet access. State USF charges are a key factor in the high wireless tax burden in states like Arkansas, Alaska, Kansas, and California.
| State | Effective Rate | Calculation |
|---|---|---|
| Kansas | 7.20% | 11.44% times FCC safe harbor |
| Arkansas | 7.08% | 11.25% times FCC safe harbor |
| Alaska | 6.29% | 10.0% times FCC Intrastate safe harbor |
| California | 5.26% | 8.36% times FCC Intrastate safe harbor |
| Nebraska | 4.90% | $1.75 per line per month |
| Oregon | 3.77% | 6% times FCC safe harbor |
| Louisiana | 3.61% | Carrier rates assigned by Public Service Commission |
| Oklahoma | 3.19% | $1.14 per line per month |
| New Mexico | 2.66% | $0.95 per line per month |
| Vermont | 2.40% | Funds 911 and other programs |
| Texas | 2.08% | 3.3% times FCC safe harbor |
| Wyoming | 1.70% | 2.7% times FCC safe harbor |
| South Carolina | 1.68% | 2.67% times FCC safe harbor |
| Colorado | 1.64% | 2.6% times FCC safe harbor |
| Indiana | 1.42% | 2.3% times FCC safe harbor |
| Maine | 1.23% | $0.44 per line |
| Utah | 1.01% | $0.36 per line per month |
| Puerto Rico | 0.87% | 1.39% times FCC safe harbor |
| Kentucky | 0.42% | $.15 per month |
| Nevada | 0.36% | 0.57% times FCC Safe Harbor |
| Wisconsin | 0.28% | 0.449% times FCC safe harbor |
| Maryland | 0.14% | $0.05 per month per line |
|
Source: Author’s calculation from state statutes and state utility commissions. |
||
Appendix C
| State | Type of Tax | Rate | Comments |
|---|---|---|---|
| Alabama | |||
| AL Cell Service Tax | 6.00% | Access, interstate and intrastate | |
| E911 | 5.20% | $1.86 per month | |
| Total Transaction Tax | 11.20% | ||
| Alaska | |||
| Local Sales Tax | 2.50% | Avg. of Juneau (5%) & Anchorage (0%) | |
| Local E911 | 5.46% | Anchorage – $2.00; Juneau – $1.90 | |
| State USF | 6.29% | 10.0% times FCC safe harbor | |
| TRS | 0.03% | $0.01 per line | |
| Total Transaction Tax | 14.27% | ||
| Arizona | |||
| State sales (transaction priv.) | 5.60% | Intrastate telecommunications service | |
| County sales (transaction priv.) | 0.60% | Phoenix (Maricopa) = 0.7%; Tucson (Pima) = 0.5% | |
| City telecommunications | 5.90% | Avg. Phoenix (4.7%) & Tucson (7.1%) | |
| 911 | 0.56% | $.20 per month | |
| Total Transaction Tax | 12.66% | ||
| Arkansas | |||
| State sales tax | 6.50% | ||
| Local sales taxes | 2.69% | Avg. Little Rock (2.125%) & Fayetteville (3.25%) | |
| State High Cost Fund | 7.08% | 11.25% times FCC safe harbor | |
| Wireless 911 | 3.64% | $1.30 / month statewide. | |
| TRS service & TRS equipment | 0.08% | $.03 per line per month | |
| Total Transaction Tax | 19.99% | ||
| California | |||
| Local Utility User Tax | 8.00% | Avg. of LA (9%) and Sacramento (7%) | |
| State 911 | 0.84% | 30 cents per line per month | |
| PUC fee | 0.33% | 0.52% times FCC safe harbor | |
| ULTS (lifeline) | 2.99% | 4.75% times FCC safe harbor | |
| Deaf/CRS | 0.70% | 1.11% times FCC safe harbor | |
| High Cost Funds A & B | 0.44% | 0.7% times FCC safe harbor | |
| Teleconnect Fund | 0.49% | 0.78% times FCC safe harbor | |
| CASF – advanced services fund | 0.64% | 1.02% times FCC safe harbor | |
| Total Transaction Tax | 14.42% | ||
| Colorado | |||
| State Sales Tax | 2.90% | access and intrastate | |
| Local Sales Tax — City/County | 4.07% | Avg. of Denver (5.91%) & Colorado Springs (2.23%) | |
| State 911 | 0.25% | $.09 per line per month | |
| County 911 | 3.57% | Denver ($1.20) / Colorado Springs ($1.35) | |
| USF | 1.64% | 2.6% times FCC safe harbor | |
| TDD Tax | 0.17% | $0.06 per month | |
| State 988 fee | 0.50% | $0.18 per month | |
| Total Transaction Tax | 13.10% | ||
| Connecticut | |||
| State sales tax | 6.35% | Access, interstate and intrastate | |
| 911 | 1.96% | $.70 per line | |
| Total Transaction Tax | 8.31% | ||
| Delaware | |||
| Public Utility Gross Receipts Tax | 5.00% | Access and intrastate | |
| Local 911 tax | 1.68% | $.60 / month | |
| TRS fee | 0.06% | $.02 per line per month | |
| Total Transaction Tax | 6.73% | ||
| District of Columbia | |||
| Telecommunication Privilege Tax | 10.00% | Monthly gross charge; | |
| 911 | 2.13% | $0.76 per month | |
| Total Transaction Tax | 12.13% | ||
| Florida | |||
| State Communications services | 7.44% | Access, interstate and intrastate | |
| Local Communications services | 6.46% | Jacksonville 6.02%; Tallahassee 6.9% | |
| 911 | 1.12% | $.40/month statewide | |
| Total Transaction Tax | 15.02% | ||
| Georgia | |||
| State sales tax | 3.92% | 4% of “access charge” — assume $35 | |
| Local sales tax | 4.16% | Avg. rate Atlanta (4.5%) & Augusta (4%) | |
| Local 911 | 4.20% | $1.50 per line statewide | |
| Total Transaction Tax | 12.28% | ||
| Hawaii | |||
| Public service company tax | 4.00% | ||
| Additional county tax | 1.89% | ||
| PUC Fee | 0.16% | 0.25% of intrastate receipts | |
| Wireless 911 fee | 1.85% | $.66 per month | |
| Total Transaction Tax | 7.89% | ||
| Idaho | |||
| Telephone service assistance program | 0.00% | Set annually by PUC — currently zero | |
| Statewide wireless 911 | 2.80% | Ada County (Boise) = $1.00 per month | |
| Total Transaction Tax | 2.80% | ||
| Illinois | |||
| State telecom excise tax | 7.00% | Access, interstate and intrastate | |
| Simplified municipal tax | 6.50% | Avg. of Chicago (7%) & Springfield (6%) | |
| Wireless 911 | 9.09% | Chicago $5/mo.; others $1.50/mo | |
| TRS fee | 0.06% | $.02 per line per month | |
| Total Transaction Tax | 22.65% | ||
| Indiana | |||
| State sales tax | 7.00% | Access and intrastate | |
| Utility receipts tax | 0.00% | Repealed effective 7/1/2022 | |
| Wireless 911 | 2.80% | $1.00 per month | |
| State USF | 1.42% | 2.3% times FCC safe harbor | |
| PUC fee | 0.07% | 0.12% times FCC safe harbor | |
| TRS fee | 0.08% | $.03 per line per month | |
| Total Transaction Tax | 11.38% | ||
| Iowa | |||
| State sales tax | 6.00% | ||
| Local option sales taxes | 1.00% | Avg. of Cedar Rapids (1%) & Des Moines (1%) | |
| Wireless 911 | 2.80% | $1.00 per month | |
| Dual Party Relay Service fee | 0.08% | $0.03 per month | |
| Total Transaction Tax | 9.88% | ||
| Kansas | |||
| State sales tax | 6.50% | Intrastate & interstate | |
| Local option sales taxes | 1.83% | Avg. of Wichita (1.0%) & Topeka (2.65%) | |
| USF | 7.20% | 11.44% times FCC safe harbor | |
| Wireless 911 | 2.52% | $.90 per month per line | |
| Total Transaction Tax | 18.04% | ||
| Kentucky | |||
| State sales tax | 6.00% | Access, interstate and intrastate | |
| School utility gross receipts | 1.50% | Avg Frankfort (3%) and Lousiville (0%) | |
| Kentucky USF | 0.42% | $.15 per month | |
| Kentucky TAP & TRS | 0.08% | TAP: $0.02 and TRS: $0.01 | |
| Wireless 911 | 1.96% | $.70 / month | |
| Communications gross receipts tax | 1.30% | Access, interstate and intrastate | |
| Total Transaction Tax | 11.26% | ||
| Louisiana | |||
| State sales tax | 3.45% | Intrastate rate | |
| Wireless 911 | 2.94% | New Orleans $1.25/mo.; Baton Rouge $.85/mo. | |
| State USF | 3.61% | May vary by carrier | |
| TRS fee | 0.14% | $.05 per line per month | |
| Total Transaction Tax | 10.00% | ||
| Maine | |||
| State service provider tax | 6.00% | ||
| 911 fee | 0.98% | $.35 per month | |
| Maine USF | 1.23% | $0.44 per line | |
| MTEAF | 0.59% | $0.21 per line per month | |
| 0.28% | $.10 per line per month | ||
| Total Transaction Tax | 9.08% | ||
| Maryland | |||
| State sales tax | 6.00% | ||
| Local telecom excise | 5.60% | $4.00 per month in Baltimore; no tax in Annapolis | |
| State 911 | 1.40% | $.50 per month per line | |
| County 911 | 2.45% | Baltimore $1.00; Anne Arundel $.75 | |
| State USF | 0.14% | $0.05 per account | |
| Total Transaction Tax | 15.58% | ||
| Massachusetts | |||
| State sales tax | 6.25% | Interstate and intrastate | |
| Wireless 911 | 4.20% | $1.50 per month | |
| Total Transaction Tax | 10.45% | ||
| Michigan | |||
| State sales tax | 6.00% | Interstate and intrastate | |
| State wireless 911 | 0.70% | $.25 per month | |
| County wireless 911 | 3.11% | Detroit $.42; Lansing $1.80 | |
| Intrastate toll assessment | 0.00% | Assessment expired May 2022 | |
| Total Transaction Tax | 9.81% | ||
| Minnesota | |||
| State sales tax | 6.88% | Interstate and intrastate | |
| Local sales tax | 1.08% | Minneapolis (1.15%) and St. Paul (1.0%) | |
| 911 | 2.24% | $.80 per month | |
| Telecom access MN fund | 0.17% | $.06 per line per month | |
| Total Transaction Tax | 10.36% | ||
| Mississippi | |||
| State sales tax | 7.00% | Access, interstate and intrastate | |
| Wireless 911 & 911 training fee | 2.94% | $1.05 per month per line | |
| Total Transaction Tax | 9.94% | ||
| Missouri | |||
| State sales tax | 4.23% | Access and intrastate | |
| Local sales taxes | 4.31% | Avg. Jefferson City (3.75%) & Kansas City (4.875%) | |
| Local business license tax | 6.50% | Jefferson City (7%); Kansas City (6% residential) | |
| Total Transaction Tax | 15.04% | ||
| Montana | |||
| Telecom excise tax | 3.75% | Access, interstate and intrastate | |
| 911 & E911 tax | 2.80% | $1.00 per number per month | |
| TDD tax | 0.28% | $.10 per number per month | |
| Total Transaction Tax | 6.83% | ||
| Nebraska | |||
| State sales tax | 5.50% | Access & intrastate | |
| Local sales tax | 1.63% | Lincoln (1.75%) and Omaha (1.5%) | |
| City business and occupation tax | 6.13% | Avg. of Omaha (6.25%) & Lincoln (6.0%) | |
| State USF | 4.90% | $1.75 per line per month | |
| Wireless 911 | 1.26% | $.45 per month | |
| TRS | 0.08% | $.03 per month | |
| Total Transaction Tax | 19.49% | ||
| Nevada | |||
| Local franchise / gross receipts | 2.10% | 5% of first $15 intrastate revenues | |
| Local 911 tax | 1.19% | Washoe County = $.85 / month; Clark County no tax | |
| State deaf relay charge | 0.20% | $.07 per access line | |
| Nevada USF | 0.36% | 0.57% times FCC Safe Harbor | |
| Total Transaction Tax | 3.84% | ||
| New Hampshire | |||
| Communication services tax | 7.00% | Access, interstate and intrastate | |
| 911 tax | 2.10% | $.75 per month | |
| Total Transaction Tax | 9.10% | ||
| New Jersey | |||
| State sales tax | 6.63% | ||
| Wireless 911 | 2.52% | $.90 per month | |
| Total Transaction Tax | 9.14% | ||
| New Mexico | |||
| State gross receipts (sales) tax | 5.00% | 5% intrastate; 4.25% interstate | |
| City and county gross receipts tax | 3.03% | Avg. Santa Fe (3.3125%) & Albuquerque (2.75%) | |
| Wireless 911 | 1.43% | $.51 per month | |
| TRS surcharge | 0.21% | 0.33% times FCC safe harbor | |
| State USF | 2.66% | $0.95 per line per month | |
| Total Transaction Tax | 12.32% | ||
| New York | |||
| State sales tax | 4.00% | Intrastate and monthly access | |
| Local sales taxes | 4.25% | NYC 4.5%; Albany 4% | |
| MCTD sales tax | 0.19% | NYC 0.375%; Albany 0% | |
| State excise tax (186e) | 2.90% | mobile telecom service — includes interstate | |
| MCTD excise/surcharge (186c) | 0.36% | NYC & surrounding counties – .72%; Albany 0% | |
| Local utility gross receipts tax | 1.49% | NYC — 84% of 2.35%; Albany 1% | |
| State wireless 911 | 3.36% | $1.20 per month | |
| Local wireless 911 | 0.84% | $.30 per month — NYC & most counties | |
| School district utility sales tax | 1.50% | Albany 3%; NYC no tax | |
| Total Transaction Tax | 18.88% | ||
| North Carolina | |||
| State and loccal sales tax | 7.00% | Statewide combined rate includes local rates | |
| Wireless 911 | 1.82% | $.65 per month | |
| TRS Charge | 0.22% | $.08 per month | |
| Total Transaction Tax | 9.04% | ||
| North Dakota | |||
| State sales tax | 5.00% | Access and intrastate | |
| Local sales taxes | 2.25% | Avg Fargo (2.5%) & Bismarck (2.0%) | |
| State gross receipts tax | 2.50% | interstate and intrastate | |
| Statewide Interoperable Radio Network Tax | 1.40% | $0.50 per line per month | |
| Local 911 tax | 4.20% | $1.50 Bismarck; $1.50 Fargo | |
| TRS | 0.08% | Up to $.11/mo — currently $.03 | |
| Total Transaction Tax | 15.43% | ||
| Ohio | |||
| State sales tax | 5.75% | Access, interstate and intrastate | |
| Local sales taxes | 2.00% | Columbus (1.75%) and Cleveland (2.25%) | |
| Regulatory fee | 0.11% | 0.174% of intrastate revenues | |
| State/local wireless 911 | 0.70% | $.25 per month per phone number | |
| Total Transaction Tax | 8.56% | ||
| Oklahoma | |||
| State sales tax | 4.50% | Access, interstate and intrastate | |
| Local sales taxes | 4.07% | Avg. of OK City (4.125%) & Tulsa (4.017%) | |
| Local 911 | 2.10% | $.75 per month in OK City and Tulsa | |
| USF | 3.19% | $1.14 per line per month | |
| Total Transaction Tax | 13.86% | ||
| Oregon | |||
| Local utililty tax | 0.00% | No tax on wireless in Portland or Salem | |
| 911 tax | 3.50% | $1.25 per month | |
| RSPF Surcharge | 0.25% | $0.09 per month | |
| State USF | 3.77% | 6% times FCC safe harbor | |
| Total Transaction Tax | 7.52% | ||
| Pennsylvania | |||
| State sales tax | 6.00% | Access, interstate and intrastate | |
| State gross receipts tax | 5.00% | Access, interstate and intrastate | |
| Local sales tax | 1.00% | Philadephia 2%; Harrisburg 0% | |
| Statewide wireless 911 | 4.62% | $1.65 per month | |
| Total Transaction Tax | 16.62% | ||
| Puerto Rico | IVU (Sales Tax) | 11.50% | |
| 911 fee | 1.40% | $.50 per line per month for residential lines | |
| USF | 0.87% | 1.39% times FCC safe harbor | |
| Total Transaction Tax | 13.77% | ||
| Rhode Island | |||
| State sales tax | 7.00% | Access, interstate and intrastate | |
| Gross receipts tax | 5.00% | Access, interstate and intrastate | |
| 911 and first responder fee | 3.50% | $1.25 per month | |
| Total Transaction Tax | 15.50% | ||
| South Carolina | |||
| State sales tax | 6.00% | Access, interstate and intrastate | |
| Local sales tax | 2.50% | Avg. of Charleston (3%) and Columbia (2%) | |
| Municipal license tax | 1.00% | Charleston (1.0%) and Columbia (1.0%) | |
| Dual party relay charge | 0.08% | $.03 per line per month | |
| State USF | 1.68% | 2.67% times FCC safe harbor | |
| 911 tax | 1.73% | $.62 / month | |
| Total Transaction Tax | 13.00% | ||
| South Dakota | |||
| State sales tax | 4.50% | Access, interstate and intrastate | |
| State gross receipts tax | 4.00% | ||
| local option sales tax | 2.00% | Avg. of Pierre (2.0%) and Sioux Falls (2.0%) | |
| 911 excise | 3.50% | $1.25 per month | |
| TRS fee | 0.42% | $.15 per month by statute | |
| PUC fee | 0.09% | .15% of intrastate receipts | |
| Total Transaction Tax | 14.51% | ||
| Tennessee | |||
| State sales tax | 7.00% | Access, interstate and intrastate | |
| Local sales tax | 2.50% | Statewide local rate for intrastate | |
| 911 tax | 4.20% | $1.50 per month | |
| Total Transaction Tax | 13.70% | ||
| Texas | |||
| State sales tax | 6.25% | Access, interstate and intrastate | |
| Local sales tax | 2.00% | Austin (2.0%) & Houston (2.0%) | |
| Wireless 911 tax | 1.40% | $.50 per month per line | |
| Texas USF | 2.08% | 3.3% times FCC safe harbor | |
| 911 Equalization surcharge | 0.17% | $.06 per line | |
| Total Transaction Tax | 11.89% | ||
| Utah | |||
| State sales tax | 4.85% | Access and intrastate | |
| Local sales taxes | 2.65% | Avg. of Salt Lake City (2.9%) and Provo (2.4%) | |
| Local utility wireless | 3.50% | Levied at 3.5% max. in SLC and Provo | |
| State 911 service charges | 2.69% | $.96 per line per month | |
| State Radio Network charge | 1.45% | $.52 per line per month | |
| State USF | 1.01% | $0.36 per line per month | |
| Total Transaction Tax | 16.15% | ||
| Vermont | |||
| State sales tax | 6.00% | Access, interstate and intrastate | |
| Local sales tax | 0.50% | Avg. of Montpelier (0%) and Burlington (1%) | |
| State 911/USF | 2.40% | Funds 911 and other programs | |
| Total Transaction Tax | 8.90% | ||
| Virginia | |||
| State communications sales tax | 5.00% | ||
| Wireless 911 | 2.29% | $.82 per month | |
| Wireless 988 | 0.34% | $.12 per month | |
| Total Transaction Tax | 7.63% | ||
| Washington | |||
| State sales tax | 6.50% | Access, interstate and intrastate | |
| Local sales taxes | 3.33% | Olympia (2.9%) & Seattle (3.75%) average | |
| B&O / Utility Franchise — local | 7.50% | Olympia (9%) & Seattle (6%) average | |
| 911 — state | 0.70% | $.25 per month | |
| 911 — local | 1.96% | $.70 per month | |
| 988 fee — state | 0.67% | $.24 per month | |
| Total Transaction Tax | 20.65% | ||
| West Virginia | |||
| State sales tax | 0.00% | No sales tax on wireless | |
| Wireless 911 fee | 9.71% | $3.47 per month | |
| Wireless public safety fee | 0.81% | $0.29 per month | |
| Wireless tower fee | 0.22% | $0.08 per month | |
| Total Transaction Tax | 10.74% | ||
| Wisconsin | |||
| State sales tax | 5.00% | Access, intrastate and interstate | |
| Local sales tax | 0.50% | Avg. of Milwaukee (0.5%) & Madison (0.5%) | |
| Police and Fire Protection Fee | 2.10% | $.75 per month | |
| State USF | 0.28% | 0.449% times FCC safe harbor | |
| Total Transaction Tax | 7.88% | ||
| Wyoming | |||
| State sales tax | 4.00% | Access and intrastate | |
| Local sales tax | 1.50% | Avg. of Cheyenne (2%) and Casper (1%) | |
| TRS | 0.11% | Up to $.25/month — $.04 currently | |
| USF | 1.70% | 2.7% times FCC safe harbor | |
| 911 tax | 2.10% | $.75 per month in Cheyenne and Casper | |
| Total Transaction Tax | 9.41% | ||
| ARPU=$35.74 | |||
| FCC Safe Harbor =62.9% | |||
|
Sources & Methodology: Committee on State Taxation, 50-State Study and Report on Telecommunications Taxation, May 2005. Updated July 2022 by Scott Mackey, Leonine Public Affairs LLP, using state statutes and regulations. Average Monthly Revenue Per Unit (ARPU): $35.74 per Cellular Telephone and Internet Association, July 2022. |
|||
Stay informed on the tax policies impacting you.
Subscribe to our free newsletter to get the latest tax data, news and analysis.
Subscribe[1] The program subsidizes telecommunications services for schools, libraries, hospitals, low-income people, and rural telephone companies operating in high-cost areas. The calculation of the Federal Universal Service Fund (FUSF) surcharge rate assumes that wireless providers use the “safe harbor” percentage. See Appendix B for a full explanation of the methodology.
[2] Figure includes watches, tablets, and other connected devices. Robert Roche, “CTIA’s Wireless Industry Indices Report, Year End 2021 Results,” September 2022, 7.
[3] Stephen J. Blumberg and Julian V. Luke, “Wireless Substitution: Early Release Estimates from the National Health Interview Survey, July-December 2021,” National Center for Health Statistics, May 2022, https://www.cdc.gov/nchs/data/nhis/earlyrelease/wireless202205.pdf.
[4] U.S. Census Bureau, “Quarterly Selected Service Estimates,” Sep. 8, 2022, https://www.census.gov/services/qss/qss-current.pdf.
[5] Missouri has no 911 fee on billed 911 service but does have a 911 fee on prepaid service.
[6] Ulrik Boesen, “Cutting the Cord from Cable Has States Courting New Revenue Streams,” Tax Foundation, July 19, 2021, https://taxfoundation.org/streaming-services-tax/.
[7] These figures are derived from the U.S. Census Bureau’s “Service Annual Survey Latest Data (NAICS-basis),” December 10, 2010, https://www.census.gov/data/tables/2018/econ/services/sas-naics.html.
[8] International Chamber of Commerce, “ICC Discussion Paper on the Adverse Effects of Discriminatory Taxes on Telecommunications Service,” Oct. 26, 2010, https://cdn.iccwbo.org/content/uploads/sites/3/2010/10/ICC-discussion-paper-on-the-adverse-effects-of-discriminatory-taxes-on-telecommunications-services.pdf.
[9] U.S. Census Bureau, “Service Annual Survey Latest Data (NAICS-basis),” November 23, 2021, Table 4, https://www.census.gov/data/tables/2020/econ/services/sas-naics.html.
[10] For the purposes of this report, the FCC safe harbor percentage is used. This allows for consistent multiyear comparisons of taxes, fees, and surcharges.
Share this article