Newly published data from the Congressional Budget Office (CBO) indicates in 2019, before the onset of the pandemic, American incomes continued to rise as part of a broad economic expansion. It also shows that, contrary to common perceptions, the federal tax system is progressive.
The data on household incomes and taxA tax is a mandatory payment or charge collected by local, state, and national governments from individuals or businesses to cover the costs of general government services, goods, and activities. burdens also comes two years after the enactment of the 2017 Tax Cuts and Jobs Act (TCJA), which significantly altered the U.S. tax system, including major components of the individual income tax.
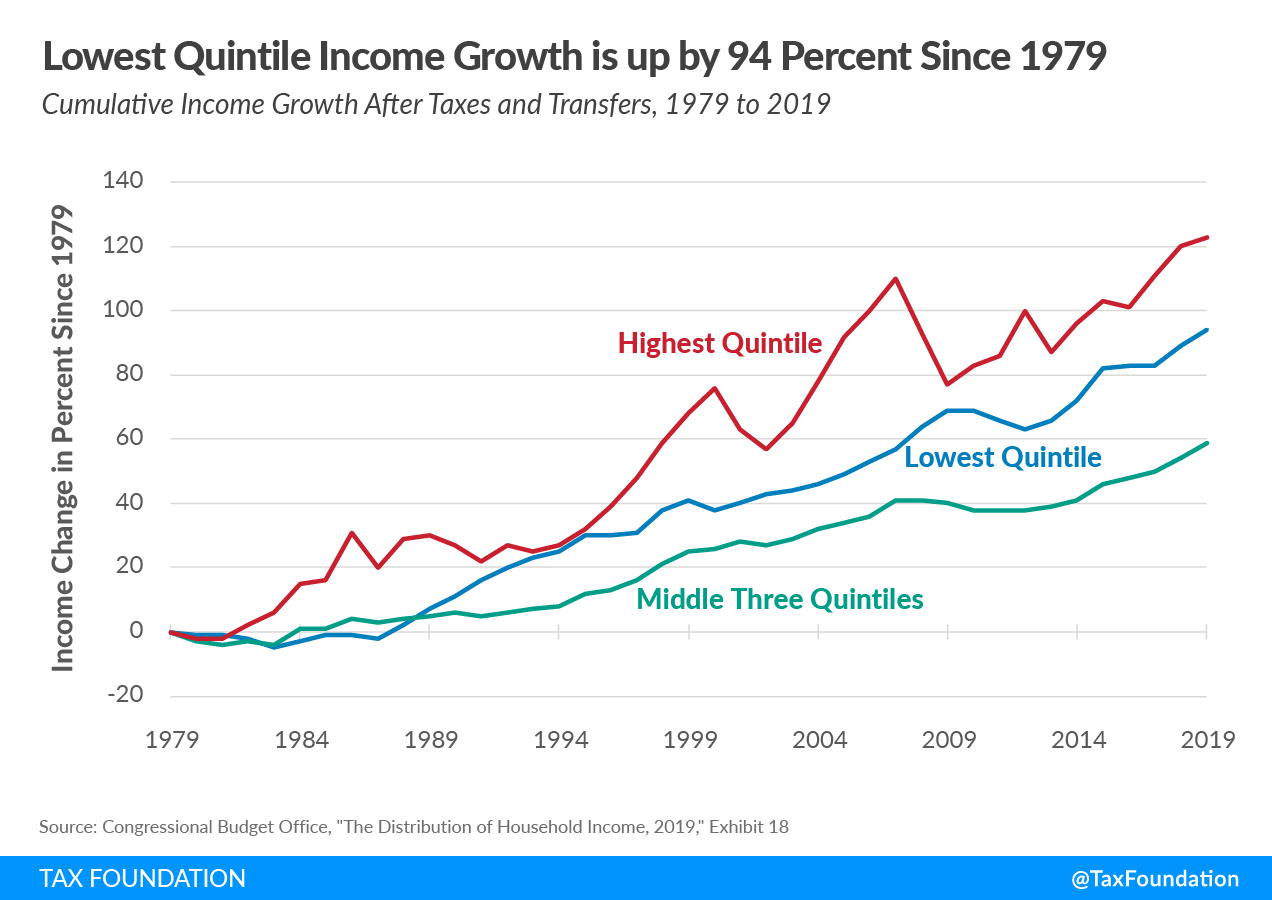
Income growth after taxes and transfers continued upward in 2019 after dipping in 2009 and slightly falling in 2013 and 2016. Since 1979, average incomes in the lowest quintile increased by 94 percent, while average incomes for the middle three quintiles grew by about 59 percent. The highest quintile’s income after taxes and transfers rose by 123 percent since 1979. The CBO data shows that labor income is the major income source for most taxpayers, while business and investment income is a more important income source for higher earners.
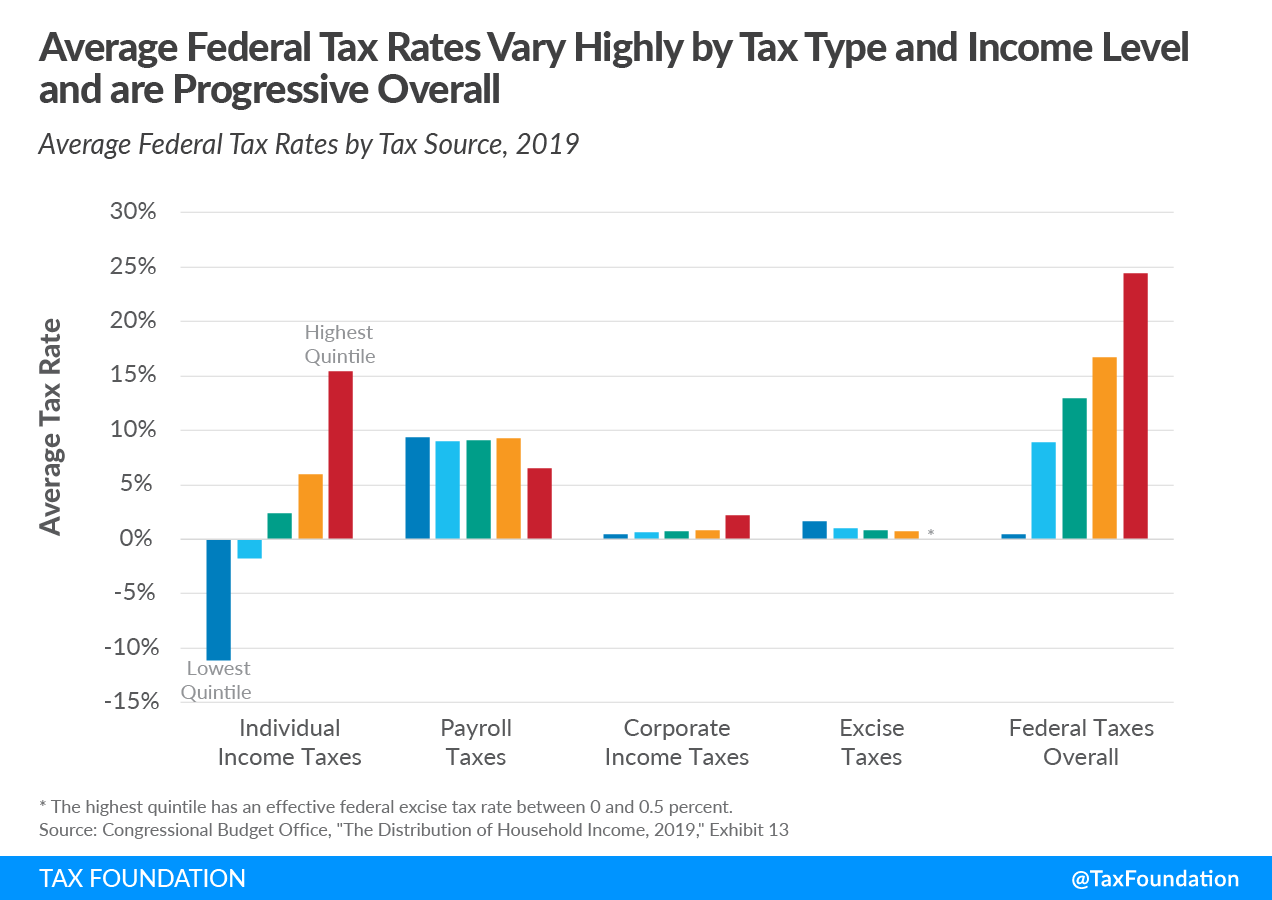
Average federal tax rates vary by revenue source. For example, individual income taxes are highly progressive, providing a negative effective tax rate for taxpayers in the bottom 20 percent due to refundable tax credits such as the Earned Income Tax CreditA tax credit is a provision that reduces a taxpayer’s final tax bill, dollar-for-dollar. A tax credit differs from deductions and exemptions, which reduce taxable income rather than the taxpayer’s tax bill directly. (EITC) and the Child Tax Credit (CTC). These credits provide refunds to filers who do not have tax liabilities to offset, creating a negative effective income tax rate. In fact, the lowest quintile’s average federal tax rate was -11.1 percent in 2019. In contrast, taxpayers in the top 20 percent paid an effective 15.4 percent income tax rate.
Payroll taxes, on the other hand, tend to be more evenly applied, though they’re somewhat regressive, ranging from 9.4 percent in the lowest quintile to 6.5 percent in the top 20 percent. Excise taxes are regressive, as taxpayers in the lower quintiles pay higher effective rates than in higher quintiles.
Corporate income taxes are borne across the income distribution, but effective rates are slightly higher for higher earners, who tend to own more corporate equities than lower earners.
Taken as a whole, the federal tax system was progressive in 2019, applying higher effective tax rates at higher income levels. The effective federal tax rate rose from 0.5 percent for the bottom quintile to 30 percent for the top 1 percent of earners.
The federal tax code has become more progressive over time. The effective federal tax rate for the bottom quintile averaged about 10.6 percent in the 1980s but has remained below 3 percent since 2007. In contrast, the effective federal tax rate for the top 1 percent has remained relatively high over this period, ranging between 25 and 35 percent since 1979.
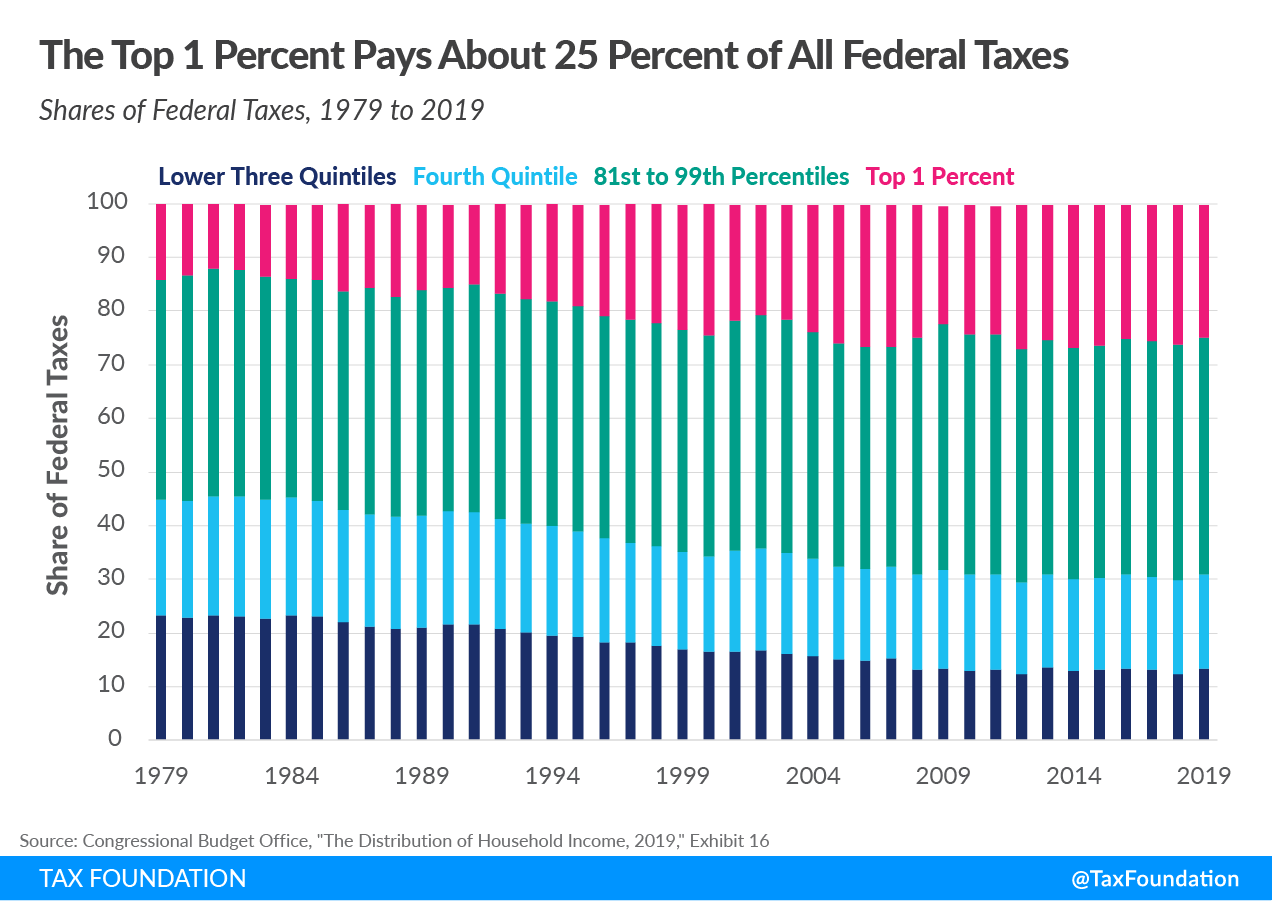
Reflecting the increasing progressivity of the federal tax code, the share of federal taxes paid by high earners has increased in recent decades. The top one percent paid 24.7 percent of all federal taxes in 2019, up from an average of 14.3 percent in the 1980s. By contrast, the share of federal taxes paid by the bottom 60 percent fell from an average of 22.3 percent in the 1980s to 13.3 percent in 2019.
Contrary to common perceptions, the CBO data indicate that: (1) income earned after taxes and transfers has increased over the past several decades for all income groups, (2) the federal tax system is progressive and has become more progressive over the past three decades, and (3) the federal system relies heavily on higher earners to raise revenue for government services and means-tested transfers. Policymakers should remember such facts when considering proposals to increase tax burdens or reshape the distribution of existing taxes.
Stay informed on the tax policies impacting you.
Subscribe to our free newsletter to get the latest tax data, news and analysis.
Subscribe