Key Findings
- Average wage earners in the United States face two major taxes: the individual income taxAn individual income tax (or personal income tax) is levied on the wages, salaries, investments, or other forms of income an individual or household earns. The U.S. imposes a progressive income tax where rates increase with income. The Federal Income Tax was established in 1913 with the ratification of the 16th Amendment. Though barely 100 years old, individual income taxes are the largest source and the payroll taxA payroll tax is a tax paid on the wages and salaries of employees to finance social insurance programs like Social Security, Medicare, and unemployment insurance. Payroll taxes are social insurance taxes that comprise 24.8 percent of combined federal, state, and local government revenue, the second largest source of that combined tax revenue. (levied on both the employee and the employer).
- Although a little more than half of a worker’s payroll tax burden is paid by his employer, the worker ultimately pays this taxA tax is a mandatory payment or charge collected by local, state, and national governments from individuals or businesses to cover the costs of general government services, goods, and activities. through lower take-home pay.
- The total tax burden faced by wage earners in the United States is 31.3 percent of their pre-tax earnings, paying $16,658 in taxes in 2013, with $8,196 in individual income taxes and $8,462 in payroll taxes.
- In the absence of income and payroll taxes and the benefits they provide, the average worker would take home nearly $5,000 in additional annual income for a total of $53,223.
- The total tax burden faced by average U.S. workers is the 25th highest in the OECD, below the 34 country average of 36 percent.
- Many OECD countries have high payroll taxes, such as France, which places a payroll tax burden of 38.5 percent on average workers.
- In some countries, over 50 percent of a worker’s total tax burden is paid by their employer.
Introduction
A significant source of tax revenue for most countries comes from taxes on wage income through individual income taxes and payroll taxes. Most industrialized countries have progressive taxes on income, which means higher income individuals are taxed at higher rates than lower income individuals. However, many countries also place a substantial tax burden on average income earners. While these taxes, especially payroll taxes, pay for government programs, it is important to know what the cost of these programs is from the perspective of the average worker.
Currently, workers earning an average wage in the United States face two major taxes on their income: the individual income tax and the payroll tax (both the employee side and the employer side). The total burden of these taxes equals 31.3 percent of a worker’s income. Although this burden is high, the average across the 34 OECD countries is slightly higher at 35.8 percent. The average OECD tax burden on labor is higher due to higher payroll taxes. In addition, the tax burden on workers with children is lower in most OECD countries than it is for single, childless workers with the same pretax income.
Taxation of Wage Income in the United States
As indicated previously, there are two major types of taxes that wage earners in the United States pay. First, individual income taxes are levied by the federal, state, and, sometimes, local governments and fund the general operations of government. Second, governments levy payroll taxes on both the employee and the employer, though both are ultimately paid by wage earners. Payroll taxes are meant to fund programs such as Social Security, Medicare, and Unemployment Insurance funds.
The Individual Income Tax
The most familiar component of wage taxation in the United States is the federal individual income tax. The federal income tax has a progressive rate structure with marginal rates that range from 10 percent on the first $9,075 of taxable incomeTaxable income is the amount of income subject to tax, after deductions and exemptions. Taxable income differs from—and is less than—gross income. to as high as 39.6 percent on income over $406,750. In 2011, half of all taxpayers fell in the first two brackets, while less than 1 percent of taxpayers paid the top rate.[1]
Table 1. 2014 Taxable Income Brackets and Rates |
|||
| Rate | Single Filers | Married Joint Filers | Head of Household Filers |
| 10% | $0 to $9,075 | $0 to $18,150 | $0 to $12,950 |
| 15% | $9,076 to $36,900 | $18,151 to$73,800 | $12,951 to $49,400 |
| 25% | $36,901 to $89,350 | $73,801 to $148,850 | $49,401 to $127,550 |
| 28% | $89,351 to $186,350 | $148,851 to $226,850 | $127,551 to $206,600 |
| 33% | $186,351 to $405,100 | $226,851 to $405,100 | $206,601 to $405,100 |
| 35% | $405,101 to 406,750 | $405,101 to 457,600 | $405,101 to $432,200 |
| 39.6% | $406,751+ | $457,601+ | $432,201+ |
On top of the federal income tax, 41 states (plus the District of Columbia) tax individual income.[2] Local governments in 17 states also levy an individual income tax.[3]
Payroll Taxes
The United States levies two separate payroll taxes on wage labor. The first tax is a 12.4 percent tax which is used to fund Social Security (Table 2). This tax is levied from the first dollar an individual earns in income up to a cap of $117,000 in 2014. This cap is adjusted to wage changes each year. On paper, the tax is paid half by employers and half by employees. Workers in the U.S. will see a Social Security tax of 6.2 percent on their paystub, with the employer remitting the other 6.2 percent on the employee’s behalf.
The second tax is a 2.9 percent payroll tax to fund Medicare. This tax is also levied from the first dollar of income but has no cap. The tax is also split evenly between employers and employees. An additional 0.9 percent Medicare payroll tax applies to wage income over $200,000 (this cap is not adjusted for inflationInflation is when the general price of goods and services increases across the economy, reducing the purchasing power of a currency and the value of certain assets. The same paycheck covers less goods, services, and bills. It is sometimes referred to as a “hidden tax,” as it leaves taxpayers less well-off due to higher costs and “bracket creep,” while increasing the government’s spendin).[4]
| Table 2. Payroll Taxes, 2014 | |||
| Taxable Earnings | Social Security | Medicare | Total |
| $0 – $117,000 | 12.40% | 2.9% | 15.3% |
| $117,000 – $199,000 | 0% | 2.9% | 2.9% |
| $200,000 and over | 0% | 3.8% | 3.8% |
| Source: Social Security Administration (2014). |
Unemployment Insurance Taxes
In addition to the employer-side taxes that fund Medicare and Social Security, there is an additional payroll tax to fund Unemployment Insurance. Unemployment Insurance is a joint federal-state social insurance program that insures workers against an unexpected loss of income due to losing one’s job. The tax that funds this program is levied on the employer.
The federal unemployment tax is 6 percent on the first $7,000 of payroll. However, states also set UI tax rates to fund their portion of the program. State UI tax rates and bases can vary substantially. The variation is based on how frequently an individual employer’s workers receive unemployment benefits. If an employer is likely to hire and fire her employees at a higher than normal rate, the employer will face a higher tax rate. For example, Kentucky taxes the employer for the first $8,000 of a worker’s wage at rates between 1 and 10 percent. In contrast, Alaska taxes the first $34,000 in wages at rates between 1 and 5.4 percent.
The federal and state rates are not additive, however. Employers can credit 90 percent of their state tax against the federal tax, reducing the federal rate to as low as 0.6 percent.[5]
The Economic Incidence of Payroll Taxes
Although the employer remits the check for their share of the Social Security, Medicare, and Unemployment Insurance taxes, they are not the ones who ultimately pay. In the face of higher labor costs due to their share of the payroll taxes, employers can either reduce employment or reduce the wages of employees. Research has found that employers choose the latter and reduce their employees’ wages by the cost of the employer-side payroll tax.[6] In the absence of the employer-side payroll tax, it is likely that workers would be paid more.
This also brings up an important point about transparency. It is true that these taxes go toward funding for Social Security, Medicare, and Unemployment Insurance, which are potential benefits for taxpayers in the future. However, due to the structure of these taxes, more than a quarter of an average worker’s tax burden does not appear on their paychecks. This hides the true cost of these government programs.
Total Tax Burden on Labor Income in the U.S.
Every year, the OECD surveys all 34 member nations on their labor tax burden. The OECD calculates this burden by adding together the income tax payment, employee payroll tax payment, and the employer-side payroll tax payment of a worker making the average wage in each country. The OECD then divides it by the total labor cost of this average worker, or what the worker would have earned in the absence of these three taxes. This is called the average tax wedge on labor income.

In 2013, the OECD found that the average worker in the United States paid an effective individual income tax rate of 15.4 percent.[7] U.S. workers making an average wage paid an additional 15.9 percent effective payroll tax rate (7 percent on the employee-side[8] and 8.9 percent on the employer-side). Adding up the total average tax rateThe average tax rate is the total tax paid divided by taxable income. While marginal tax rates show the amount of tax paid on the next dollar earned, average tax rates show the overall share of income paid in taxes. of these three taxes, a single worker without children who earned the annual income of $48,486 faced an average tax wedgeBroadly speaking, a tax wedge is the difference between the pre-tax price or return and after-tax price or return. For labor income, it is the difference between the total labor costs to the employer and the corresponding net take-home pay of the employee. of 31.3 percent in 2013 (Figure 1).[9]
This represents an $8,196 average individual income tax bill and an $8,462 average payroll tax bill for a total average tax bill of about $16,658.
In the absence of these three taxes, the average worker would have taken home $53,223.
How Does the United States Compare with Other OECD Nations?
A total tax burden of 31.3 percent on labor income in the United States appears high, but workers in other industrialized nations face an even higher tax burden.
Workers Earning an Average Wage Face a Higher Tax Burden in the Other Industrialized Nations Compared to Workers in the United States
Compared to the United States, other countries in the OECD place a relatively high tax burden on average wage earners (Figure 2). The OECD has an average tax wedge on average income earners of 35.8 percent. This is 4.5 percentage points higher than the U.S. tax wedge of 31.3 percent, which ranks as the 25th highest in the OECD.
The highest total tax burden on wage income is in Belgium at 55.8 percent, followed by Germany (49.4 percent) and Austria (49.0 percent). The country with the lowest total tax rate on its labor is Chile at 7 percent. New Zealand had the second lowest effective rate at 16.9 followed by Mexico at 19.2 percent.
On average, single, childless workers in the OECD face a combined individual income and payroll tax burden of about $2,395 more than workers in the United States.

Payroll Tax Burdens Tend to Be High in the OECD and Make up a Significant Portion of a Worker’s Tax Bill
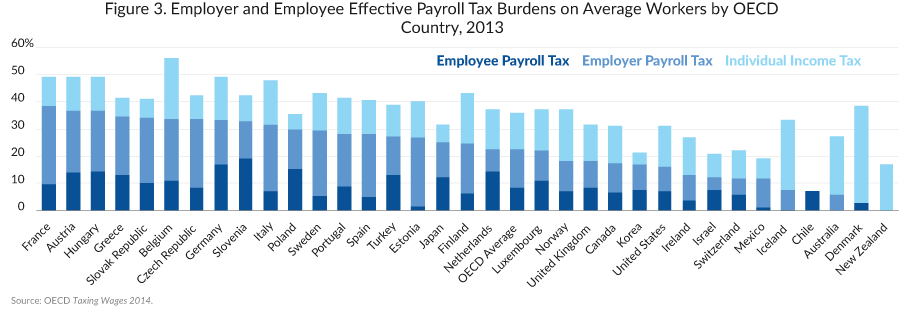
As in the United States, payroll taxes in other OECD countries go toward funding social insurance programs. These programs, especially in Europe, tend to cost a significant amount.[10] As a result, most OECD countries’ high average tax burden on labor is due to high payroll taxes (Figure 3).
The average combined (employee and employer) payroll tax rate in the OECD was 22.6 percent in 2013, which was 6.7 percent higher than the U.S’s combined rate of 15.9 percent. France had the highest combined payroll tax burden of 38.5 percent. This is followed by Austria and Hungary, both with effective payroll tax rates of 36.6 percent. These three countries’ payroll tax burdens alone are greater than the total tax burden on laborers in the United States.
The countries with the lowest combined payroll tax burden were Australia (5.6 percent), Denmark (2.7 percent) and New Zealand (0 percent). New Zealand was the only country in 2013 that doesn’t levy a payroll tax on the average worker.
It is also interesting to note that even though Denmark has low payroll taxes, they still place a relatively high tax burden on average workers through higher individual income taxes (an effective rate of 36 percent).
In 29 of 34 OECD countries, payroll taxes made up half or more of an average single worker’s total tax burden in 2013.
Employer-Side Payroll Taxes Tend to Be Higher than Employee-Side Payroll Taxes
All countries with payroll taxes, except for Chile and Denmark, split their payroll tax burden between the employee and employer. On average, employer-side taxes tend to be higher across the OECD.
The average OECD employee-side payroll tax burden in 2013 was 8.3 percent. Slovenia had the highest employee-side payroll tax in the OECD at 19 percent, followed by Germany (17.1 percent) and Poland (15.3 percent). Average workers in the United States faced an effective rate of 7 percent.
The average employer-side payroll tax burden in the OECD is higher (14.3 percent). France, which has the highest overall payroll tax rate, also has the highest effective employer-side payroll tax at 28.7 percent. Estonia and the Czech Republic follow, both with an effective rate of 25.4 percent.
Employer-side payroll taxes are less transparent than employee-side payroll taxes, as employers remit the check to the government, but employees pay the cost through lower wages.
In Nine OECD Countries, Half of the Average Worker’s Tax Burden Is Paid by Their Employers
For workers in nine OECD countries, half or more of their total tax burden was paid by their employers (Figure 4). For instance, France had an employer-side payroll tax of 28.7 percent, which was the highest employer-side payroll tax in the OECD in 2013. This tax was 58 percent of the total tax burden faced by French workers in 2013.
The country whose workers paid the largest proportion of their total tax bill through their employer payroll taxes was Estonia. Their 25.4 percent employer-side payroll tax was 63.6 percent of their total tax burden in 2013.
In contrast, the 8.9 percent employer-side of the payroll tax in the United States only makes up 28 percent of an average worker’s tax burden.
The Tax Burden of Average Workers in the OECD Varies Based on Family Composition
It is also important to point out that the tax burden of average workers varies based on family composition. Most OECD countries provide some tax relief for families with children.

Comparing single, childless workers and single-earner families with two children earning the same pretax income illustrates how taxes can differ by family composition throughout the OECD (Figure 5). On average, the tax burden for families (an average of 26.4 percent in 2013) in the OECD is 27.2 percent lower than the tax burden on single, childless workers (an average of 35.8 percent).
The United States, with the Child Tax Credit and the personal exemption, reduced the tax burden of families with two children (a rate of 20.3 percent) by 35.1 percent compared to the tax burden on a single, childless worker (a rate of 31.3 percent) in 2013. Lower-income workers with children also benefitted more from the Earned Income Tax Credit (EITC) than lower-income workers without children.
New Zealand provided the largest relative reduction of taxes for families with children compared to single childless workers. The total tax burden of a married couple with two children in New Zealand (2.4 percent) was 85 percent lower than the 16.9 percent total tax burden on a single, childless worker in 2013.
Mexico and Chile were neutral between families with children or without. Greece was the only country that levied a higher total tax burden on families compared to single childless workers.

Conclusion
Although the United States and most OECD countries are known for having progressive taxA progressive tax is one where the average tax burden increases with income. High-income families pay a disproportionate share of the tax burden, while low- and middle-income taxpayers shoulder a relatively small tax burden. systems that tax high-income earners more than low- or moderate-income earners, a large portion of the tax burden still falls on the average worker. Even here in the United States, which has lower tax burdens than most other OECD countries, average workers end up paying nearly one-third of their income in taxes. It is true that governments in the OECD, especially European countries, provide more government programs. However, their workers end up paying a much higher price for them.
Table 3. Tax Wedge of Average Income Earner by OECD Country, 2013 |
|||||||
| Social Security Contributions | |||||||
| Country | Rank | Total Tax Wedge | Income Tax | Employee | Employer | Average Labor Costs | |
| Belgium | 1 | 55.8% | 22.0% | 10.8% | 23.0% | $ 72,974.00 | |
| Germany | 2 | 49.3% | 16.0% | 17.1% | 16.2% | $ 68,962.00 | |
| Austria | 3 | 49.0% | 12.6% | 14.0% | 22.6% | $ 64,980.00 | |
| Hungary | 3 | 49.0% | 12.5% | 14.4% | 22.2% | $ 29,465.00 | |
| France | 5 | 48.9% | 10.4% | 9.8% | 28.7% | $ 61,648.00 | |
| Italy | 6 | 47.8% | 16.3% | 7.2% | 24.3% | $ 52,080.00 | |
| Finland | 7 | 43.1% | 18.4% | 6.2% | 18.6% | $ 57,406.00 | |
| Sweden | 8 | 42.9% | 13.7% | 5.3% | 23.9% | $ 59,649.00 | |
| Czech Republic | 9 | 42.4% | 8.8% | 8.2% | 25.4% | $ 30,096.00 | |
| Slovenia | 10 | 42.3% | 9.4% | 19.0% | 13.9% | $ 34,282.00 | |
| Greece | 11 | 41.6% | 7.1% | 12.9% | 21.5% | $ 40,650.00 | |
| Portugal | 12 | 41.1% | 13.1% | 8.9% | 19.2% | $ 35,511.00 | |
| Slovak Republic | 12 | 41.1% | 7.1% | 10.2% | 23.8% | $ 25,867.00 | |
| Spain | 14 | 40.7% | 12.8% | 4.9% | 23.0% | $ 49,723.00 | |
| Estonia | 15 | 39.9% | 13.0% | 1.5% | 25.4% | $ 28,430.00 | |
| Turkey | 16 | 38.6% | 11.6% | 12.9% | 14.2% | $ 34,293.00 | |
| Denmark | 17 | 38.2% | 35.8% | 2.7% | 0.0% | $ 51,772.00 | |
| Norway | 18 | 37.3% | 18.9% | 6.9% | 11.5% | $ 67,289.00 | |
| Luxembourg | 19 | 37.0% | 15.1% | 11.0% | 11.0% | $ 64,680.00 | |
| Netherlands | 20 | 36.9% | 14.3% | 14.2% | 8.4% | $ 63,585.00 | |
| Poland | 21 | 35.6% | 5.9% | 15.3% | 14.4% | $ 26,822.00 | |
| Iceland | 22 | 33.4% | 25.9% | 0.4% | 7.1% | $ 48,334.00 | |
| Japan | 23 | 31.6% | 6.7% | 12.2% | 12.8% | $ 54,790.00 | |
| United Kingdom | 24 | 31.5% | 13.3% | 8.5% | 9.8% | $ 56,797.00 | |
| United States | 25 | 31.3% | 15.4% | 7.0% | 8.9% | $ 53,223.00 | |
| Canada | 26 | 31.1% | 13.7% | 6.6% | 10.8% | $ 43,643.00 | |
| Australia | 27 | 27.4% | 21.8% | 0.0% | 5.6% | $ 55,766.00 | |
| Ireland | 28 | 26.6% | 13.3% | 3.6% | 9.7% | $ 44,494.00 | |
| Switzerland | 29 | 22.0% | 10.2% | 5.9% | 5.9% | $ 68,317.00 | |
| Korea | 30 | 21.4% | 4.6% | 7.5% | 9.3% | $ 51,895.00 | |
| Israel | 31 | 20.7% | 8.4% | 7.5% | 4.8% | $ 34,046.00 | |
| Mexico | 32 | 19.2% | 7.5% | 1.2% | 10.5% | $ 13,964.00 | |
| New Zealand | 33 | 16.9% | 16.9% | 0.0% | 0.0% | $ 36,381.00 | |
| Chile | 34 | 7.0% | 0.0% | 7.0% | 0.0% | $ 18,989.00 | |
| OECD Average | N/A | 35.8% | 13.3% | 8.3% | 14.3% | ||
| Source: OECD Taxing Wages (2014). |
[1] According to IRS data for 2011, 50 percent of all taxpayers had adjusted gross incomeFor individuals, gross income is the total of all income received from any source before taxes or deductions. It includes wages, salaries, tips, interest, dividends, capital gains, rental income, alimony, pensions, and other forms of income. For businesses, gross income (or gross profit) is the sum of total receipts or sales minus the cost of goods sold (COGS)—the direct costs of producing goods of $34,824 or below. One percent of all taxpayers had income over $388,905. See Kyle Pomerleau, Summary of Latest Federal Income Tax Data, Tax Foundation Fiscal Fact No. 408 (Dec. 18, 2013), https://taxfoundation.org/article/summary-latest-federal-income-tax-data.
[2] Tax Foundation, Facts and Figures 2014: How Does Your State Compare?, https://taxfoundation.org/blog/facts-figures-2014-how-does-your-state-compare.
[3] Gerald Prante & Austin John, Top Marginal Effective Tax Rates by State and by Source of Income, 2012 Tax Law vs. 2013 Tax Law (as enacted in ATRA) (Feb. 3, 2013), http://papers.ssrn.com/sol3/papers.cfm?abstract_id=2176526.
[4] Social Security Administration, 2014 Social Security Changes, http://www.ssa.gov/pressoffice/factsheets/colafacts2014.html.
[5] Joseph Henchman, Unemployment Insurance Taxes: Options for Program Design and Insolvent Trust Funds, Tax Foundation Background Paper No. 61 (Oct. 17, 2011), https://taxfoundation.org/article/unemployment-insurance-taxes-options-program-design-and-insolvent-trust-funds.
[6] Jonathan Gruber, The Incidence of Payroll Taxation: Evidence from Chile, NBER Working Paper No. 5053 (Mar. 1995), http://www.nber.org/papers/w5053.
[7] OECD, Taxing Wages 2014 (May 2014), http://www.oecd-ilibrary.org/taxation/taxing-wages-2014_tax_wages-2014-en.
[8] While the employee-side payroll tax is a combined 7.65 percent, the effective tax rate on total labor costs is reduced by 1-8.9 percent to account for the reduction in the worker’s taxable income.
[9] This is the gross income after employer-side payroll taxes. Number derived by multiplying the OECD measure of the U.S. average labor cost of $53,223 by 1-8.9 percent.
[10] For instance, Belgium and Germany, the countries with the highest tax burdens on wage earners, spend an equivalent of 30.7 percent and 26.2 percent, respectively, of their GDPs on social welfare. See OECD, OECD StatExtracts, Social Expenditure—Aggregated Data, 2013, http://stats.oecd.org/Index.aspx?DataSetCode=SOCX_AGG.