





Many countries incentivize business investment in research and development (R&D), intending to foster innovation. A common approach is to provide direct government funding for R&D activity. However, a significant number of jurisdictions also offers R&D tax incentives.
These generally take two forms, namely patent boxes—taxing income derived from intellectual property at a rate below the statutory corporate income taxA corporate income tax (CIT) is levied by federal and state governments on business profits. Many companies are not subject to the CIT because they are taxed as pass-through businesses, with income reportable under the individual income tax. rate—and taxA tax is a mandatory payment or charge collected by local, state, and national governments from individuals or businesses to cover the costs of general government services, goods, and activities. incentives for R&D expenditures. This map focuses on the latter, showing to what degree European countries grant expenditure-based R&D tax relief. The implied tax subsidy rate, developed by the Organisation for Economic Co-operation and Development (OECD), is one way to measure the extent of expenditure-based R&D tax relief across countries. This implied tax subsidy rate measures the extent of the preferential treatment of R&D in a given tax system. The more generous the tax provisions for R&D, the higher the implied subsidy rates for R&D. An implied subsidy rate of zero means R&D does not receive preferential tax treatment.
2026 Data
2025
2024
2023
2022
2021
2020
Expand or Collapse Table
Implied Tax Subsidy Rates on R&D Expenditures in European OECD and EU Countries, 2025
| SME, Profitable | SME, Loss-making | Large Firm, Profitable | Large Firm, Loss-making | |
|---|---|---|---|---|
| Austria (AT) | 0.17 | 0.17 | 0.17 | 0.17 |
| Belgium (BE) | 0.16 | 0.15 | 0.16 | 0.15 |
| Bulgaria (BG) | 0 | 0 | 0 | 0 |
| Croatia (HR) | 0.04 | 0.03 | 0.07 | 0.05 |
| Cyprus (CY) | 0.02 | 0.02 | 0.02 | 0.02 |
| Czech Republic (CZ) | 0.24 | 0.17 | 0.24 | 0.17 |
| Denmark (DK) | 0.01 | 0.01 | 0.01 | 0.01 |
| Estonia (EE) | 0.04 | 0.04 | 0.04 | 0.04 |
| Finland (FI) | 0.12 | 0.09 | 0.12 | 0.09 |
| France (FR) | 0.36 | 0.36 | 0.36 | 0.29 |
| Georgia (GE) | 0 | 0 | 0 | 0 |
| Germany (DE) | 0.32 | 0.3 | 0.22 | 0.21 |
| Greece (GR) | 0.26 | 0.2 | 0.26 | 0.2 |
| Hungary (HU) | 0.17 | 0.16 | 0.17 | 0.16 |
| Iceland (IS) | 0.43 | 0.43 | 0.3 | 0.3 |
| Ireland (IE) | 0.27 | 0.27 | 0.27 | 0.27 |
| Italy (IT) | 0.09 | 0.09 | 0.09 | 0.09 |
| Latvia (LV) | 0 | 0 | 0 | 0 |
| Lithuania (LT) | 0.31 | 0.25 | 0.31 | 0.25 |
| Luxembourg (LU) | -0.01 | -0.01 | -0.01 | -0.01 |
| Malta (MT) | -0.02 | -0.02 | -0.02 | -0.02 |
| Netherlands (NL) | 0.31 | 0.3 | 0.15 | 0.14 |
| Norway (NO) | 0.22 | 0.22 | 0.22 | 0.22 |
| Poland (PL) | 0.36 | 0.28 | 0.36 | 0.28 |
| Portugal (PT) | 0.39 | 0.31 | 0.39 | 0.31 |
| Romania (RO) | 0.08 | 0.07 | 0.08 | 0.07 |
| Slovak Republic (SK) | 0.28 | 0.22 | 0.28 | 0.22 |
| Slovenia (SI) | 0.26 | 0.2 | 0.26 | 0.2 |
| Spain (ES) | 0.33 | 0.26 | 0.33 | 0.26 |
| Sweden (SE) | 0.11 | 0.11 | 0.11 | 0.11 |
| Switzerland (CH) | -0.01 | -0.01 | -0.01 | -0.01 |
| Turkey (TR) | 0.06 | 0.05 | 0.06 | 0.05 |
| United Kingdom (GB) | 0.22 | 0.17 | 0.18 | 0.18 |
| European Average | 0.17 | 0.15 | 0.16 | 0.14 |
| United States (US) - for comparison | 0.03 | 0.03 | 0.03 | 0.02 |
| People's Republic of China (CN) – for comparison | 0.32 | 0.25 | 0.32 | 0.24 |
Data compiled by Alex Mengden
Expand or Collapse Table
Implied Tax Subsidy Rates on R&D Expenditures in European OECD and EU Countries, 2024
| SME | Large Firm | |||
|---|---|---|---|---|
| Profitable | Loss-making | Profitable | Loss-making | |
| Austria (AT) | 0.17 | 0.17 | 0.17 | 0.17 |
| Belgium (BE) | 0.16 | 0.15 | 0.16 | 0.15 |
| Bulgaria (BG) | 0 | 0 | 0 | 0 |
| Croatia (HR) | 0.04 | 0.03 | 0.07 | 0.05 |
| Cyprus (CY) | 0.02 | 0.02 | 0.02 | 0.02 |
| Czech Republic (CZ) | 0.24 | 0.17 | 0.24 | 0.17 |
| Denmark (DK) | 0.01 | 0.01 | 0.01 | 0.01 |
| Estonia (EE) | 0.04 | 0.04 | 0.04 | 0.04 |
| Finland (FI) | 0.12 | 0.09 | 0.12 | 0.09 |
| France (FR) | 0.36 | 0.36 | 0.36 | 0.29 |
| Georgia (GE) | 0 | 0 | 0 | 0 |
| Germany (DE) | 0.32 | 0.3 | 0.22 | 0.21 |
| Greece (GR) | 0.26 | 0.2 | 0.26 | 0.2 |
| Hungary (HU) | 0.17 | 0.16 | 0.17 | 0.16 |
| Iceland (IS) | 0.43 | 0.43 | 0.3 | 0.3 |
| Ireland (IE) | 0.27 | 0.27 | 0.27 | 0.27 |
| Italy (IT) | 0.09 | 0.09 | 0.09 | 0.09 |
| Latvia (LV) | 0 | 0 | 0 | 0 |
| Lithuania (LT) | 0.31 | 0.25 | 0.31 | 0.25 |
| Luxembourg (LU) | -0.01 | -0.01 | -0.01 | -0.01 |
| Malta (MT) | -0.02 | -0.02 | -0.02 | -0.02 |
| Netherlands (NL) | 0.31 | 0.3 | 0.15 | 0.14 |
| Norway (NO) | 0.22 | 0.22 | 0.22 | 0.22 |
| Poland (PL) | 0.36 | 0.28 | 0.36 | 0.28 |
| Portugal (PT) | 0.39 | 0.31 | 0.39 | 0.31 |
| Romania (RO) | 0.08 | 0.07 | 0.08 | 0.07 |
| Slovak Republic (SK) | 0.28 | 0.22 | 0.28 | 0.22 |
| Slovenia (SI) | 0.26 | 0.2 | 0.26 | 0.2 |
| Spain (ES) | 0.33 | 0.26 | 0.33 | 0.26 |
| Sweden (SE) | 0.11 | 0.11 | 0.11 | 0.11 |
| Switzerland (CH) | -0.01 | -0.01 | -0.01 | -0.01 |
| Turkey (TR) | 0.06 | 0.05 | 0.06 | 0.05 |
| United Kingdom (GB) | 0.22 | 0.17 | 0.18 | 0.18 |
| European Average | 0.17 | 0.15 | 0.16 | 0.14 |
| United States (US) - for comparison | 0.03 | 0.03 | 0.03 | 0.02 |
| People's Republic of China (CN) – for comparison | 0.32 | 0.25 | 0.32 | 0.24 |
Data compiled by Alex Mengden
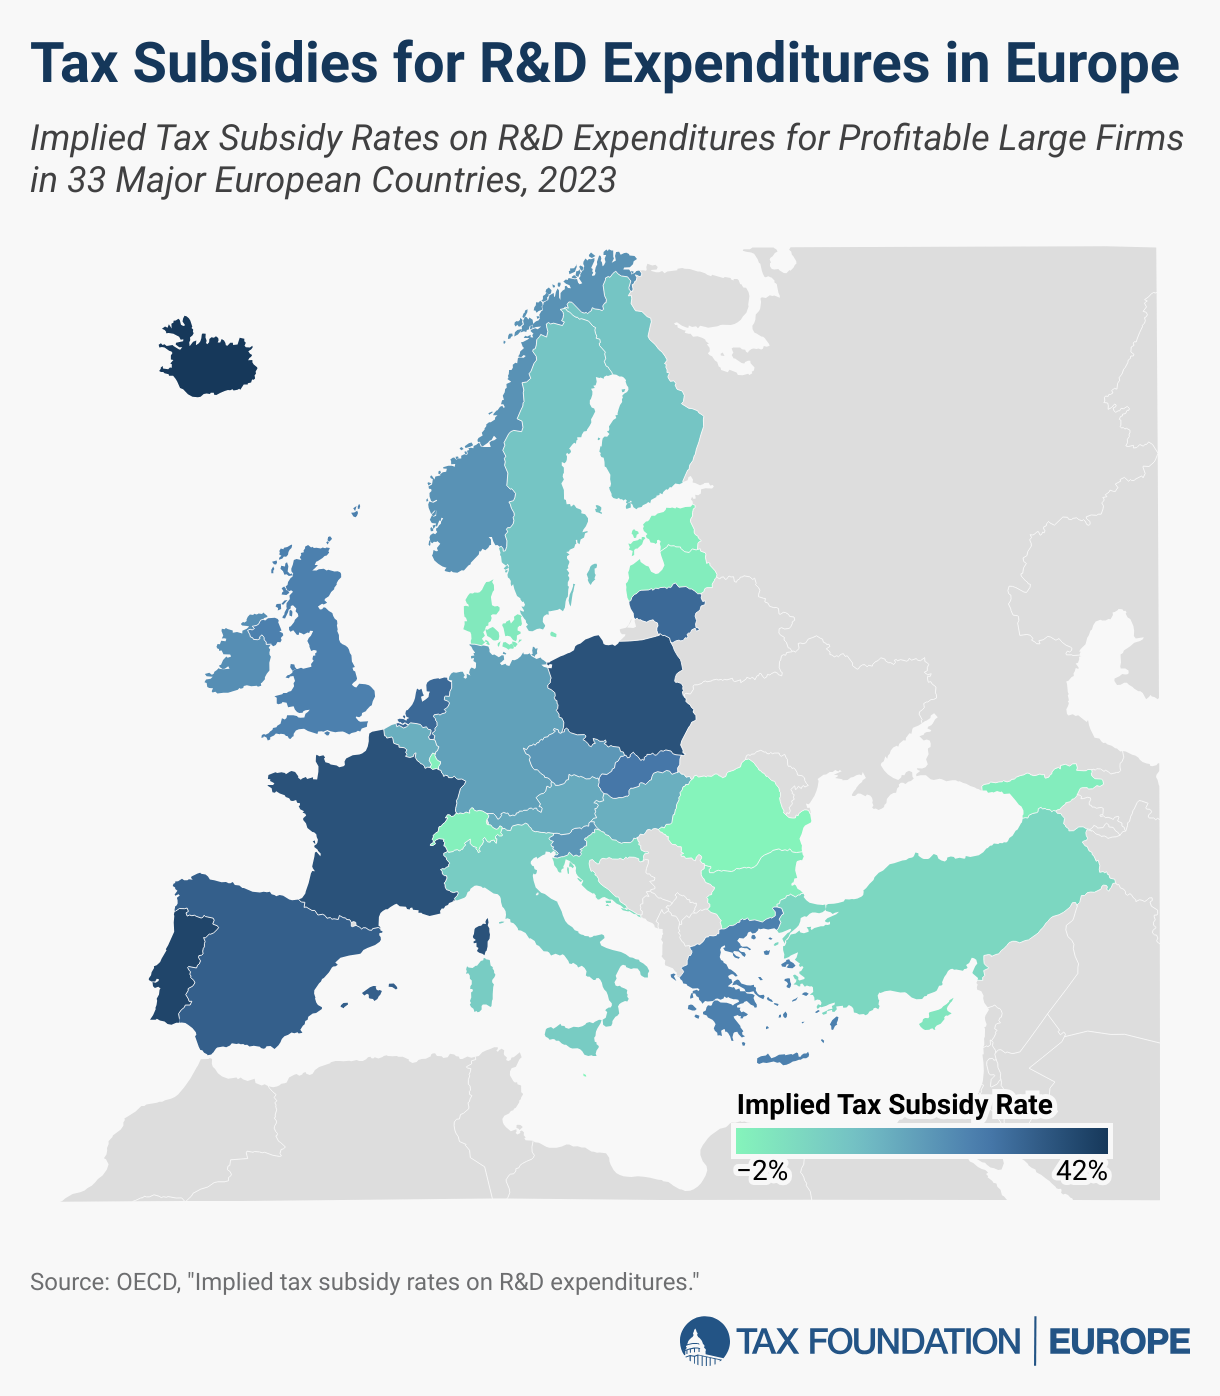
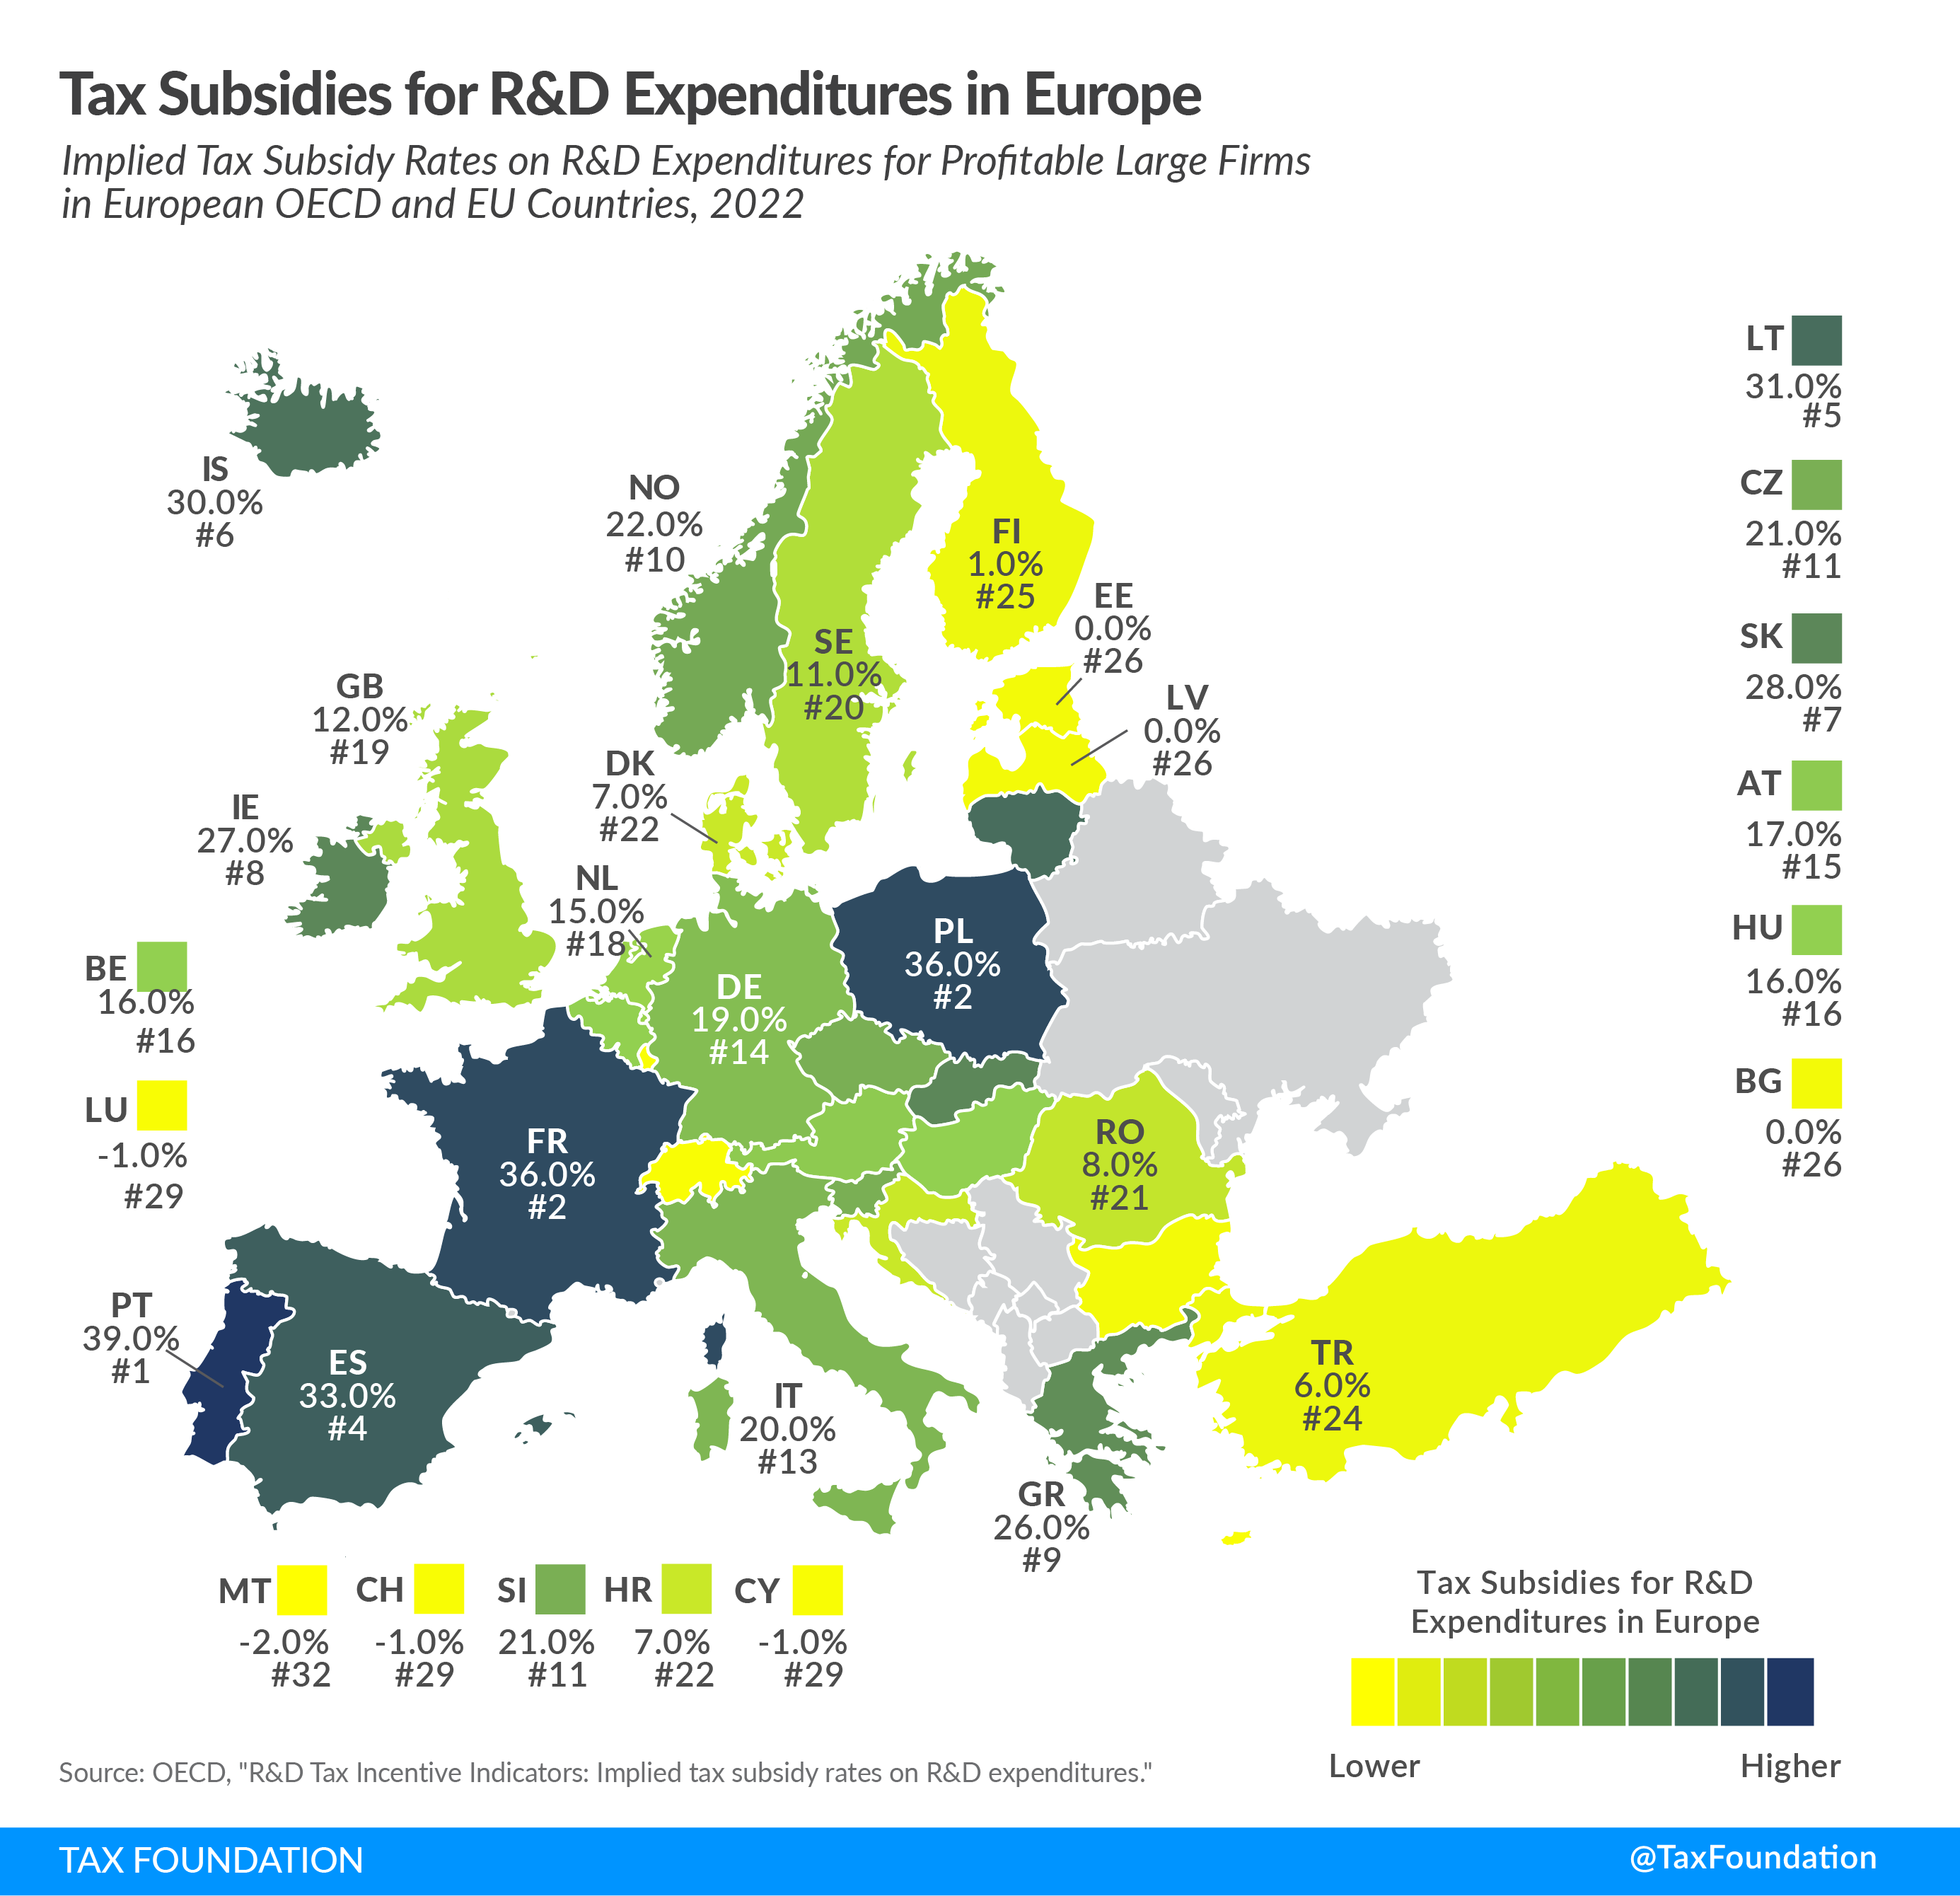
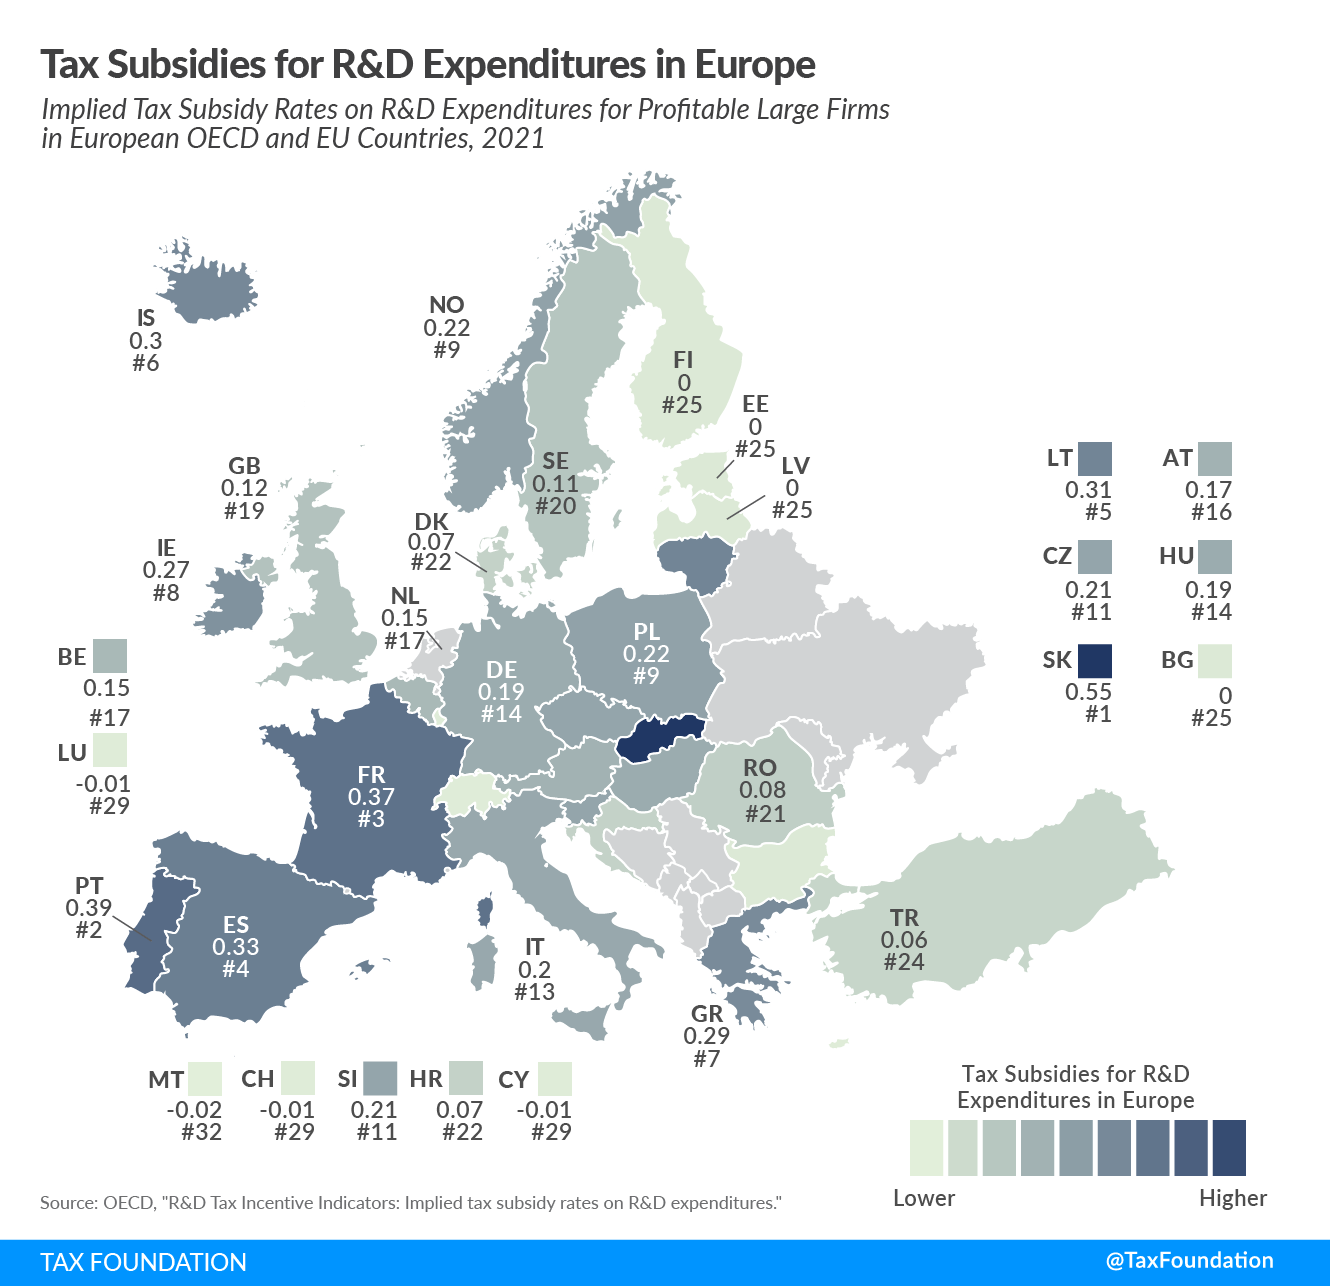
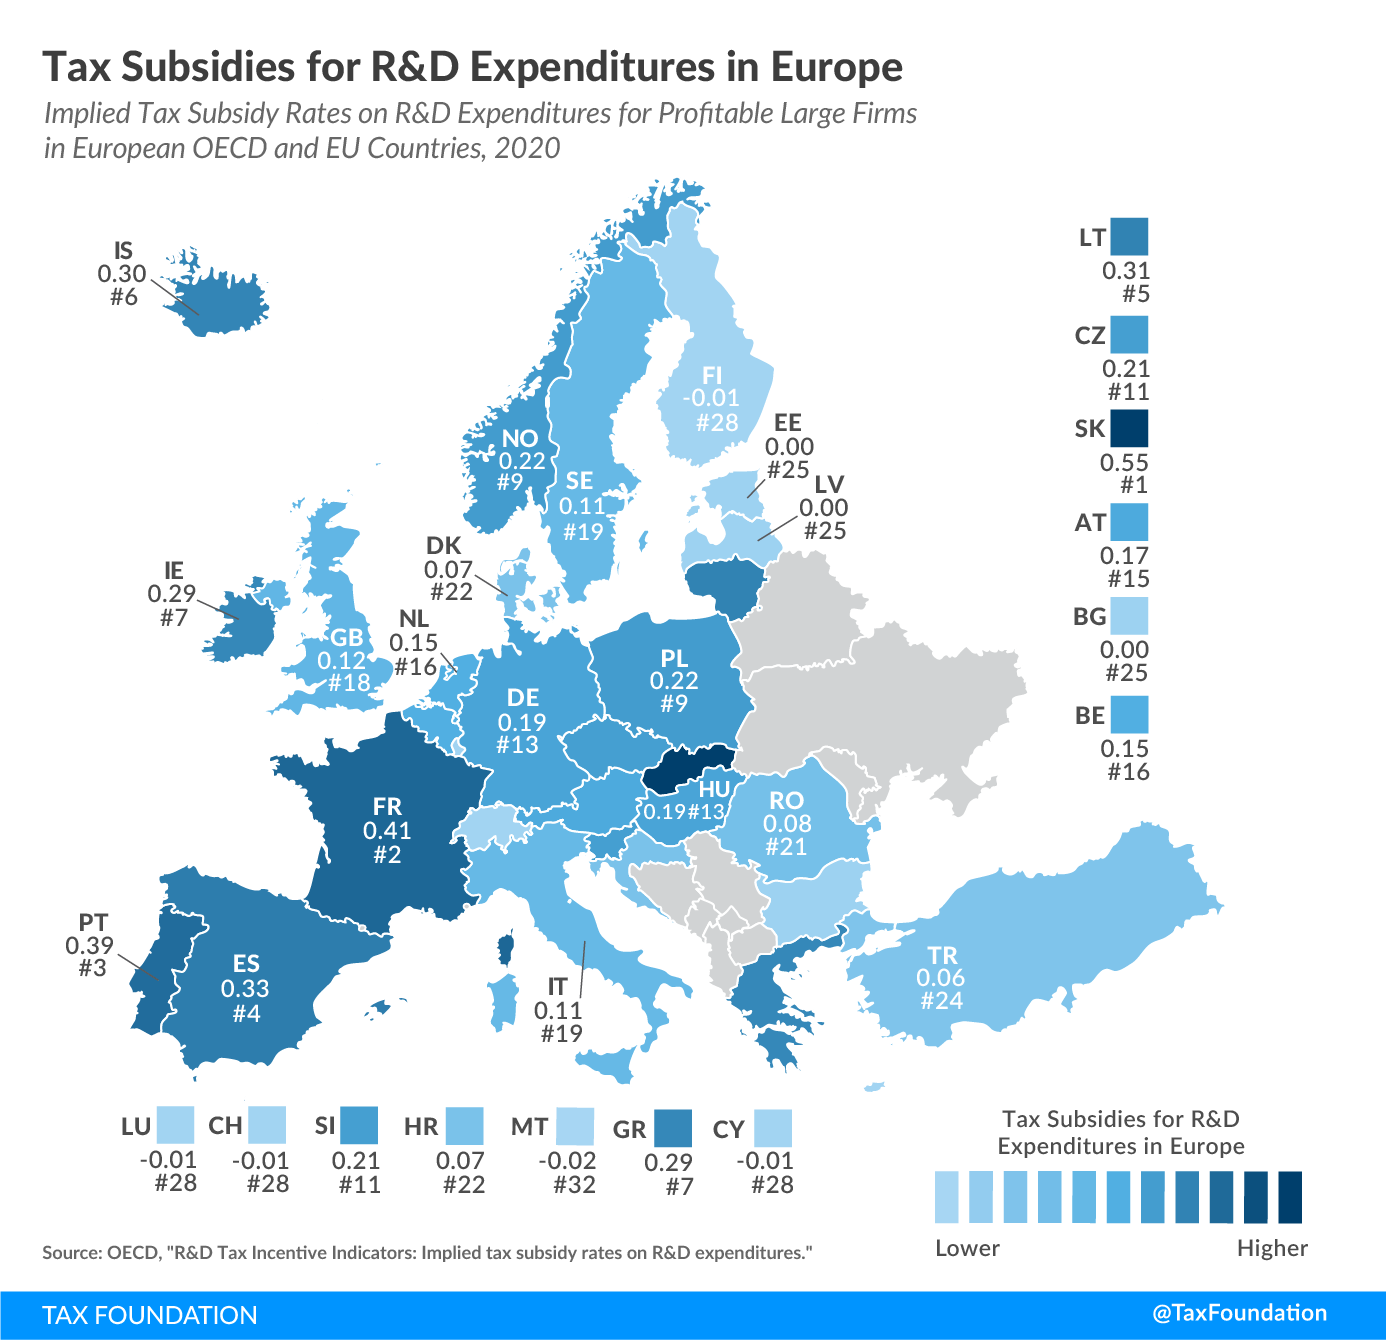
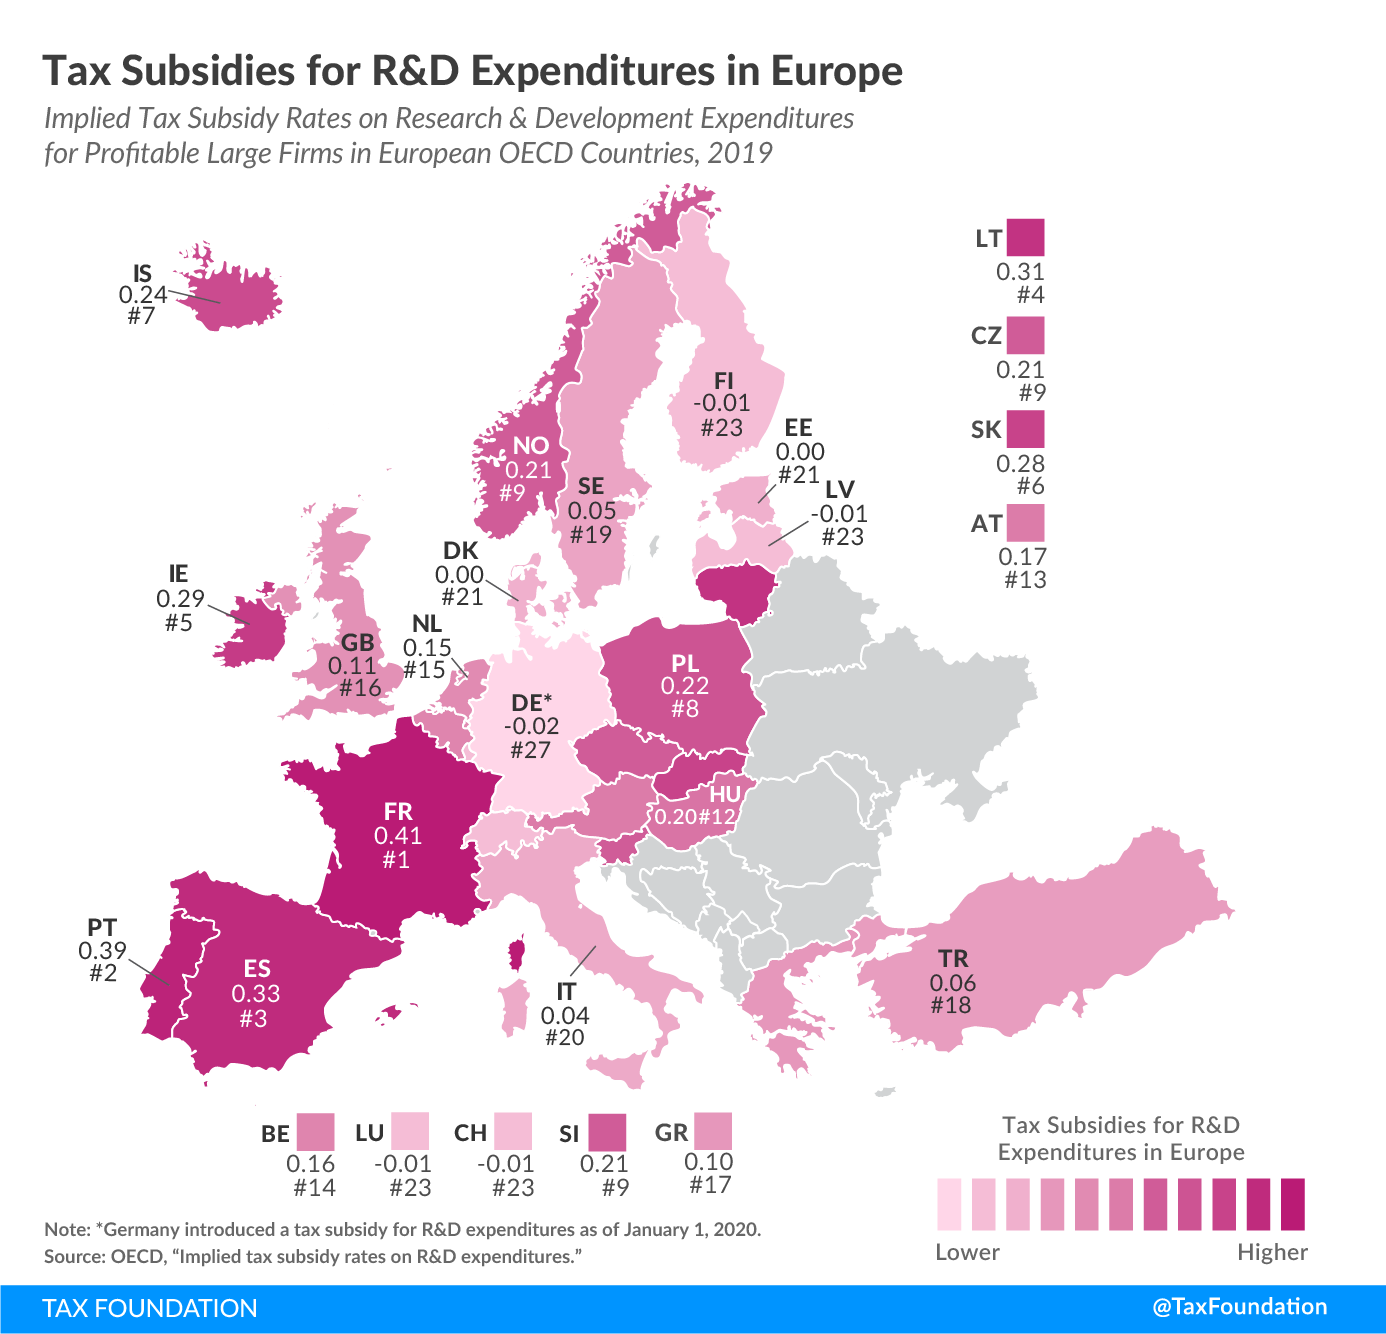
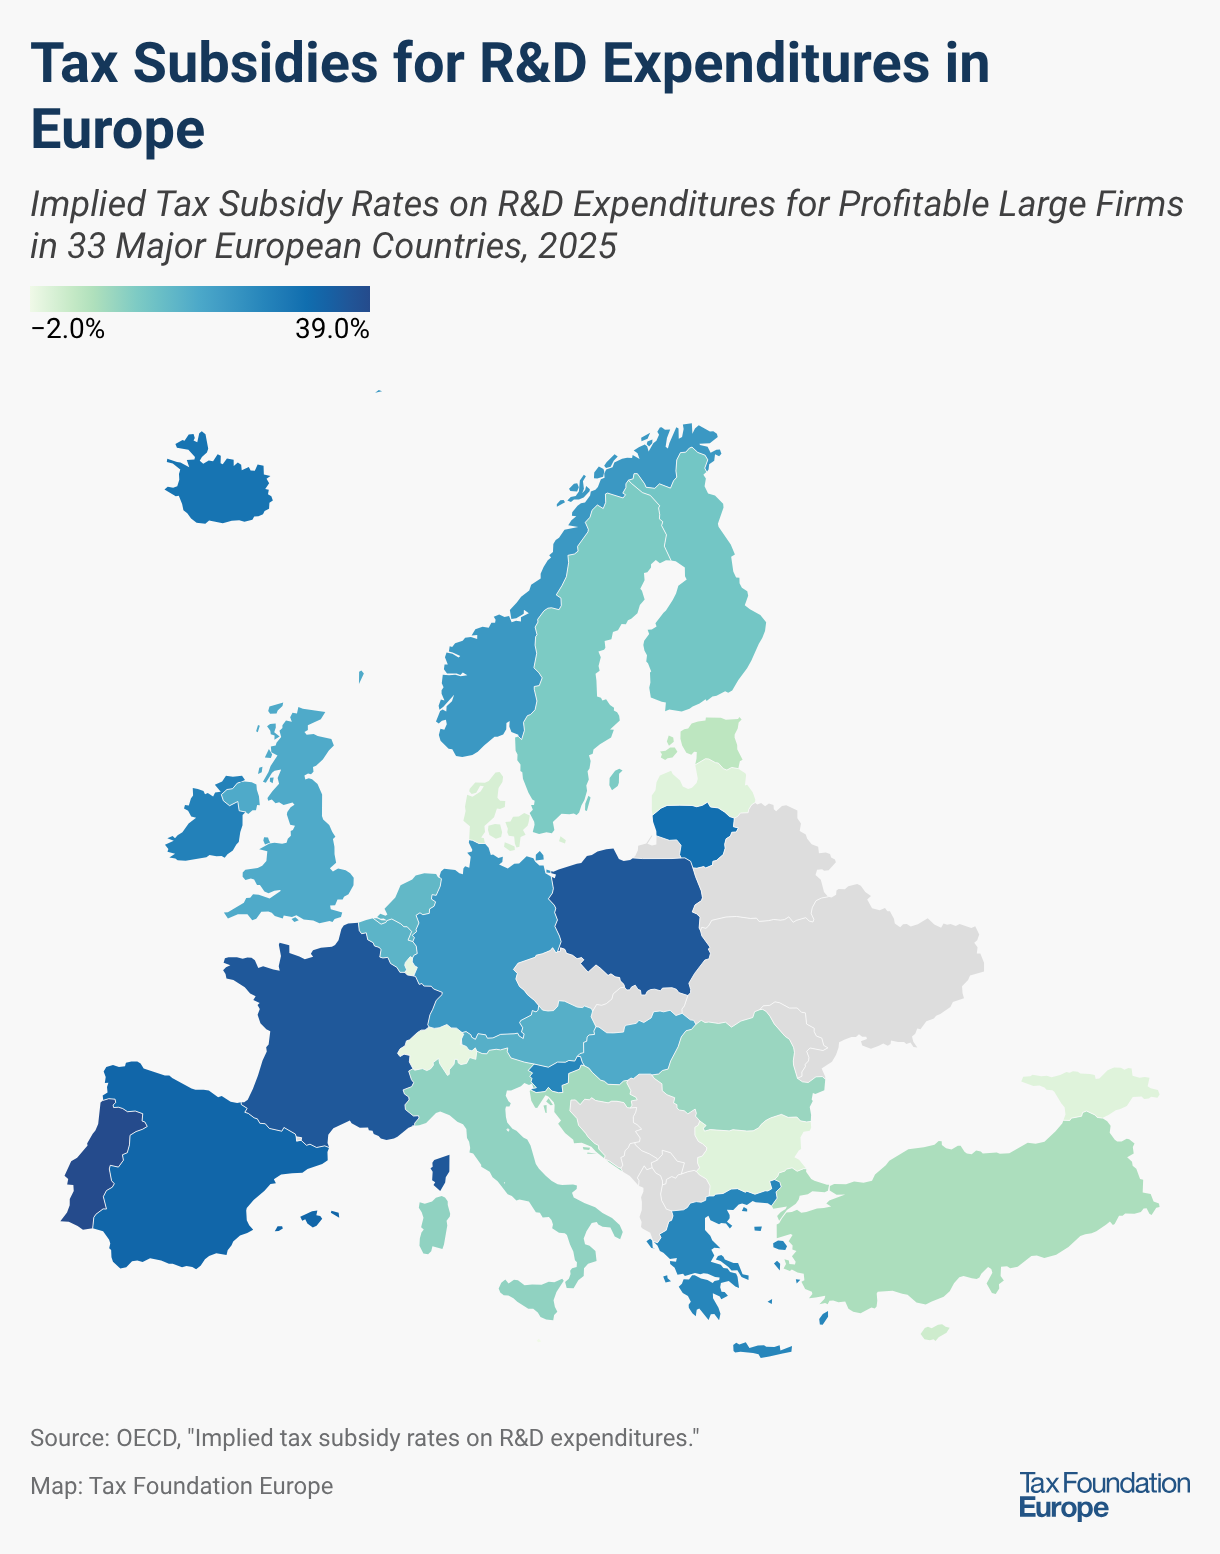
The implied tax subsidy rates for large profitable firms vary significantly among countries that grant notable relief, ranging from 1 percent in Denmark to 39 percent in Portugal. France and Poland provide the second and third most generous relief after Portugal, with implied tax subsidy rate of 36 percent.
Of the countries that grant notable relief, Denmark (1 percent), Cyprus (2 percent), and Estonia (4 percent) are the least generous. The implied tax subsidy rates of Bulgaria, Georgia, Latvia, Luxembourg, Malta, and Switzerland do not show any significant expenditure-based R&D tax relief.
Among the 33 major European countries with available data, the average implied subsidy rate for profitable large firms is 16 percent in 2025. In comparison, the United States only grants a subsidy rate of 7 percent to large profitable firms, while China grants a subsidy rate of 32 percent.
The OECD also provides implied tax subsidy rates for loss-making firms and for small and medium-sized enterprises (SMEs). Most countries covered in today’s map provide the same expenditure-based R&D tax relief to large firms and SMEs. Only France (in the case of loss-making firms), Germany, Iceland, and the Netherlands are relatively more generous to SMEs than to large firms. Croatia offers slightly higher relief to large firms than to SMEs.
Some countries’ R&D tax incentives include refunds and carryover provisions, changing the implied tax subsidy rates for loss-making firms relative to profitable firms. This has resulted in lower average implied tax subsidy rates for loss-making firms relative to profitable firms, both for SMEs and large firms.
While R&D tax incentives can encourage businesses to increase their expenditure on research and development activities, targeting investment in genuine innovation with positive spillovers to the wider economy can be challenging and result in increased administrative and compliance costs to contain fiscal losses and determine qualified expenditures.
Policymakers can often support innovation at a lower revenue cost by improving the general tax treatment of the risky investment that innovative firms undertake by allowing them to fully recover their capital costs and offset their operating losses, rather than providing R&D-specific preferences.
Recent Changes
Several European countries saw their tax subsidies for R&D expenditures increase since 2024. Lithuania and the Slovak Republic raised their corporate rates starting in 2025, thereby increasing the value of their preferential R&D deductions, lifting the implied subsidy rate for large profitable firms from 31 to 34 percent in Lithuania and from 28 to 33 percent in the Slovak Republic. The Netherlands explicitly raised tax credit rates for in-scope R&D, increasing the implied subsidy rate from 31 percent in 2024 to 35 percent in 2025.
On the other side of the Atlantic, the United States scrapped temporary R&D amortization requirements and restored its pre-2022 expensing regime, which—together with its R&D tax credits—raised the implied subsidy rate for large profitable firms from 3 percent to 7 percent.
Stay informed on the tax policies impacting you.
Subscribe to our free newsletter to get the latest tax data, news and analysis.
SubscribeAbout the Author

Alex Mengden is an Economist at the Tax Foundation, where he focuses on international tax issues and tax policy in Europe. He holds a BA in philosophy and economics from the University of Bayreuth and an MSc in economics from the Ludwig Maximilian University of Munich.