States compete with each other in a variety of ways, including attracting (and retaining) residents. When states experience sustained periods of inbound migration, greater economic output and growth can be expected to follow. However, prolonged periods of net outbound migration can put a strain on state coffers, contributing to revenue volatility as economic activity and tax revenue follow individuals out of state.
Each January, United Van Lines, the largest moving company in the United States, compiles and publishes its service data from the previous year, including the number of clients that moved into and out of each of the 48 contiguous states and the District of Columbia. By comparing the number of inbound moves to outbound moves for each state, the National Movers Study provides an early glimpse into the types of interstate migration patterns we can expect to see in government-issued data once it becomes available.
Taxes make more sense with us in your inbox.
Subscribe to our newsletter for tax insights that cut through the noise—and make sense of it.
Sign Up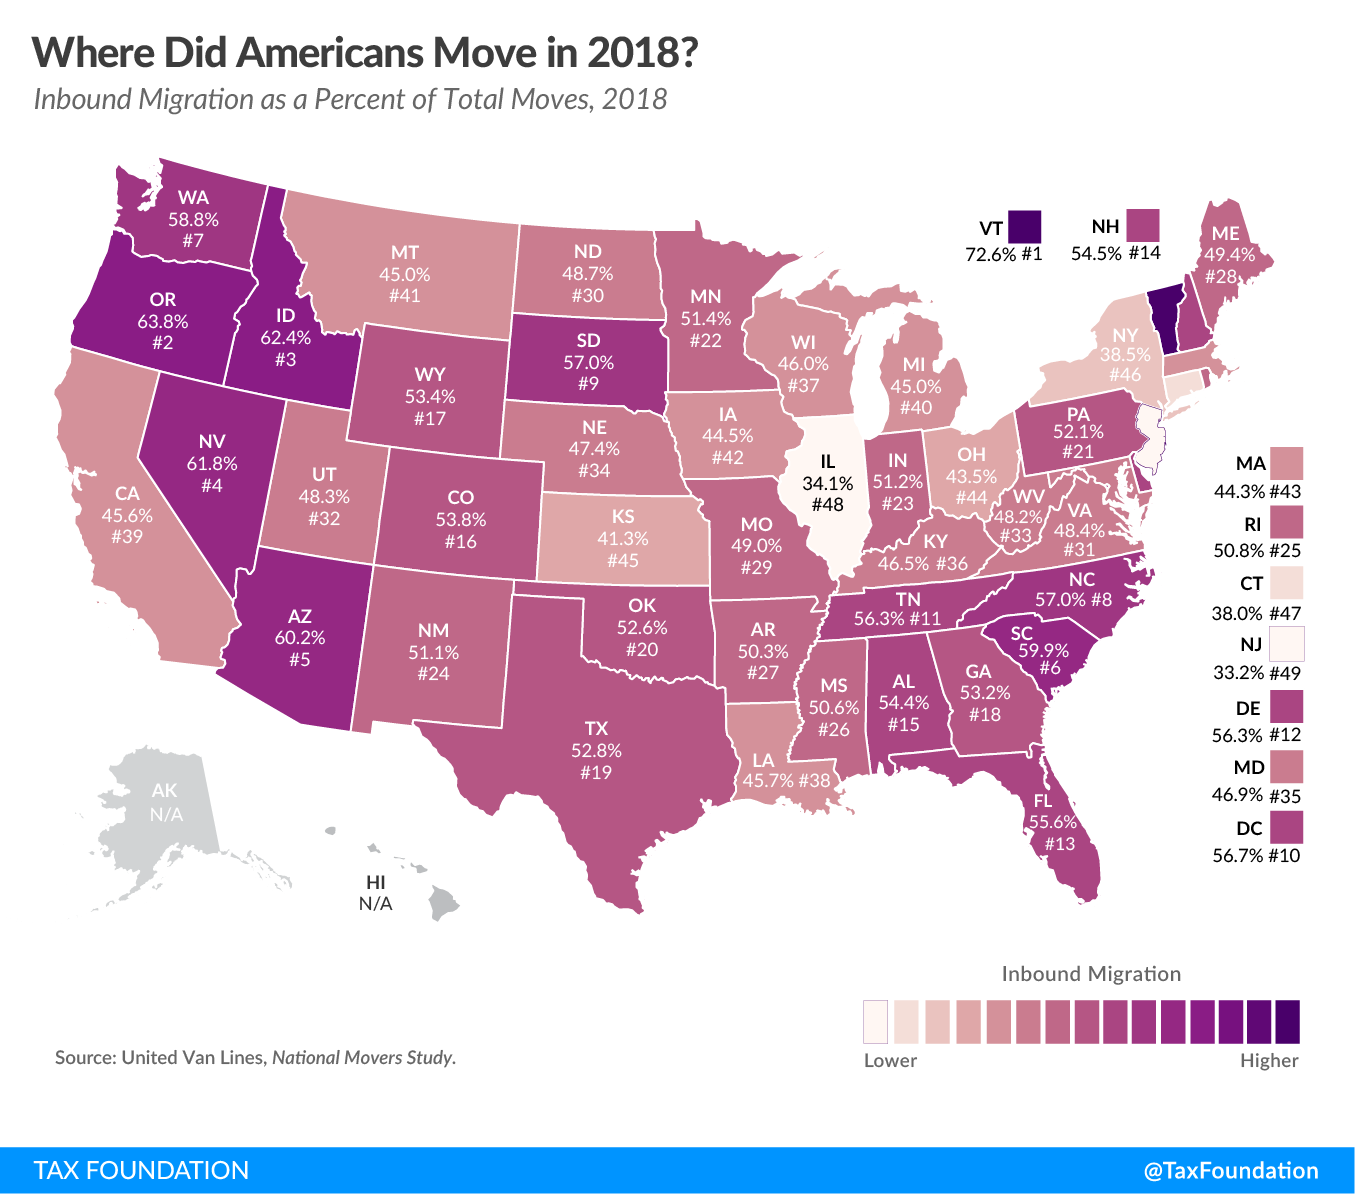
The 2018 National Movers Study shows Vermont, Oregon, Idaho, Nevada, and Arizona as the states with the most inbound migration. Meanwhile, outbound migration was highest in New Jersey, Illinois, Connecticut, New York, and Kansas. In Arkansas, Maine, and Mississippi, inbound and outbound migration were nearly balanced, with roughly the same number of people moving into and out of those states.
For many individuals, job opportunities, family considerations, and lifestyle preferences are among the primary factors driving a decision to move out-of-state, but taxA tax is a mandatory payment or charge collected by local, state, and national governments from individuals or businesses to cover the costs of general government services, goods, and activities. considerations can certainly be a make-it or break-it factor. For example, an undesirable tax landscape could lead an individual to decide that a certain job opportunity is not worth the move. An individual weighing a decision to relocate among one of several states might be inclined to choose a state with a relatively lower tax burden.
This concept is perhaps most visible in smaller states and states with metropolitan centers located near state borders. For example, tens of thousands of individuals work in greater Chicago but live in Indiana, where many interstate commutes are attributable, at least in part, to stark differences in tax landscape. While it is difficult to measure the extent to which tax considerations factor into individuals’ moving decisions, there is no doubt that taxes are important in many individuals’ personal financial deliberations.
While certain factors are outside a state’s control (sunny Florida may always have a certain competitive advantage in attracting retirees, for example), tax policy decisions pose a key area in which states do have significant leverage in fostering an attractive economic landscape.
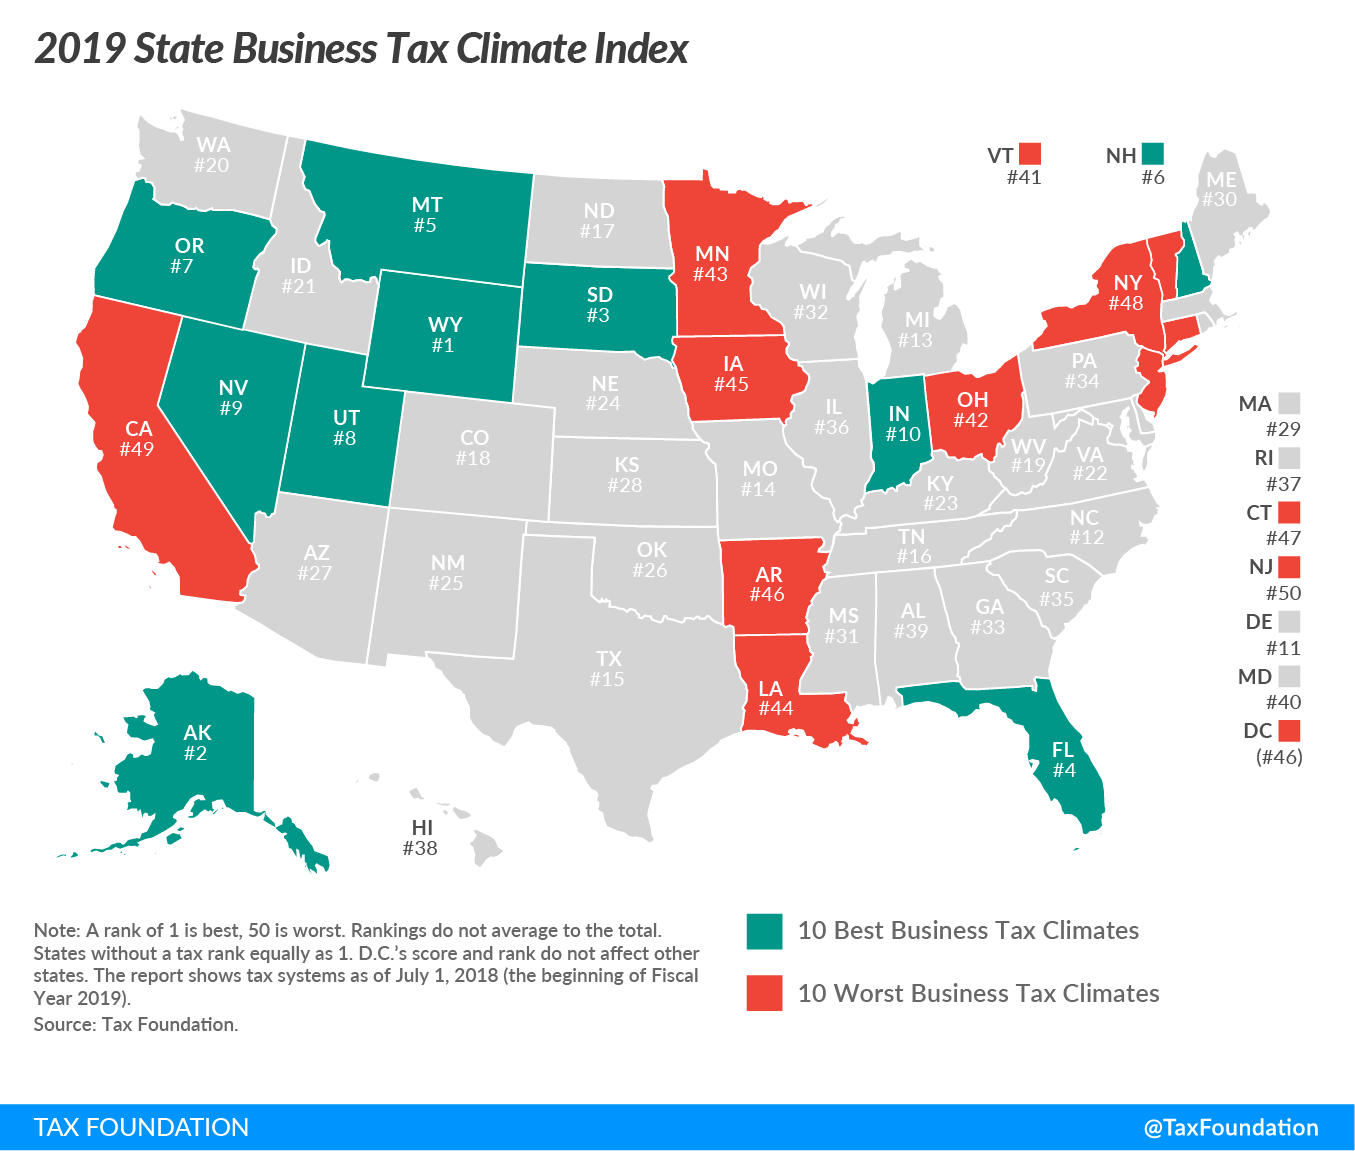
Our State Business Tax Climate Index uses over 100 variables to evaluate states on the competitiveness of their tax rates and structures. Five of the 10 worst-performing states on this year’s Index are also among the 10 states with the most outbound migration in this year’s National Movers Study.
For more information on how your state measures up in terms of tax competitiveness, check out our interactive map or read the full State Business Tax Climate Index here.
Taxes make more sense with us in your inbox.
Subscribe to our newsletter for tax insights that cut through the noise—and make sense of it.
Sign Up