Recent IRS data gives us insights into new capital expenditures made by both individuals and corporations in 2016. In total, the IRS estimates that individuals reported $347.1 billion in capital expenditures and corporations reported nearly $1 trillion of assets placed into service.
An important takeaway from this data is that it sheds light on what share of new business investment was eligible for bonus depreciationBonus depreciation allows firms to deduct a larger portion of certain “short-lived” investments in new or improved technology, equipment, or buildings in the first year. Allowing businesses to write off more investments partially alleviates a bias in the tax code and incentivizes companies to invest more, which, in the long run, raises worker productivity, boosts wages, and creates more jobs. as it existed in 2016, and what share of new investment was excluded from improved cost recoveryCost recovery refers to how the tax system permits businesses to recover the cost of investments through depreciation or amortization. Depreciation and amortization deductions affect taxable income, effective tax rates, and investment decisions.. (In 2016, bonus depreciation was set at 50 percent.) This matters because the income taxA tax is a mandatory payment or charge collected by local, state, and national governments from individuals or businesses to cover the costs of general government services, goods, and activities. is biased against investment in capital assets to the extent that it makes the investor wait years or decades to claim the cost of machines, equipment, or factories on their tax returns.
Of the nearly $1.4 trillion of new investments in 2016, $79.4 billion, or 5.9 percent, was immediately depreciated under the Section 179 schedule. Another $255.7 billion, or 18.9 percent, was eligible for bonus depreciation. The remaining three-fourths of new investments were depreciated over longer schedules:
- $143 billion (10.6 percent) of 39-year property,
- $172.1 billion (12.8 percent) of 27.5-year property,
- $632.4 billion (47 percent) of 20-year or shorter property, and
- $64.2 billion (4.8 percent) of other property.
Pass-Through Business Investment
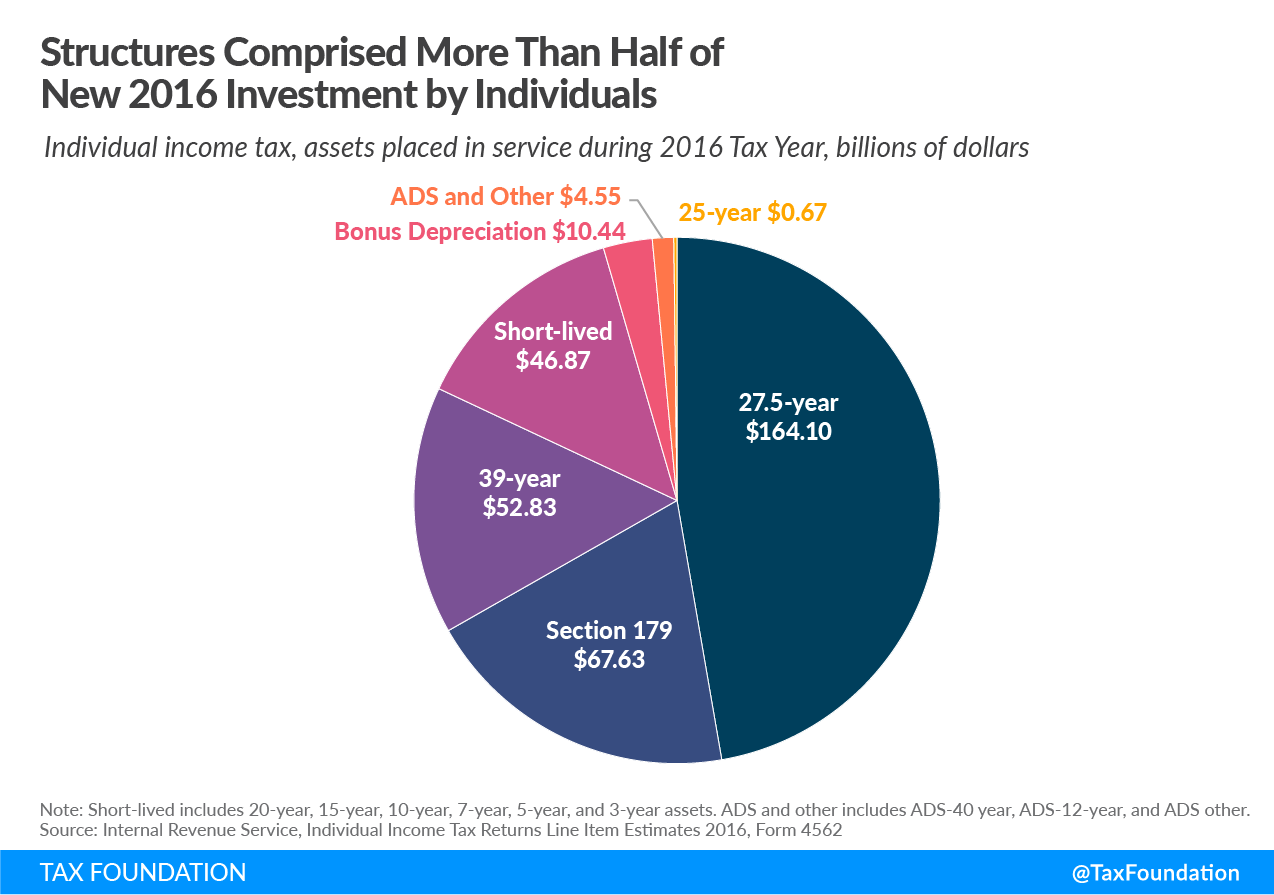
In 2016, approximately 3 percent of assets placed into service by individuals—these estimates include returns from pass-through businesses, such as S corporations and partnerships—was bonus depreciation property, and nearly 20 percent was Section 179 property. The remaining three-fourths of new investments had to be deducted over longer periods. The largest share of new investment by individuals, accounting for $164.1 billion (47 percent of new investment), was residential rental property, which is subject to a 27.5-year depreciationDepreciation is a measurement of the “useful life” of a business asset, such as machinery or a factory, to determine the multiyear period over which the cost of that asset can be deducted from taxable income. Instead of allowing businesses to deduct the cost of investments immediately (i.e., full expensing), depreciation requires deductions to be taken over time, reducing their value and disco schedule.
Corporate Investment
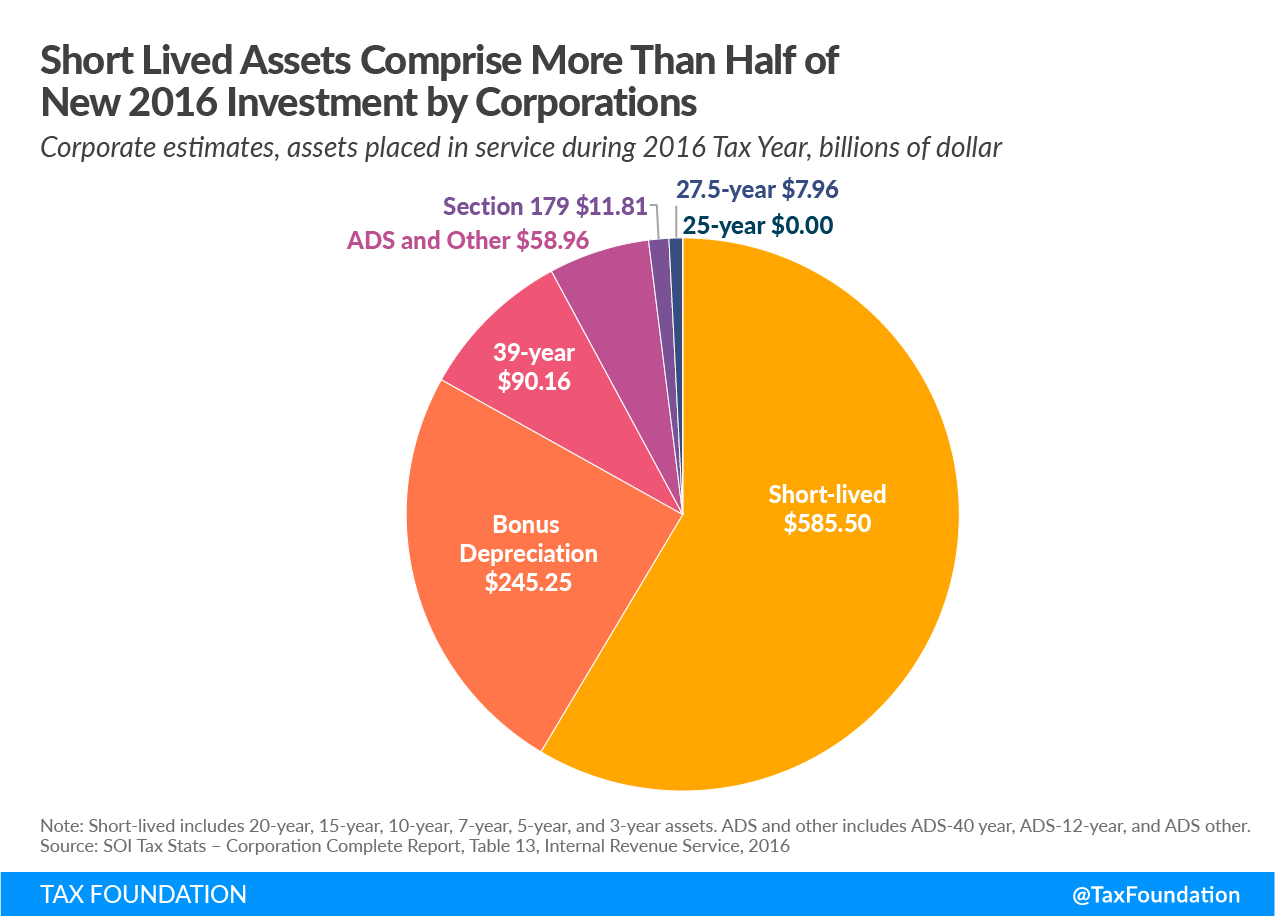
Short-lived assets made up the majority ($585.5 billion or 59 percent) of all assets placed into service by corporations in 2016. Bonus depreciation property was second at 24 percent. Non-residential real property, the 39-year depreciation schedule, was third at 9 percent. Section 179 and residential rental property (27.5-year schedule) each made up a slender 1 percent of new corporate investment.
Discussion
Under 2016 tax law, most investments were not eligible for full cost recovery, but instead depreciated over many years. The Tax Cuts and Jobs Act (TCJA) of 2017 enacted 100 percent bonus depreciation on a temporary basis for short-lived assets and expanded the size of the Section 179 deduction, providing full cost recovery to short-lived investments for a few years, but not improving cost recovery for structures.
As seen in the 2016 data, structures make up a significant portion of new investment. Together, structures amounted to $220.4 billion, or 64 percent, of all individual investment and $101.8 billion, or 10 percent, of all corporate investment. The schedules for structures include the 27.5-year, 39-year, and ADS 40-year. These long depreciation schedules reduce the real value of the deductions, biasing the tax code against these types of investments.
One method of ameliorating this effect is to implement a neutral cost recovery system for the depreciation of structures. Additionally, on a permanent basis, 100 percent bonus expensing has significant pro-growth effects. Ideally, all forms of capital investment would receive full cost recovery through a combination of expensing and neutral cost recovery, removing the tax code’s bias against investment and encouraging greater economic growth.
Appendix
| Depreciation Schedule | Line Number, Form 4562 | Value of New Investment | Percentage of Individual New Investment |
|---|---|---|---|
| Section 179 | 12 | $67,630,770,000.00 | 19.48% |
| Bonus Depreciation | 14 | $10,442,602,000.00 | 3.01% |
| 3-year | 19a | $1,522,510,000.00 | 0.44% |
| 5-year | 19b | $15,542,219,000.00 | 4.48% |
| 7-year | 19c | $17,900,502,000.00 | 5.16% |
| 10-year | 19d | $3,139,439,000.00 | 0.90% |
| 15-year | 19e | $7,003,384,000.00 | 2.02% |
| 20-year | 19f | $1,760,122,000.00 | 0.51% |
| 25-year | 19g | $674,234,000.00 | 0.19% |
| 27.5-year | 19h | $164,102,734,000.00 | 47.28% |
| 39-year | 19i | $52,831,501,000.00 | 15.22% |
| 50-year | Margin | N/A | N/A |
| Other ADS | 20a | $940,533,000.00 | 0.27% |
| ADS 12-year | 20b | $102,297,000.00 | 0.03% |
| ADS 40-year | 20c | $3,503,434,000.00 | 1.01% |
| Total New Investment | $347,096,281,000.00 | ||
|
Source: Internal Revenue Service, “Individual Income Tax Return – Line Item Estimates,” 2016. |
|||
| Depreciation Schedule | Line Number, Form 4562 | Amount of New Investment Subject to Schedule, 2016 | Percentage of New Investment Subject to Schedule, 2016 |
|---|---|---|---|
| Section 179 | 12 | $11,806,729,000.00 | 1.18% |
| Bonus Depreciation | 14 | $245,250,557,000.00 | 24.53% |
| 3-year | 19a | $26,156,104,000.00 | 2.62% |
| 5-year | 19b | $368,739,775,000.00 | 36.89% |
| 7-year | 19c | $113,724,755,000.00 | 11.38% |
| 10-year | 19d | $6,719,710,000.00 | 0.67% |
| 15-year | 19e | $42,421,496,000.00 | 4.24% |
| 20-year | 19f | $27,740,854,000.00 | 2.78% |
| 25-year | 19g | N/A | N/A |
| 27.5-year | 19h | $7,962,904,000.00 | 0.80% |
| 39-year | 19i | $90,162,804,000.00 | 9.02% |
| 50-year | Margin | N/A | N/A |
| Other ADS | 20a | $48,834,733,000.00 | 4.89% |
| ADS 12-year | 20b | $6,405,965,000.00 | 0.64% |
| ADS 40-year | 20c | $3,720,401,000.00 | 0.37% |
| TOTAL New Investment | $999,646,787,000.00 | ||
|
Source: Internal Revenue Service, “SOI Tax Stats – Corporation Complete Report, Table 13,” 2016. |
|||
Stay informed on the tax policies impacting you.
Subscribe to our free newsletter to get the latest tax data, news and analysis.
Subscribe