What You’ll Learn
- Learn about the different taxA tax is a mandatory payment or charge collected by local, state, and national governments from individuals or businesses to cover the costs of general government services, goods, and activities. types governments rely on to fund priorities like infrastructure, national defense, and social insurance programs and the share of total revenue each tax type generates.
- See how the U.S. federal government raises revenue, as well as state and local governments, and compare taxes in the U.S. to those around the world.
- Learn about the central role businesses play in the tax collection process.
Introduction
Have you ever wondered where the money comes from to build roads, maintain a national defense, or pay for programs like Social Security? Taxes.
Businesses, like your local convenience store, cover the cost of expenses like employee salaries and rent from the profits generated by selling products. Governments don’t sell products and don’t have profits so the only way they can cover the cost of their services is by asking us to pay taxes on the money we earn, the things we buy, and the property we own.
Different states and countries rely on different combinations of taxes to pay for government services depending on their unique economic situations and policy goals. Some principles, however, are true across the board.
A good rule of thumb is that the most efficient way to raise revenue is by placing a low tax on a broad, stable tax baseThe tax base is the total amount of income, property, assets, consumption, transactions, or other economic activity subject to taxation by a tax authority. A narrow tax base is non-neutral and inefficient. A broad tax base reduces tax administration costs and allows more revenue to be raised at lower rates. . In other words, taxes should apply to a wide range of economic activity with few exceptions.
However, different types of taxes impact people, businesses, and the economy differently. As we’ll see below, most economists also agree that taxes on income create more economic harm than taxes on consumption and property.
Sources of Government Revenue in the United States
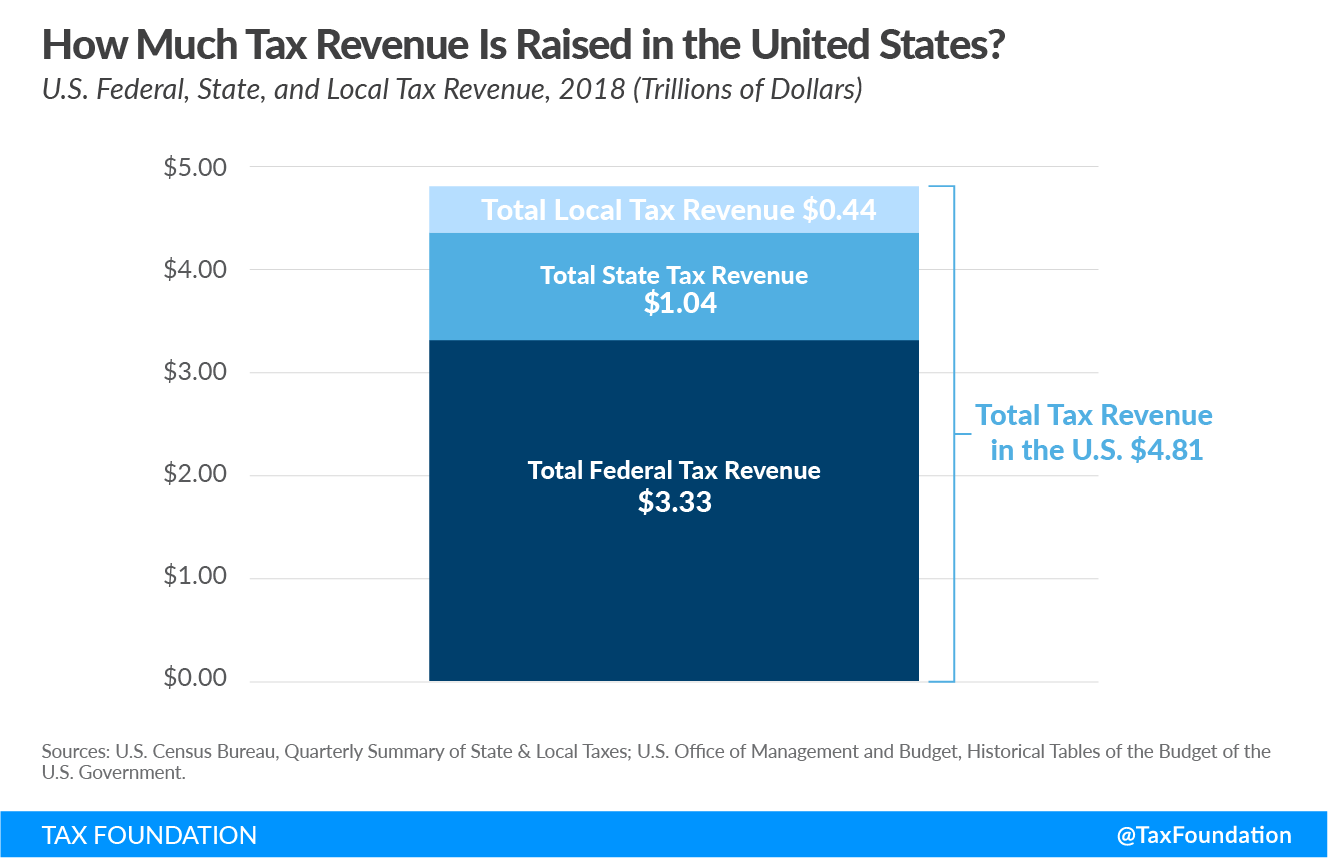
How Much Tax Revenue is Raised in the U.S.?
The U.S. federal government collected $3.33 trillion in total tax revenue in 2018. Meanwhile, state governments collected a total of $1.04 trillion and local governments collected $0.44 trillion. Altogether, that means $4.81 trillion in tax revenues was collected in the U.S in 2018.
How much revenue governments raise is important, but it’s also crucial to ask how they do so.
As you’ll see below, the federal government raises revenue differently than the states, and state and local governments all raise revenue differently as well.
You might ask why it’s all so complicated—can’t every level of government just raise revenue the same way? But remember: no two governments are the same. They all have different economies, different constituents, and different priorities, so it makes sense that their taxes are different too.
Federal Revenue
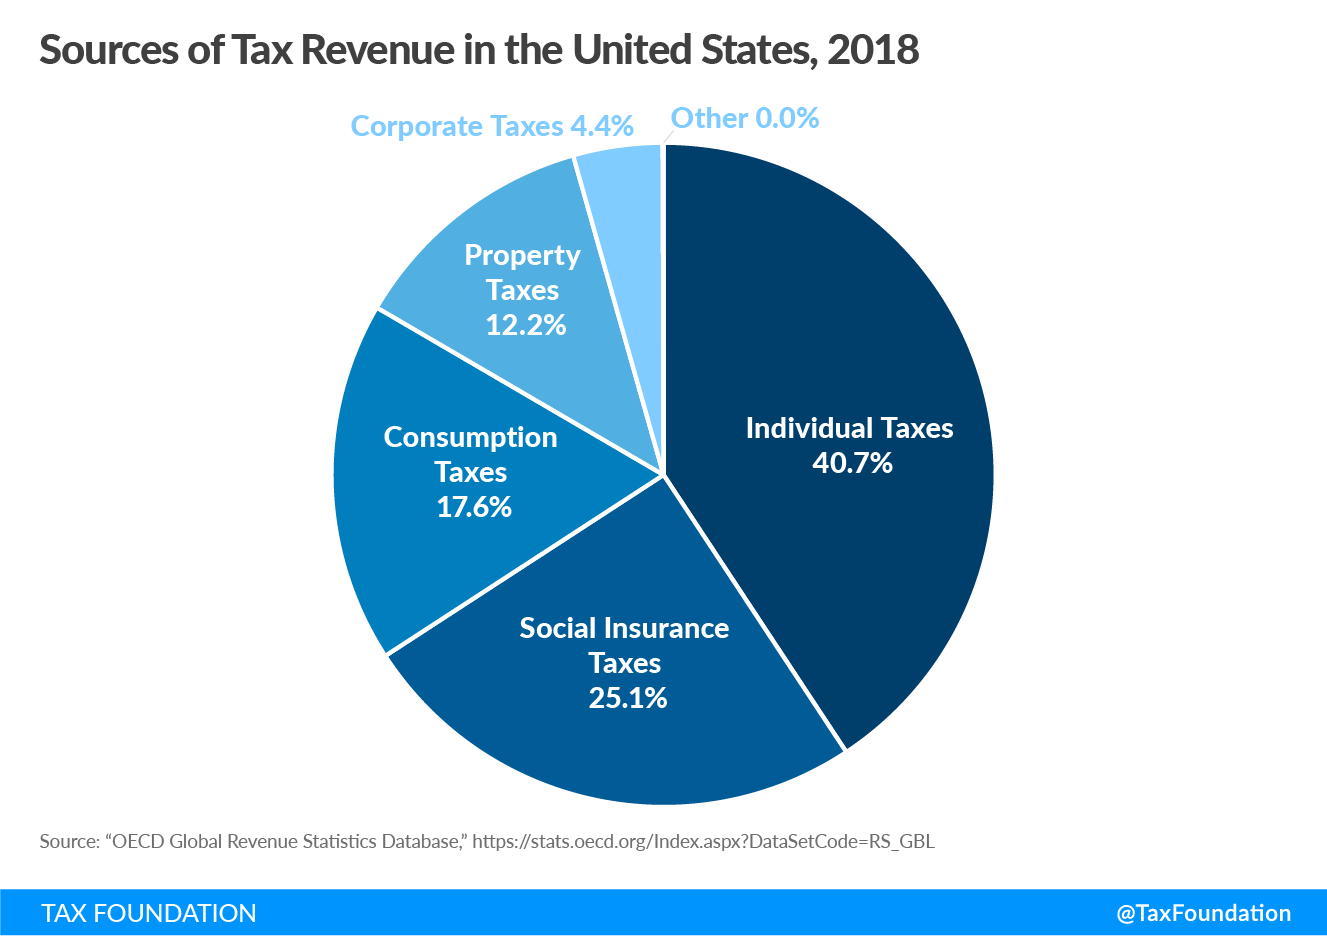
In the United States, individual income taxes are the primary source of tax revenue when looking at all local, state, and federal tax collections combined.
Social insurance taxes like payroll taxes make up the second-largest share of revenue, followed by consumption taxes, property taxes, and corporate income taxes.
State and Local Tax Revenue
The exact mix of taxes used to raise revenue among U.S. states and localities varies greatly, though the majority of revenue comes from four primary sources: property taxes, sales taxes, individual income taxes, and corporate income taxes.
Other taxes used to raise state and local revenue include excise taxes, such as those on alcohol, tobacco, or motor fuel; estate taxes; and severance taxes, which are imposed on the extraction of non-renewable natural resources, such as crude oil.
As you can see in the table below, some states forgo major tax types, such as Florida, which collects no individual income taxAn individual income tax (or personal income tax) is levied on the wages, salaries, investments, or other forms of income an individual or household earns. The U.S. imposes a progressive income tax where rates increase with income. The Federal Income Tax was established in 1913 with the ratification of the 16th Amendment. Though barely 100 years old, individual income taxes are the largest source of tax revenue in the U.S. , or New Hampshire, which collects no sales taxA sales tax is levied on retail sales of goods and services and, ideally, should apply to all final consumption with few exemptions. Many governments exempt goods like groceries; base broadening, such as including groceries, could keep rates lower. A sales tax should exempt business-to-business transactions which, when taxed, cause tax pyramiding. .
Given the proximity of states, the decision whether to impose certain taxes and the level at which those taxes are imposed can have significant effects on where businesses and individuals choose to locate.
| State | Property Tax | Sales and Gross Receipts Taxes | Individual Income Tax | Corporate Income Tax | Other Taxes |
|---|---|---|---|---|---|
| U.S. | 32.2% | 23.8% | 22.8% | 3.3% | 17.9% |
| Alabama | 16.8% | 30.8% | 23.4% | 4.0% | 25.0% |
| Alaska | 50.3% | 7.4% | 0.0% | 4.9% | 37.4% |
| Arizona | 29.2% | 42.1% | 15.3% | 1.8% | 11.7% |
| Arkansas | 18.4% | 38.5% | 22.3% | 3.6% | 17.2% |
| California | 27.9% | 21.4% | 30.5% | 3.6% | 16.6% |
| Colorado | 34.5% | 26.7% | 23.0% | 2.1% | 13.7% |
| Connecticut | 39.0% | 15.1% | 26.9% | 6.8% | 12.3% |
| Delaware | 17.9% | 0.0% | 30.0% | 4.3% | 47.7% |
| Florida | 38.1% | 35.2% | 0.0% | 2.8% | 23.9% |
| Georgia | 32.8% | 24.0% | 26.8% | 2.3% | 14.2% |
| Hawaii | 20.8% | 37.0% | 21.7% | 0.4% | 20.1% |
| Idaho | 27.8% | 28.2% | 25.4% | 3.3% | 15.4% |
| Illinois | 35.4% | 18.2% | 21.9% | 4.3% | 20.2% |
| Indiana | 24.3% | 25.8% | 30.0% | 2.4% | 17.5% |
| Iowa | 33.2% | 22.9% | 23.5% | 3.6% | 16.8% |
| Kansas | 32.9% | 29.0% | 22.1% | 2.8% | 13.2% |
| Kentucky | 21.0% | 21.5% | 33.0% | 4.1% | 20.4% |
| Louisiana | 20.7% | 39.2% | 19.1% | 2.2% | 18.8% |
| Maine | 44.6% | 19.1% | 21.1% | 2.5% | 12.8% |
| Maryland | 25.6% | 11.7% | 40.5% | 3.2% | 19.0% |
| Massachusetts | 36.3% | 13.4% | 34.1% | 5.0% | 11.2% |
| Michigan | 37.4% | 21.5% | 22.4% | 1.9% | 16.9% |
| Minnesota | 27.3% | 18.2% | 29.4% | 4.3% | 20.7% |
| Mississippi | 29.4% | 32.4% | 15.9% | 3.6% | 18.7% |
| Missouri | 28.1% | 29.3% | 25.9% | 1.9% | 14.8% |
| Montana | 40.4% | 0.0% | 27.6% | 3.8% | 28.2% |
| Nebraska | 36.9% | 23.4% | 22.1% | 3.5% | 14.1% |
| Nevada | 24.0% | 42.1% | 0.0% | 0.0% | 33.9% |
| New Hampshire | 64.0% | 0.0% | 1.7% | 11.0% | 23.2% |
| New Jersey | 45.3% | 15.7% | 21.9% | 5.1% | 12.0% |
| New Mexico | 18.0% | 43.0% | 11.6% | 0.9% | 26.5% |
| New York | 31.4% | 16.9% | 33.9% | 5.6% | 12.2% |
| North Carolina | 25.7% | 27.0% | 28.4% | 1.5% | 17.4% |
| North Dakota | 20.4% | 23.0% | 6.4% | 1.4% | 48.9% |
| Ohio | 30.0% | 26.6% | 25.0% | 0.5% | 17.9% |
| Oklahoma | 21.2% | 33.2% | 20.4% | 1.8% | 23.4% |
| Oregon | 33.3% | 0.0% | 39.1% | 4.5% | 23.1% |
| Pennsylvania | 29.6% | 17.5% | 25.4% | 4.3% | 23.2% |
| Rhode Island | 42.7% | 18.4% | 19.8% | 3.4% | 15.7% |
| South Carolina | 32.4% | 22.1% | 24.5% | 2.4% | 18.6% |
| South Dakota | 36.0% | 40.0% | 0.0% | 0.9% | 23.0% |
| Tennessee | 22.7% | 45.9% | 0.2% | 5.8% | 25.3% |
| Texas | 46.7% | 34.2% | 0.0% | 0.0% | 19.0% |
| Utah | 27.1% | 30.2% | 25.5% | 2.5% | 14.8% |
| Vermont | 44.3% | 10.8% | 18.4% | 3.4% | 23.0% |
| Virginia | 32.7% | 14.9% | 31.0% | 2.8% | 18.5% |
| Washington | 28.1% | 47.1% | 0.0% | 0.0% | 24.9% |
| West Virginia | 23.4% | 19.0% | 25.4% | 2.0% | 30.2% |
| Wisconsin | 32.6% | 20.3% | 27.4% | 4.6% | 15.0% |
| Wyoming | 40.4% | 27.4% | 0.0% | 0.0% | 32.2% |
| Washington, D.C. | 35.1% | 14.8% | 28.5% | 8.7% | 12.8% |
|
Note: Percentages may not add to 100 due to rounding. “Other taxes” includes selective sales taxes (excise taxes), motor vehicle license taxes and fees, business license taxes, inheritance and estate taxes, recordation fees, and transfer taxes, among others. While most states’ gross receipts taxes are reported in Census’s “general sales” tax category, Delaware’s GRT revenue is categorized as “other selective sales” tax revenue and included in our “Other Taxes” category. Oregon’s Corporate Activity Tax (CAT), a gross receipts tax, took effect January 1, 2020. CAT revenue is sent to the Fund for Student Success rather than the General Fund. FY 2020 included six months of CAT collections, but CAT collections do not appear to show up in the FY 2020 Census data for “general revenue from own sources.” Source: Census Bureau; Tax Foundation calculations. |
|||||
How Does the U.S. Compare to the Rest of the World?
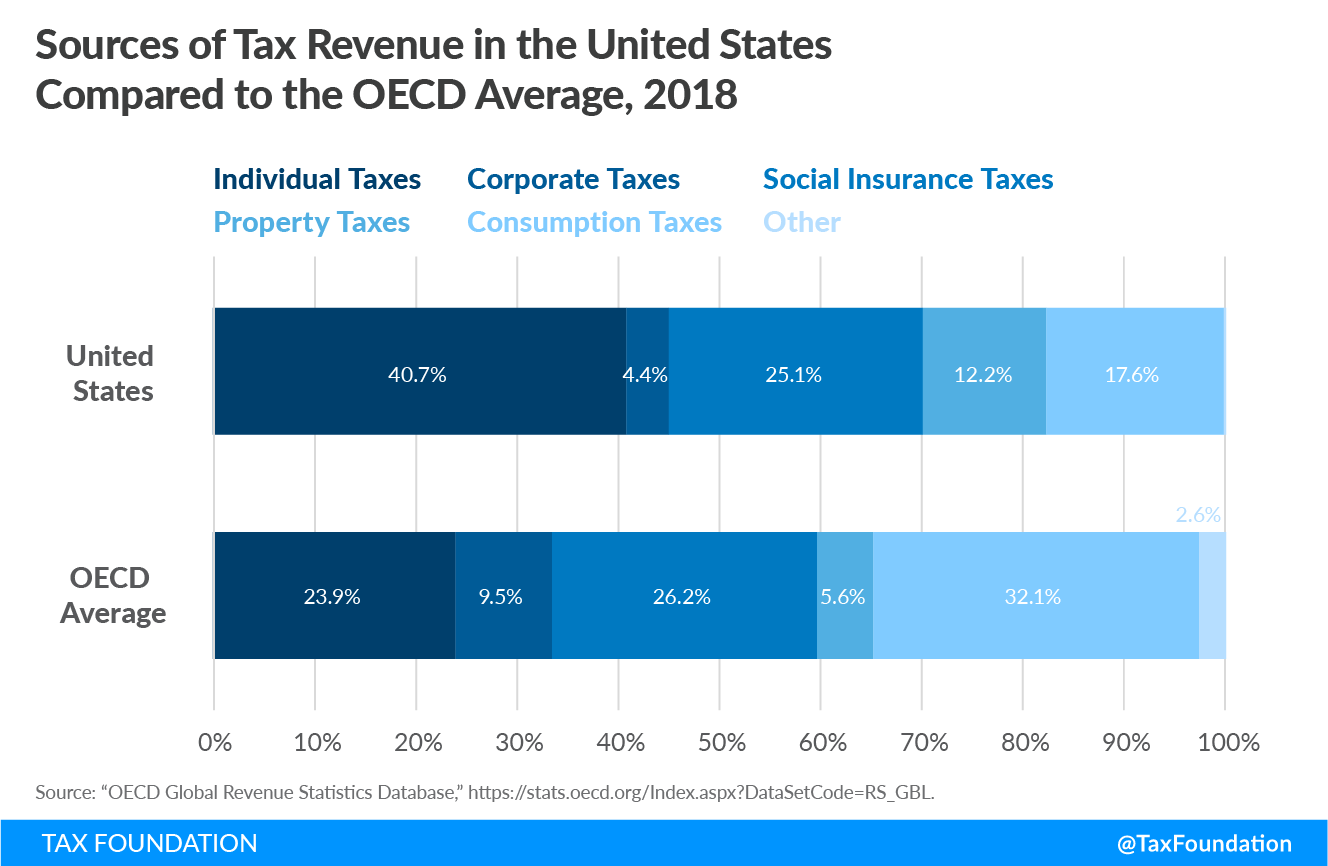
In many ways, the United States is unique in the way it raises revenue. One important difference is that it relies significantly more on individual income taxes compared to other countries in the Organisation for Economic Co-operation and Development (OECD), a group of 36 countries with advanced economies.
The United States also relies much less on consumption taxes. This is because all OECD countries except the United States levy a value-added tax (VAT) at a relatively high rate. State and local sales tax rates in the United States are low by comparison.
In fact, OECD countries raise about one-third of their total tax revenue with consumption taxes such as the VAT, making consumption taxes the largest revenue source on average.
Social insurance taxes followed by individual income taxes are the second and third most important sources of tax revenue in the OECD. Countries collect very little from corporate income taxes and property taxes on average.
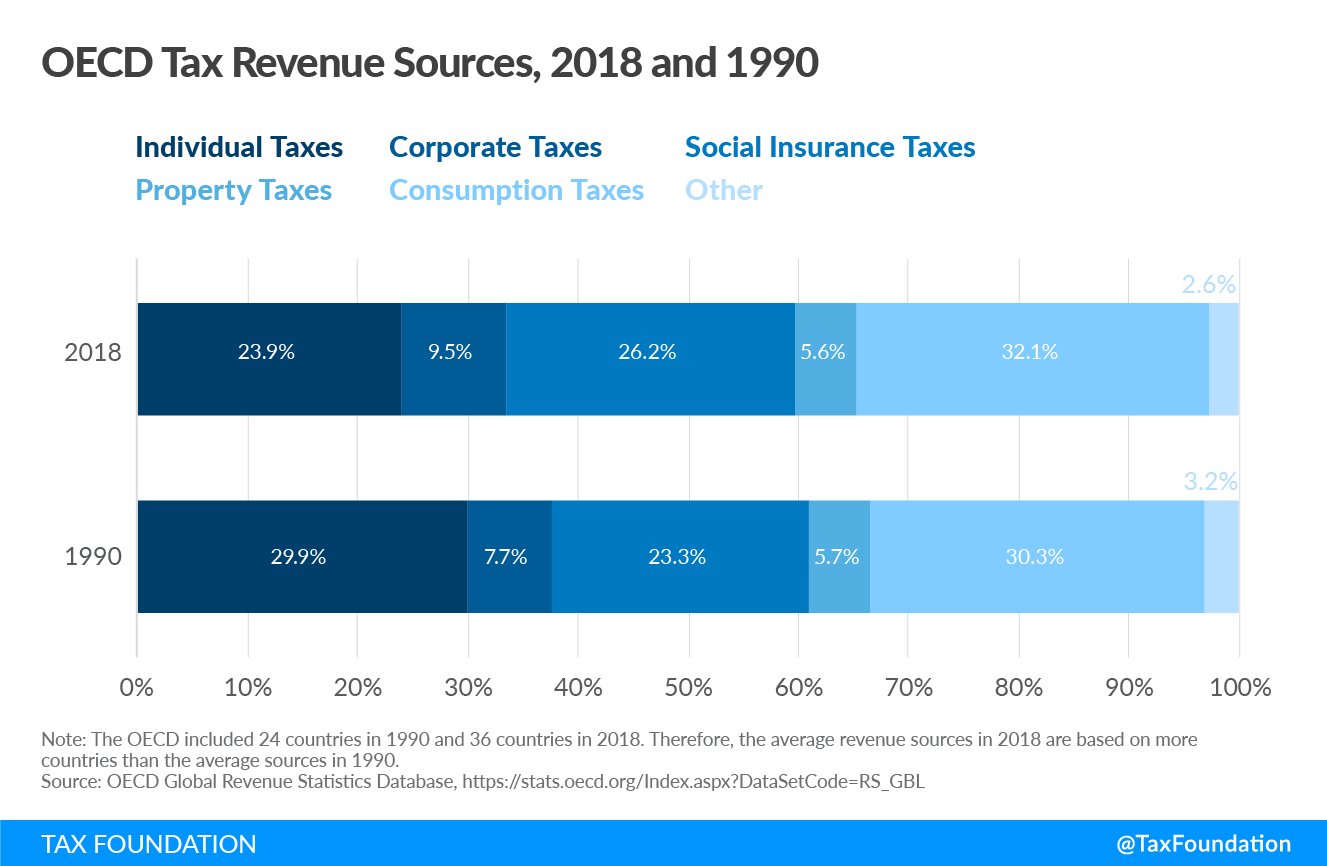
Since 1990, there has been a noticeable shift among OECD countries away from individual income taxes and towards social insurance and consumption taxes. Revenue from corporate income taxes has also increased slightly.
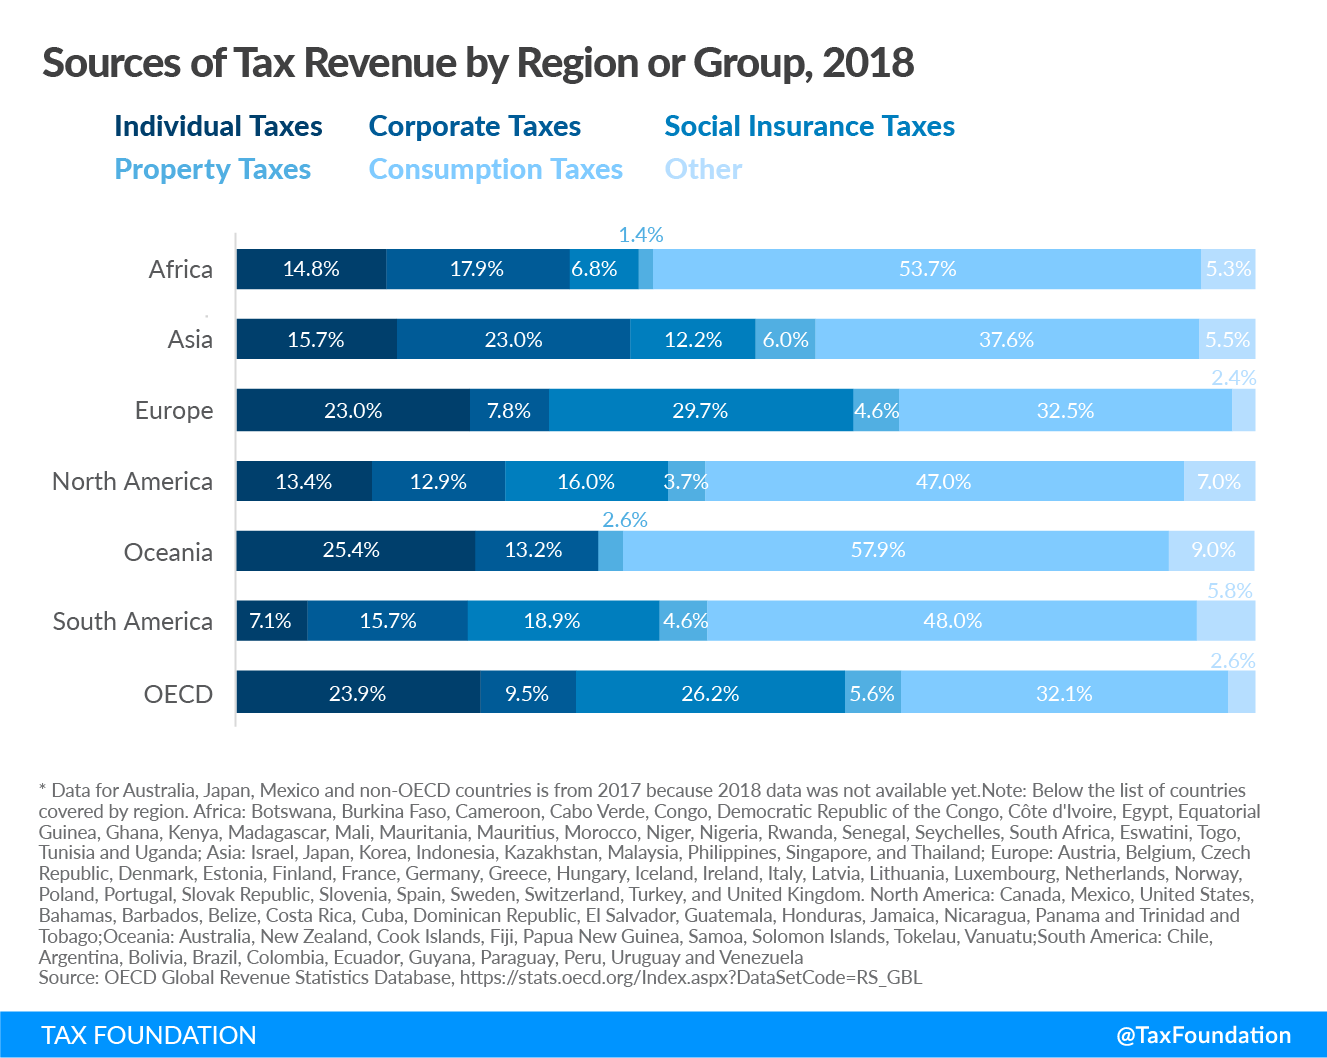
When looking at sources of tax revenue by region, including non-OECD countries, there is great variation reflective of economic and social differences across regions.
Businesses: Government’s Biggest Tax Collector
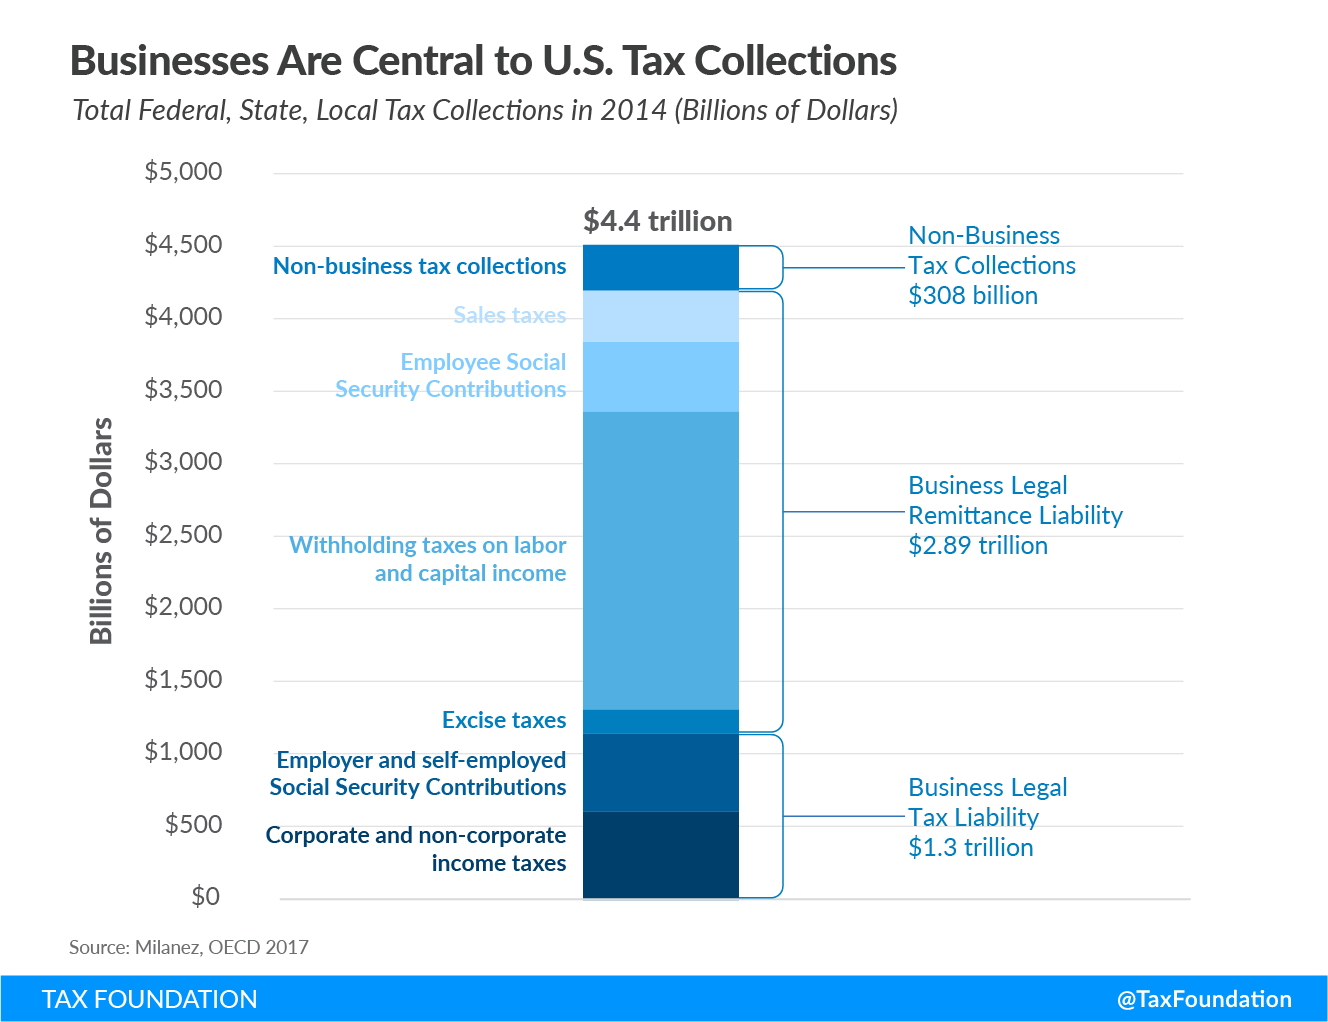
When people think about paying their taxes, they likely think of the Internal Revenue Service (IRS). But the days of the tax collector going door-to-door to fill the government coffers are long gone. In fact, the primary collectors of taxes, and certainly payers of taxes, are businesses.
Businesses are absolutely essential to the tax collection process. You would literally need millions of federal, state, and local tax agents to do what businesses do for governments every day.
In addition to the numerous taxes they pay—such as income taxes and property taxes—businesses collect taxes for the government in three main ways:
- WithholdingWithholding is the income an employer takes out of an employee’s paycheck and remits to the federal, state, and/or local government. It is calculated based on the amount of income earned, the taxpayer’s filing status, the number of allowances claimed, and any additional amount of the employee requests. taxes on labor and capital income—this is what comes out of your paycheck if you’re a salaried employee
- Remitting the employee-share of social insurance taxes—what you contribute to fund safety-net programs like Social Security in the United Sates
- Sales and value-added taxes (VATs)—the taxes you see on a receipt after purchasing a good or service
The U.S. is one of the most “business dependent” tax systems in the industrialized world. In 2014, U.S. businesses paid about 29 percent of all taxes collected in the country and remitted another 64 percent—adding up to 93 percent of all taxes collected in America that year.

