Key Findings
- Obesity is a complex, global problem, contributing to preventable disease and creating unnecessary health-care costs.
- Many countries have turned to sugar-sweetened beverages taxes to discourage their consumption, both to try to address growing obesity rates and generate revenue.
- TaxA tax is a mandatory payment or charge collected by local, state, and national governments from individuals or businesses to cover the costs of general government services, goods, and activities. designs vary significantly, with some design choices likely undermining health outcomes by enabling substitution of nontaxed high-sugar products.
- Design choices that optimize health outcomes are different than those that maximize revenue, and the regressivity inherent to these taxes raise concerns over revenue generation efforts.
- While taxes on sugary drinks do seem to increase their prices, there is no evidence for significant improvement in health outcomes as a result of higher sugary drink prices.
- Examples from several European countries show that the reformulation of soft drinks to have less sugar may be accelerated by these taxes, but that overall sugar consumption is often unaffected.
- A tax on sugary drinks is likely too narrow to significantly decrease sugar consumption, and lowering sugar consumption alone is likely insufficient to effectively yield positive health outcomes.
Introduction
Obesity is a leading contributor to preventable diseases and rising health-care costs worldwide. Obesity reduction and prevention have thus become global public health objectives. One proposed public policy strategy to combat increasing obesity rates is to implement excise taxes on sugar-sweetened beverages (SSBs). These are generally defined as soft drinks, juice-based drinks, or milk-based drinks that are sweetened with added sugar, natural sugar, or sometimes no- and low-calorie sweeteners sweeteners meant to replicate sugar. Many countries narrow the scope of their excise taxes to only one subset of SSBs, like soft drinks.
SSB taxes are primarily implemented to reduce sugar intake through lower beverage consumption—and, by extension, overall caloric intake—while serving as a revenue-generating tool for public coffers. Unfortunately for SSB policy advocates, academic research on the impact of SSB taxes raises questions about their effectiveness in significantly reducing obesity rates or improving public health in a meaningful way.
According to the World Bank, 117 countries have adopted some form of sugary drink tax.[1] Varied tax structures have been used, including both specific excise taxes and ad valorem structures, and these taxes range from a narrow base of only select beverages to a much broader base of all liquid beverages. While most SSB taxes are applied at the national level, select cities in the United States and Catalonia in Spain have applied local taxes. These taxes have given researchers a wide series of data to build a young, but robust, academic literature of empirical findings.
As a revenue raising tool, the tax baseThe tax base is the total amount of income, property, assets, consumption, transactions, or other economic activity subject to taxation by a tax authority. A narrow tax base is non-neutral and inefficient. A broad tax base reduces tax administration costs and allows more revenue to be raised at lower rates. for SSBs is extremely narrow, creating a volatile and unstable revenue stream. Revenues tend to be unreliable as sales numbers fluctuate, and if the tax is successful in directing consumers away from the taxed products the tax revenues will dwindle over time. This narrow scope also leads to nonneutrality, as consumers can often substitute taxed beverages with untaxed alternatives. Such substitution undermines the intended health benefits by allowing individuals to avoid the tax while diminishing overall consumer welfare and failing to achieve reductions in caloric intake.
Additionally, SSB taxes are highly regressive. Lower-income households spend a greater share of their disposable income on sugary drinks, bearing a disproportionate burden of the tax.
Perhaps the biggest issue with SSBs is that these targeted taxes fail to achieve their public health goals. In the following section, we detail the public policy pathology required for an SSB tax to achieve a public health improvement goal. In short, an SSB tax would need to increase the market price of SSBs, reducing consumer purchases of SSBs; consumers would then need to substitute their previous SSB consumption with a healthier alternative, presumably one with fewer calories; and the behavioral choices following the consumption substitution would need to result in a net overall benefit to public health.
The flow of good intentioned policy to public health outcome has some major kinks. The overall academic near-consensus is that SSB taxes show no improvement to public health. After discussing the public policy pathology in the next section, we summarize more of the academic work on SSB taxes.
We then turn our attention to several case studies across Europe. We explore SSB taxes and their effects in France, the United Kingdom, the Netherlands, Ireland, Portugal, Poland, and Romania. The results from these European experiments largely mirror the results from the United States and other countries around the world.
Soda TaxA soda tax, often discussed under a broader policy category of a sugar-sweetened beverage tax, is an excise tax on sugary drinks. Most soda taxes apply a flat rate tax per ounce of a sugar-sweetened beverage, though some jurisdictions levy an ad valorem tax based on the beverage’s price. Design
The textbook principles for sound excise taxAn excise tax is a tax imposed on a specific good or activity. Excise taxes are commonly levied on cigarettes, alcoholic beverages, soda, gasoline, insurance premiums, amusement activities, and betting, and typically make up a relatively small and volatile portion of state and local and, to a lesser extent, federal tax collections. design are rather straightforward. Applying those principles in the real world is often much more challenging.
For market efficiency purposes, products that create external harms can be taxed in proportion to the amount of harm the product creates to incentivize market participants to account for those harms in their decision-making and move market output to a more efficient level. If a liter of beverage caused €1 of external harms, €1 tax to each liter would decrease the market quantity to an optimal, lesser amount.
Sugary beverage consumption doesn’t create typical external harms, though. Consumption of other products that receive excise taxes can create direct external harms to others. Cigarettes produce secondhand smoke and impaired decision-making related to alcohol consumption causes deaths every year.
Instead, sugary beverages are, in theory, linked to governalities. Governalities occur when government-operated or subsidized programs, such as health care, are affected by a product or activity. Products that increase obesity will cause government spending on obesity-related health issues to increase, thus impacting the overall effectiveness of the government-operated and subsidized health-care system. The cases for using excise taxes to address governalities are much weaker than the case for taxing products that negatively affect market outcomes.
Further, the textbook solution of addressing external harms with taxes assumes knowledge of the exact amount of external costs caused by a product. There is no current consensus of the external costs associated with sugary beverage consumption, but it is clear that sugary beverages alone are far from the only or even leading driver of obesity and associated health-care costs. Even for products where there is a general consensus that a social cost exists, estimates of the precise magnitude of those costs often vary widely. Converting textbook conceptualizing into real-world tax policies is challenging and requires many more questions to be answered.
Tax Base
What will be taxed? While the name of the tax—a sugar-sweetened beverage tax—may make this answer seem obvious, there are nuances in SSB tax bases and legitimate questions about whether an SSB tax base is the best tax base for the desired policy outcome of better public health.
Excise taxes generally follow either a user-fee model or a system designed to reduce the use or consumption of something that causes harm (to third parties). User-fee excise taxes charge individuals for their use of a good or service, usually one that is provided with the use of taxpayer funds. Fuel excise taxes and road charges are a great example of user fees.
Harm reduction excise taxes often target harm-causing elements to best allow market participants to “internalizes the externalityAn externality, in economic terms, is a side effect or consequence of an activity that is not reflected in the cost of that activity, and not primarily borne by those directly involved in said activity. Externalities can be caused by either the production or consumption of a good or service and can be positive or negative. ” or incorporate any external effects into their decision-making. A tax placed on carbon emissions, for example, can price-in external damages from pollution and climate change into energy consumption and production decisions.
SSB taxes are difficult to justify with traditional economic justifications. The contents of a sweet beverage are not inherently harmful. Humans need calories. An overindulgence of calories can lead to obesity, of course, but following that line of reasoning would suggest that calories—not quantity of sugary beverages—should be the target of the tax base.
Similar arguments align for a broader tax base compared to a narrow base. A tax base on only soda, for example, would easily facilitate consumers substituting to similar-calorie products that simply aren’t soda. Products like diet sodas, fruit juices, and dairy products add complexity to the idea of simply taxing sugary beverages.
Rates, Regressivity, and Revenues
A principle-based tax rate should be determined by several factors, first being the negative external costs the tax is serving to internalize or recoup. As mentioned, however, precise individual-specific estimates of social costs are difficult. Even estimates of average social costs of total consumption of a product can be difficult to quantify. For sugar-sweetened beverages, a commonly linked cost is the amount that countries spend annually on health-care issues related to obesity, but sugary beverage consumption is far from being the sole contributor to societal obesity and health expenditures.
Soft drinks are not the only source of dietary or added sugar, and sugary snacks may contribute more to obesity than sugary drinks.[2] Sugar is also not the only nutrient associated with weight gain or other health problems, with intake of fats, salts, and others also being a factor in health outcomes. A healthy diet tends to be balanced, so exclusive focus on any one nutrient may not yield positive outcomes for a population’s health. Equally important as dietary factors might be physical activity, exercise, and other lifestyle choices that also heavily influence both weight and overall health.
Other considerations that accompany setting excise tax rates are available economic substitutes and the general tax burden. Considering economic substitutes is important because a tax that is too narrow will not be neutral and simple consumer substitution may negate intended benefits from a tax. If SSB taxes are narrowly applied only to beverages, for example, consumers will substitute elsewhere and might not decrease their overall caloric consumption.
Tax rates will affect the overall tax burden citizens endure. Excise taxes are typically imposed in addition to value-added taxes (VATs), individual and corporate income taxes, property taxes, and other kinds of taxes. Because of the narrow base, excise taxes make poor tools for funding broad government expenditures. Even where an excise tax is economically rationalized, excessive taxes on businesses can impair economic growth, job creation, and wages. Such a narrow excise tax also creates particularly nonneutral burdens on businesses, with some beverage manufacturers being artificially advantaged relative to others or food manufacturers being artificially advantaged relative to drink manufacturers in the case of beverage taxes.
Excise taxes tend to be regressive because the tax comprises a larger percentage of lower-income households’ budgets than higher-income households’ budgets. Regressive taxes disproportionally impact the poor.
Simply because a tax is regressive, however, doesn’t mean it shouldn’t be used. Most consumption taxes are regressive, but they still have a role in a broader system of tax and transfers that is almost invariably highly progressive. User-pay systems and internalizing externalities are positive motivations for excise tax policy. However, the disproportionate effect of regressive taxes on the poor is reason to limit the application of excise taxes to those uses. Excise taxes should not be a tool for revenue maximization or used as a method to fund general government expenses.
SSB Tax Design in Practice
For practical tax policy, SSB taxes should follow general tax principles of simplicity, transparency, neutrality, and stability. Tax policies that are simple, transparent, neutral, and stable are easier to understand for taxpayers and governments. They are not wildly distortive, and they provide consistent, predictable, and equitable sources of revenue to fund public expenditures over time.
For simplicity, any SSB taxes should ideally be levied early in the value chain because this generally results in a smaller number of taxpayers. Limiting the number of taxpayers reduces the cost of enforcement and lowers the barriers to tax compliance, making the tax relatively efficient. This is easiest for excise taxes that are levied at a specific rate (e.g., €0.001 per g of added sugar per mL). The tax bill can be applied based on quantity and remitted by the limited number of manufacturers, as opposed to needing to be remitted by every consumer or every point-of-sale vendor.
A broader tax on all sugar for consumption or total kilocalorie content would also be best levied early in the value chain, which may have slightly more total taxpayers but would avoid complexity involved with determining which beverages are included in a narrower SSB tax base. For sugar specifically, the tax could also be levied even earlier by taxing the producers of the sugar rather than manufacturers of sugary products.
Specific taxes tend to be more transparent than ad valorem taxes that are based on product prices. As such, specific taxes are likely a better choice for SSB taxes than are ad valorem taxes. A specific tax could be levied per unit of added sugar per mL of beverage, per unit of sugar in a product meant for consumption, or per unit of sugar grown or produced.
Stability is also important. Stable taxes help minimize compliance and tax administration costs and encourage producers to invest in longer-term innovations. In SSB taxes, a key goal for facilitating a decline in sugar consumption is a reformulation of beverages to contain less sugar. This kind of product innovation and design change takes time and is more likely to be implemented if policies are stable, giving producers time to develop new products to market. A narrow SSB tax base on only beverages, or even a subset of beverages, would limit any reformulation to only those beverages. Broadening the tax base would thus similarly broaden the scope of reformulation, which may also broaden the public health benefits.
Stability is important for businesses’ long-term decision-making but is also important for revenue. Tax revenues tend to be less stable when tax bases are narrow, as fluctuations in market conditions or consumer preferences have an outsized effect on generated revenues. Broadening the SSB tax base would also help establish a more stable revenue stream, both by insulating against fluctuations and reducing opportunities for substitution. Having more stable revenues may also reduce the need for regular or irregular changes in tax rates or structures that may tempt governments as revenues naturally decline.
Neutrality is one of the most discussed issues in SSB tax design. Neutral taxes, often with broad bases and low rates, minimize market distortions and facilitate decisions based on economic merits rather than tax reasons. Excise taxes aren’t neutral; they are targeted and designed specifically to impact decisions made by consumers.
Nevertheless, excise tax design should strive to be as neutral as possible within the taxed category. This is achieved by levying the tax on the best available proxy for the external costs. Such a tax base ensures that no particular industry or business receives an undue advantage created by a nonneutral tax and prevents consumers leveraging the disparate tax treatment to avoid the tax without changing dietary behavior by switching to untaxed products. In the world of SSB taxes, the tax category should be as broad as possible.
If the external costs are primarily associated with obesity, nutrient taxes on all foods and beverages, not just SSBs, are the best tax base and would grant the most neutral tax treatment. A low-rate, specific tax base on each product’s kilocalories would have a far better chance at decreasing obesity and improving public health than narrowly targeted SSB taxes.
SSB Taxes in Europe
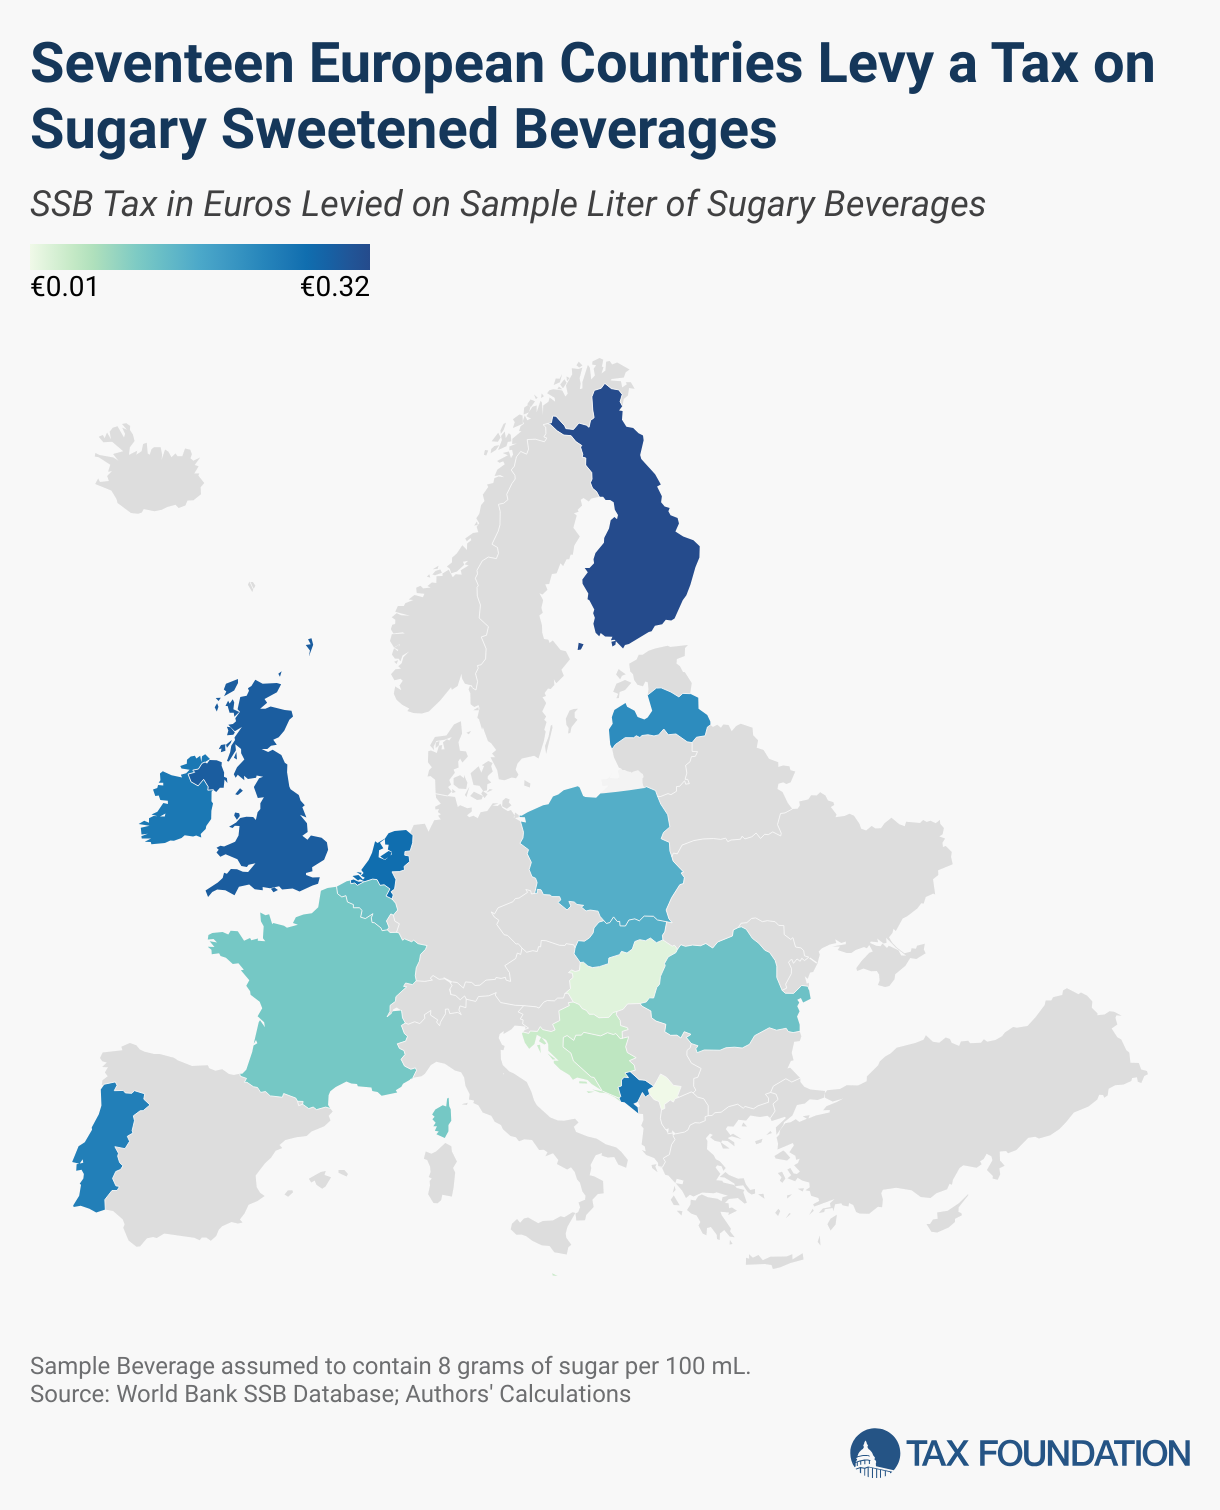
Several countries in Europe levy some version of an SSB tax, but the structures, rates, and covered products vary significantly across jurisdictions. As of 2025, there are at least 17 European countries which levy a tax on sugary beverages.[3] This includes Spain, which levies an increased VAT rate on some sugary sweetened beverages relative to other food and drinks and has a regional tiered excise tax on drinks with added sugars in Catalonia. There are nine other countries that levy an increased VAT rate on sugary beverages than other beverages, including Romania’s standard rate relative to a reduced rate on other drinks.
Croatia, Finland, France, Hungary, Ireland, Latvia, Poland, Portugal, Romania, and the United Kingdom also levy a tiered excise tax per liter depending on the amount of sugar in the beverage. Belgium, Bosnia and Herzegovina, Kosovo, Malta, Monaco, Montenegro, the Netherlands, and Slovakia levy a flat excise tax per liter on covered products that does not vary with sugar content.
Italy has provided for a flat rate SSB tax but has continually delayed its implementation; it is currently set to take effect July 2025.[4] Denmark and Norway have both abolished their SSB taxes.
SSB tax bases also vary widely. A few countries levy a tax on a broad spectrum of nonalcoholic beverages, but most EU countries limit their tax to beverages with added sugars. Some countries extend their tax to beverages with natural sugars or even beverages with no- and low-calorie sweeteners. Most countries exempt milk-based drinks, 100 percent juices, flavored mineral waters, or other specific types of beverages.
All EU countries with a beverage tax apply the tax on sugary carbonated beverages and energy drinks, while some countries add escalating rates for products containing taurine and/or caffeine. Roughly two-thirds of the EU SSB taxes include fruit juices, while only Croatia, Finland, Latvia, and the Spanish region of Catalonia apply their SSB tax to milk products. Low-calorie and diet beverages fall under the SSB tax in nearly three-quarters of EU countries with SSB taxes, and the Netherlands and Finland go so far as to tax (unsweetened) water.
The per liter tax rates are also drastically different between jurisdictions. For one liter of a sample beverage product with a sugar content of 8 grams per 100 mL, the lowest SSB tax is levied by Kosovo (€ 0.005) and the highest is currently levied by Finland (€ 0.32). Some countries levy additional taxes on caffeinated drinks as well. These taxes are levied separately from and in addition to any standard VAT, tax on product packaging, or other levy. Both France and the United Kingdom are set to increase their SSB tax rates, which would make France the highest at a new rate of € 0.35 per liter.
The Pathology of Public Policy
Public policy is often implemented with the best intentions. Converting public policy ideas into legislation and eventually into real-world outcomes is a process we call the pathology of public policy. The eventual outcomes of policy changes—both intended and unintended—result from the design of the policy, market effects, and behavioral changes.
Specifically, for SSBs we identify four stages for an SSB tax to influence a policy outcome of improved public health.
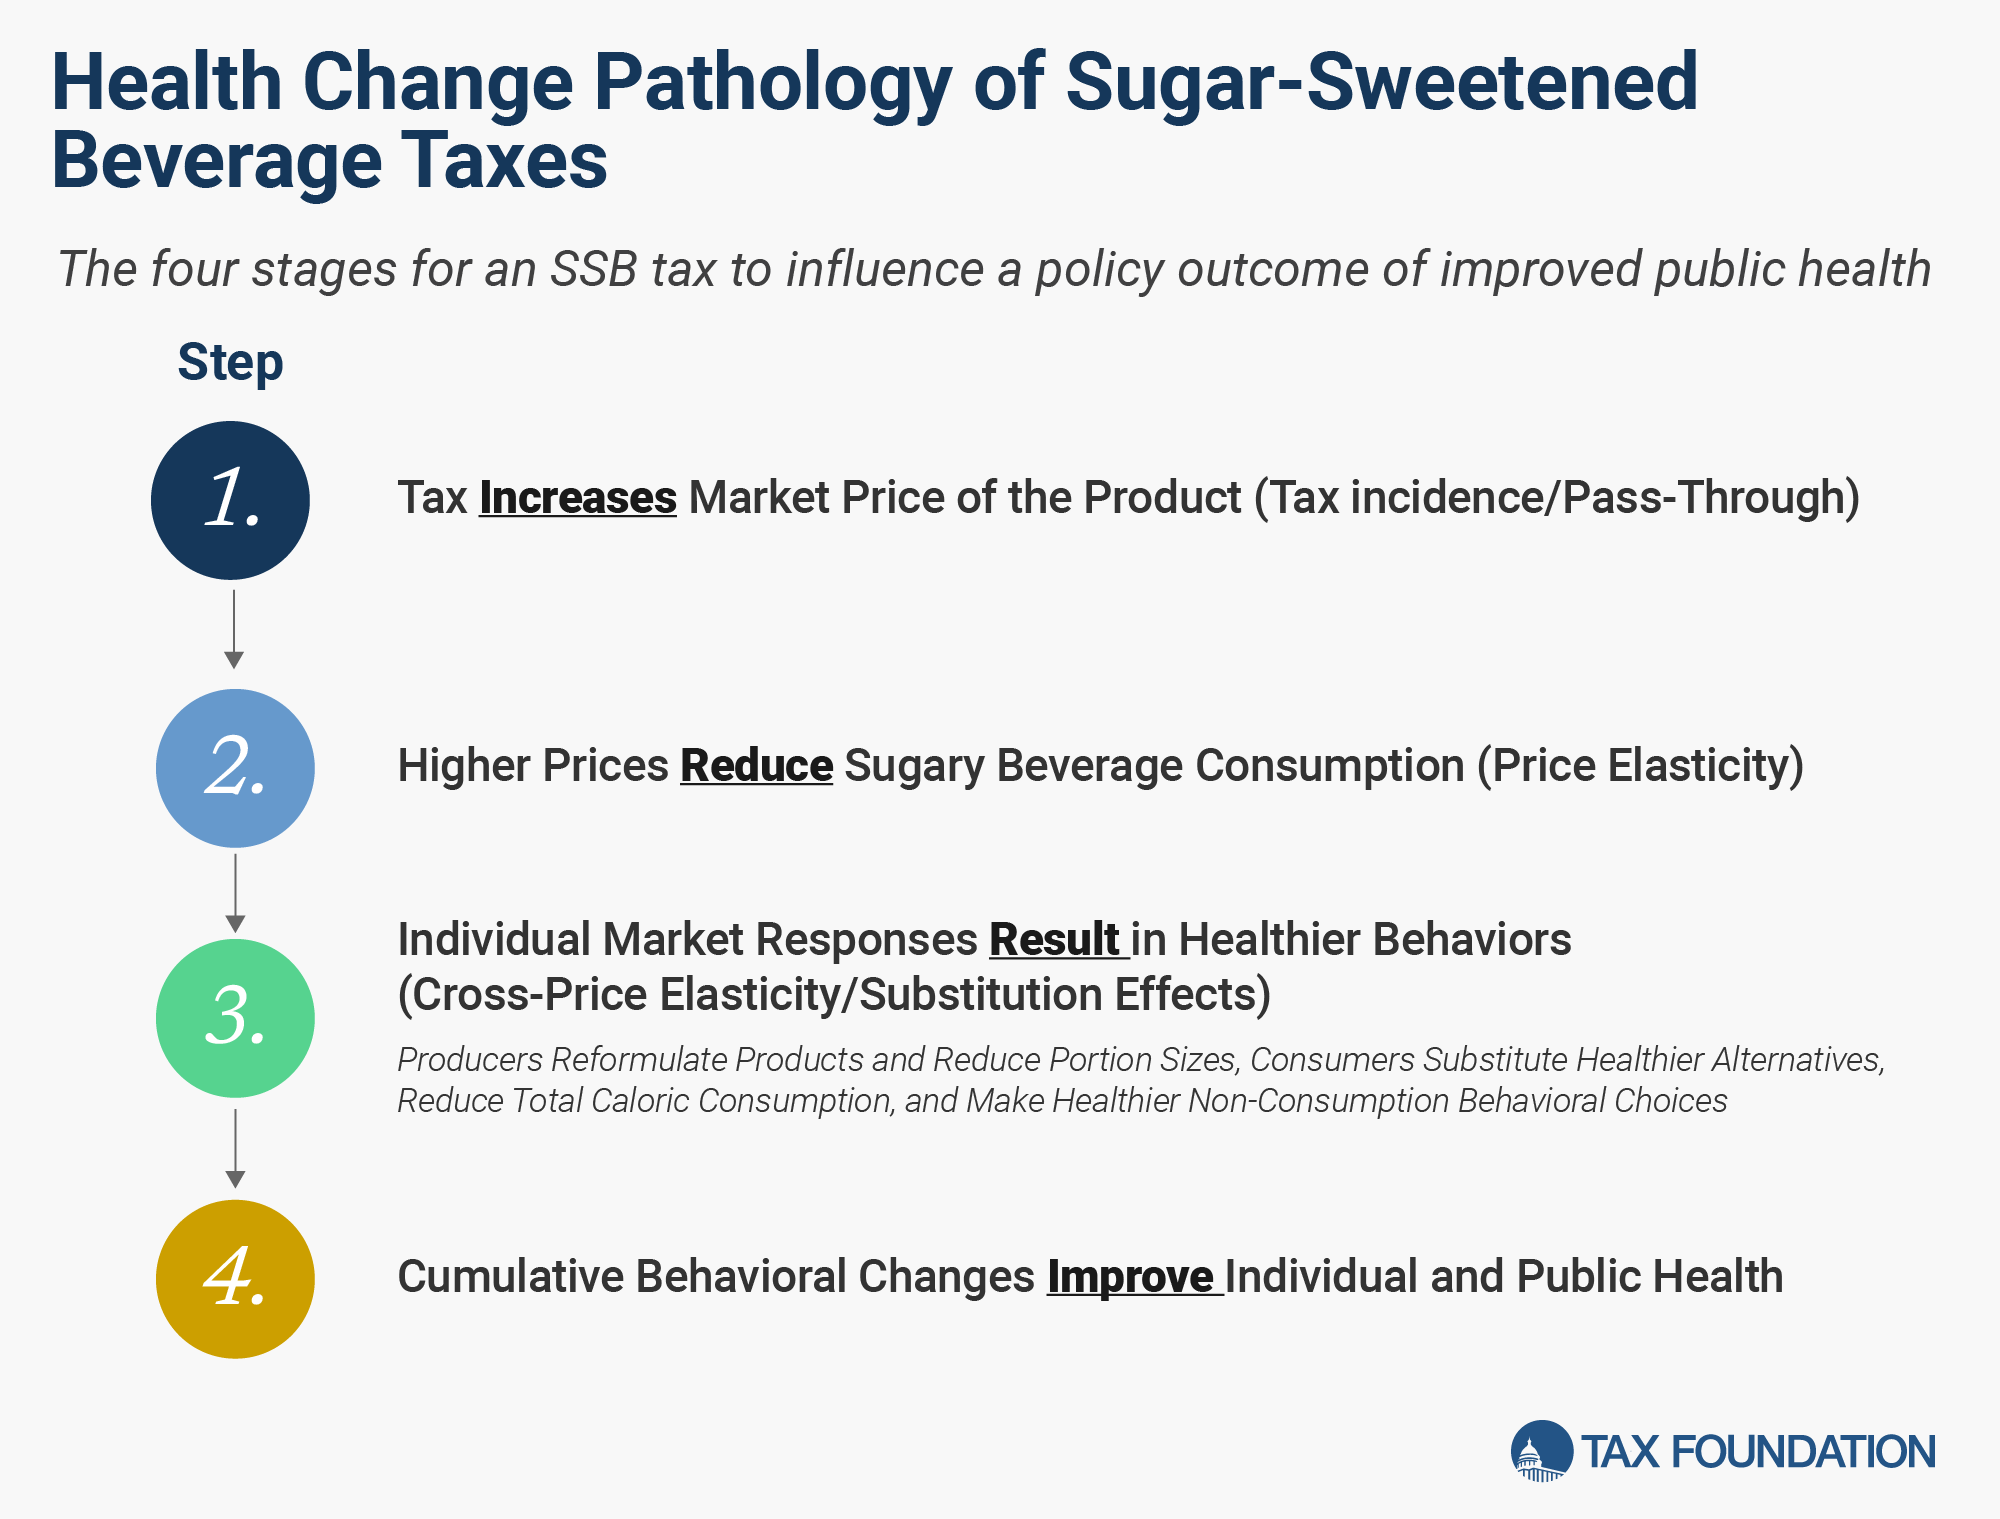
1. Taxes Increase the Price of SSBs
In almost all cases, a tax applied to any product will increase the price consumers pay for that product. This occurs regardless of whether the tax is actually collected from consumers or producers. For simplicity with tax compliance and remittance, most excise taxes are charged to producers or retailers, but a portion of that tax is passed along to consumers in the form of higher prices.
Economists measure what percentage of a tax is paid by consumers and producers, called the tax incidenceTax incidence is a measure of who bears the legal or economic burden of a tax. Legal incidence identifies who is responsible for paying a tax while economic incidence identifies who bears the cost of tax—in the form of higher prices for consumers, lower wages for workers, or lower returns for shareholders. . The fraction of the tax that is passed along to consumers is also referred to as the pass-through rate. A $1.00 tax remitted by producers, for example, that results in consumers paying an extra $0.75 and costing producers $0.25 would have a pass-through rate of 75 percent or a consumer tax incidence of 75 percent and producer tax incidence of 25 percent.
The pass-through rate of the excise tax then also contributes to still higher prices via a multiplier effect with any VATs, sales taxes, or other levies that may be charged on the now higher retail price of the product.
Academic Evidence
Pass-through rates are some of the easiest measures to quantify and many studies have done so. Most of the tax applied to SSBs is passed along to consumers.
A meta-analysis that summarized the work of many studies found an average pass-through rate of about 82 percent.[5] Estimates of the pass-through rate (95 percent confidence interval) ranged from 68 to 98 percent.
2. Higher SSB Tax-Induced Prices Decrease SSB Consumption
The law of demand says that as price increases, quantity demanded will fall. Higher tax-induced SSB prices should decrease SSB consumption. Exactly how much prices reduce consumption has been widely studied. Economists’ preferred measure for this is the price elasticity of demand—calculated as the percent that quantity of SSB declines divided by the percent that price increases, allowing for a fairly comparable analysis across differently designed SSB taxes.
Academic Evidence
Researchers have reported a wide range of estimates for how much SSB consumption responds to tax-induced price changes. Generally speaking, studies find that a tax-induced price increase of 10 percent will decrease SSB purchases by about 10 percent, a price elasticity of -1.0. This can vary depending on market demographics and conditions, with different European markets experiencing estimated price elasticities of between -0.5 and -1.0.
SSB taxes that are more narrowly defined will elicit a much greater market response for the taxed products than those that are broadly defined. A tax applied only to sugary beverages will elicit a larger change for sugary beverage consumption, for example, than the change in all beverage consumption resulting from a tax on all beverages. The narrower the tax base, the more easily consumers can switch to substitute products; taxes with narrowly defined bases more heavily distort and influence consumer purchases.
More recent research has also questioned some of the methodology of the early studies. Using the Mexico SSB tax as a case study, researchers demonstrated that early SSB tax studies, including those favored by the World Health Organization to promote policies of SSB taxes, overestimated consumer response by a multiple of 4-6x, in part by failing to recognize the opportunity for consumers to substitute toward existing lower-priced (and other lower-quality) products.[6]
Also important to note is that if the tax is geographically limited in scope, as in many of the city-only policies implemented in the United States, the decline in SSB consumption may be only half as large as consumers will cross-border shop to avoid the tax.[7] National level taxes also incentivize cross-border shopping in neighboring countries that have a lower tax rate or no tax at all, and all excise taxes incite some level of smuggling and illicit trade to avoid the tax entirely.
3. Individual Market Responses Result in Healthier Behaviors
On aggregate, consumers drink fewer SSBs following an SSB tax. Does this result in a decline in total caloric consumption? The answer is paramount to an SSB tax achieving a goal of improved public health.
If the tax-induced decline in SSB consumption was replaced entirely by plain water, SSB taxes would likely result in a decrease in caloric consumption. However, caloric reduction isn’t even guaranteed if consumers switch from SSBs to water because they may simply consume more of other food, which tends to contribute more to overall calories than beverages already. And water isn’t the only substitute for sugary beverages. Consumers may also switch to high-sugar beverages excluded from the SSB tax base, or they may switch to alcoholic beverages that may have a reduced price differential after the implementation of an SSB tax.
Further, caloric reduction isn’t a panacea for improving public health. Some consumers may derive health benefits from an increase to calories consumed. A top-down suppression of calorie intake undermines the ability of consumers to manage their diets based on their individual needs and preferences. Even within the subset of targeting only obesity-related issues, fewer calories consumed will only improve health if paired with a health-improving physical activity plan. If a reduction in caloric consumption is paired with a reduction in caloric expenditure, individuals are unlikely to see substantial changes to their health.
Market responses aren’t limited to consumer demand. Producers will respond to tax policy as well, both by reducing portion sizes and notably by providing lower-priced, less-taxed products. For SSB products, this often takes the form of reformulated products. If an SSB tax increases based on sugar content in a beverage, for example, producers can provide lower-taxed products by reducing the sugar content in products. Diet beverages, containing no sugar, may carry no tax. The incentives to reformulate and the extent producers will do so are limited by the tax design and consumer responses to the newer products, but reformulation is sometimes a key piece of SSB tax goals.
Academic Evidence
Unlike the robust data available on market pricing and elasticity effects referenced earlier, less evidence exists on consumer substitution and total caloric consumption. To quantify substitution effects, individual non-SSB products and categories must be studied in parallel to SSB taxes and consumption. And where market pricing and sales data may be obtainable in areas where SSBs are applied, robust data on individual caloric intake are uncommon.
Some studies have found evidence that SSB taxes affect consumer responses to milk, coffee, tea, juice, and juice drinks in certain circumstances, while other studies find SSB taxes resulted in no significant change to market-wide consumer purchases of untaxed beverages.[8]
Multiple studies report causal increases in beer consumption resulting from SSB taxes.[9],[10] Overall, researchers don’t know everything that occurs when SSB taxes incentivize some consumers to drink fewer SSBs, but it is clear that all drinkers don’t simply substitute water.
Other behavioral responses are largely unstudied, such as how physical activity and aggregate caloric expenditures respond to changes in SSB consumption.
Reformulation is broadly observable, particularly in the cases where the tax design incentivizes it, such as the UK. The development of diet beverages demonstrates that SSB producers will bring new products to market. Diet beverages predate SSB taxes by a considerable number of years, so those cannot be attributable to SSB taxes. Reformulation generally has been an ongoing effort by industry leaders to respond to consumer preferences before SSB taxes were widely levied and can be seen in countries like Italy, where an SSB tax has yet to be implemented. However, in several countries, SSB producers reduced the amount of sugar in many products following an SSB sugar-based tax. Examples from the UK and Ireland are discussed in more detail in the Case Studies later in this paper.
4. Cumulative Market and Behavioral Responses Improve Public Health
Perhaps the most important question to evaluate SSB taxes is whether those taxes ultimately improve public health. SSB taxes increase market prices and decrease the quantity of SSBs consumed. However, cross-border trade, consumer substitution for unhealthy but untaxed products, and behavioral changes may counteract any decreases in caloric consumption.
Academic Evidence
The growing body of empirical evidence finds no evidence of body mass index (BMI) reductions or a decrease in obesity prevalence following the imposition of SSB taxes.[11],[12],[13],[14] These findings stand in contrast to modeling efforts that attempt to predict the effects of SSB taxes, which often show significant reductions in BMI and obesity prevalence.
The causal effects literature of SSB taxes and BMI are heavily US-focused but are consistent across different areas that were studied. The results have remained consistent for more than a decade of empirical research. One study summarized these results succinctly:
“Together, [these] results cast serious doubt on the assumptions that proponents of large soda taxes make on its likely impacts on population weight. Together with evidence of important substitution patterns in response to soda taxes that offset any caloric reductions in soda consumption [these] results suggest that fundamental changes to policy proposals relying on large soda taxes to be a key component in reducing population weight are required.”[15]
Outside of the US, the SSB tax in Mexico has also been studied. One set of authors summarized their findings in the title of their paper, “The ‘soda tax’ is unlikely to make Mexicans lighter: new evidence on biases in elasticities.”[16]
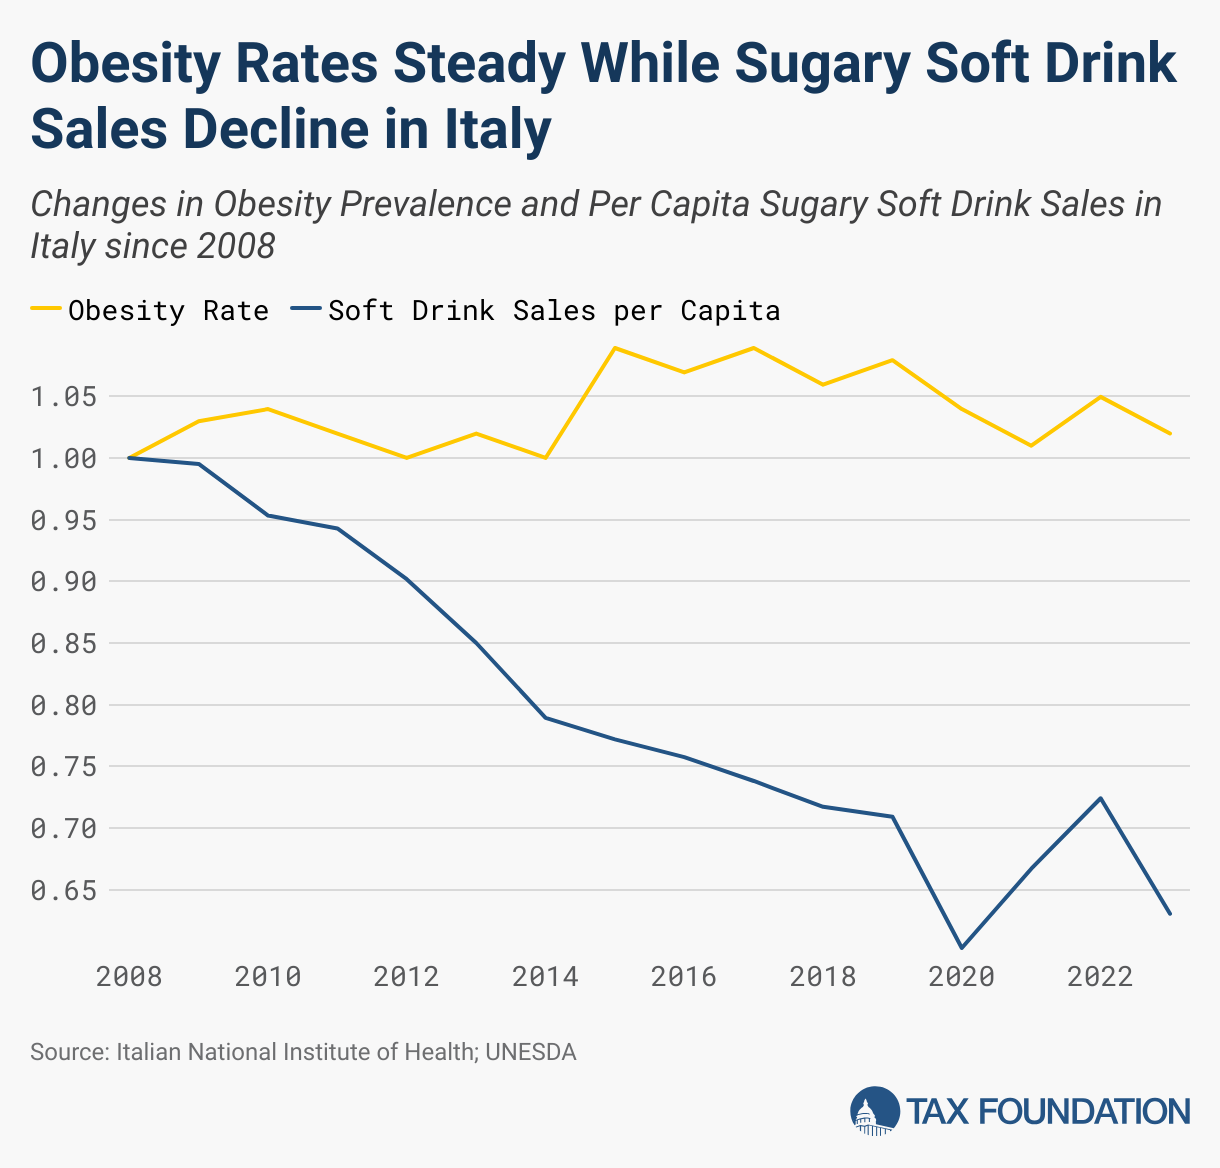
The tendency for obesity prevalence to be unresponsive to SSB taxes is likely because sugary beverage consumption is only one minor factor influencing weight. Even if an SSB tax were particularly effective at reducing sugary beverage consumption, without other changes to diets, exercise, or lifestyles there would still be little overall effect on a population’s rate of obesity. In Italy, for instance, historical obesity rates have remained stable despite reductions in per capita soft drink sales.
Unintended Consequences and Tax-Induced Decreases in Well-being
Excise taxes create unintended consequences. Sometimes these effects are minor and simply a cost associated with tax compliance. Other times, the unintended consequences are so costly the result of the policy is a net negative to society.
It is also important to remember that tax revenue generated from a tax is not a social benefit. Tax revenue is simply transferring money from buyers and sellers to the government.
Further, excise taxes that aren’t implemented due to external harms reduce consumer well-being. Consumers either continue to consume the now more expensive product, leaving them poorer, or they switch to a different product that they enjoy less. Either decision makes consumers worse off.
Academic Evidence
The most studied unintended consequence from SSB taxation is cross-border shopping. On the scale of negative outcomes, cross-border shopping is minor. The only societal loss is the waste of consumer time spent traveling to avoid the tax, though in aggregate this loss can be substantial.
For local US taxes, studies found strong measures of cross-border shopping.[17],[18],[19] We did not find studies that explored cross-border shopping resulting from national taxes, but a study on the COVID-19 border closings found a significant amount of cross-border shopping in groceries, including SSBs, from Denmark to Germany to avoid an elevated VAT rate.[20] Studies also found a reduction in grocery sales[21],[22] in regions where SSBs were applied.
Unlike some products, such as cigarettes, where smuggling becomes a lucrative opportunity, illicit trade in sugary beverages is unlikely to arise. Soft drinks are relatively low-cost, and the heavy liquid volume makes transportation and illicit activity more costly.[23]
Behavior changes can also appear unexpectedly. While we found no studies that suggest changes to physical activity or caloric expenditures, some preventative dentistry associations suggest that SSB taxes encourage consumers to sip SSBs more slowly, undermining dental health by exposing the mouth to SSBs over longer periods of time.[24]
Case Studies from Europe
SSB tax design and rates vary across countries. In Europe, we explore SSB taxes implemented in seven countries. These range from France’s SSB tax, implemented in 2012, to Romania’s SSB tax implemented in 2024. Some effects of SSB taxes, such as those on prices and sales, can be observed quickly, while data on longer-term health effects can only be examined after many years.
Table 1. Sugar-Sweetened Beverage Tax Designs Vary Across Countries
Case Study of Taxes in Select European Countries, 2025
| Country | Tax Type | Tax Rates | Covered Products |
|---|---|---|---|
| France | Scaling Excise Tax | €0.035/Liter for up to 1 g Sugar | Nonalcoholic drinks with added sugars or sweeteners |
| Additional €0.0059 per g Sugar up to €0.0523/Liter for 4 g Sugar | Excludes milk-based beverages | ||
| Additional €0.0117 per g sugar up to €0.0873/Liter for 7 g Sugar | |||
| Additional €0.0232/Liter per additional g Sugar | |||
| The Netherlands | Flat Excise Tax | €0.2613/Liter | Nonalcoholic beverages |
| Excludes mineral waters | |||
| Excludes dairy drinks | |||
| United Kingdom | Two-Tiered Excise Tax | €0.217/Liter on 5-8 g Sugar | Soft drinks with added sugars |
| €0.289/Liter on at least 8 g Sugar | Excludes milk drinks | ||
| Excludes 100% juices | |||
| Ireland | Two-Tiered Excise Tax | €0.1626/Liter on 5-8 g Sugar | Soft drinks with added sugars |
| €0.2439/Liter on at least 8 g Sugar | Excludes milk and plant protein drinks with at least 119 mg calcium | ||
| Excludes alcohol-free beers and wines | |||
| Portugal | Four-Tiered Excise Tax | €0.0116/Liter on less than 2.5 g Sugar | Soft drinks with added sweeteners |
| €0.0695/Liter on 2.5-5 g Sugar | Includes drinks with an alcoholic strength between 0.5% and 1.2% | ||
| €0.0926/Liter on 5-8 g Sugar | Excludes milk | ||
| €0.2318/Liter on at least 8 g Sugar | Excludes juices | ||
| Poland | Formulaic Excise Tax | The total tax per liter is the sum of the fixed fee and the variable fee | Beverages with added sugars, sweeteners, or caffeine or taurine |
| Fixed fee = €0.118 | Excludes milk drinks | ||
| Variable fee = €0.0118 per g Sugar above 5 | Only the variable fee applies to drinks that are at least 20% juice | ||
| Additional tax of €0.0237 per Liter for caffeine or taurine | |||
| The total tax cannot exceed €0.284 per Liter | |||
| Romania | Two-Tiered Excise Tax | €0.08/Liter on 5-8 g Sugar | Nonalcoholic beverages with added sugar |
| Catalonia, Spain | Two-Tiered Excise Tax | €0.10/Liter on 5-8 g Sugar | Soft drinks according to total sugar |
| €0.15/Liter on at least 8 g Sugar | Fruit juices and some dairy beverages according to added sugar |
France
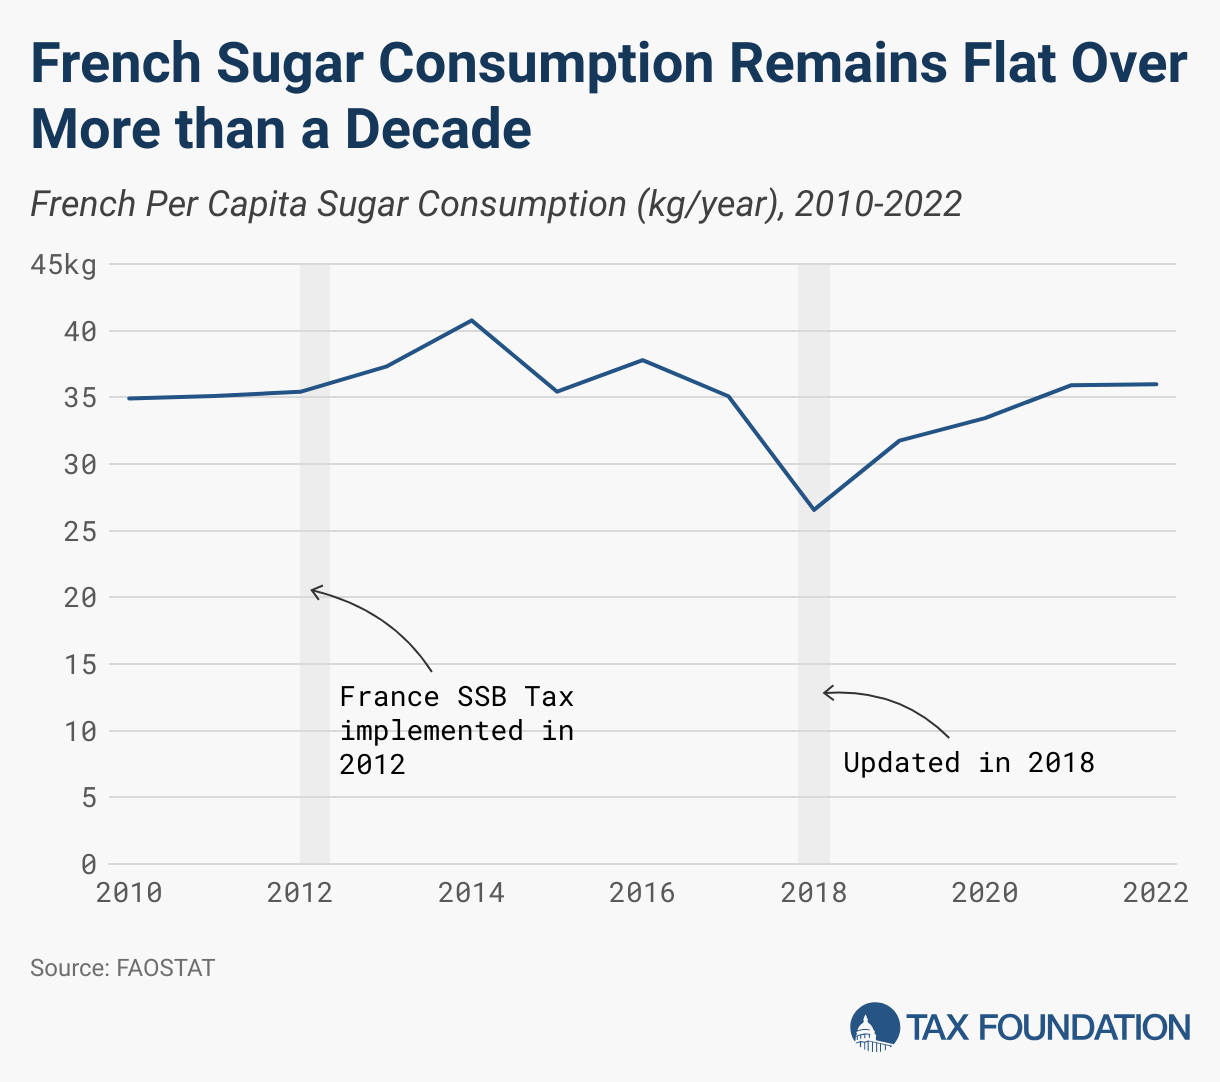
One of the first large European countries to levy a tax specifically on sugary sweet beverages was France in 2012. The tax was levied as a flat taxAn income tax is referred to as a “flat tax” when all taxable income is subject to the same tax rate, regardless of income level or assets. per liter regardless of sugar content until 2018, when it was amended to a tax with a scaled rate per gram of sugar per 100 mL of beverage. France has coupled its tax rate most directly with sugar content among the countries in Europe, most directly targeting the element believed to be causing harm to public health.
Any soft drinks sold in France except dairy drinks with added sweeteners, including sugar-free synthetic sweeteners, are subject to the tax. The tax rate scales from €0.035 per liter for drinks with less than 1 gram of sugar per 100 mL, like those with no- and low-calorie sweeteners, up to €0.2734 per liter for drinks with 15 grams of sugar per 100 mL.[25] For drinks with even more sugar, each additional gram of sugar content incurs an additional €0.0232 per liter in tax.
The 2012 version of the tax did pass through at high rates to covered products, raising their prices by about 5 percent on average, but had little effect on quantities purchased. Research showed a reduction in per capita weekly purchases of about 10 mL of drinks subject to the French tax, though it was not significant compared to consumer behavior in Italy over the same period. There was a larger estimated effect on per capita weekly purchases among those in the top quartile of drink purchasers in France, however, whose weekly purchases decreased by an estimated 132 mL.[26]
Daily adolescent consumers of soda declined in France from about 30 percent in 2010 to about 24 percent in 2016, which was about the same as the decline in Germany and less than the decline in Italy over the same period—both countries without a tax on soda.[27]
There has been less research published since the tax change in 2018. Researchers expect a similar pass-through rate.
Despite coupling the tax rate directly to sugar content, the French soft drinks market seems to have experienced very little reformulation in its products. In other countries, many beverages were reformulated with less sugar, and thus less tax. However, roughly 90 percent of studied drinks in France did not change their sugar content in response to the tax. Reformulation generally is an ongoing process over many years largely driven by consumer preferences, market trends, and voluntary pledges. An SSB tax might accelerate these efforts if designed correctly, but they are not the underlying cause.
The overall effect on sugar consumption in France has also been very low. On average, the French had experienced a reduction in daily sugar consumption of less than one gram per day.[28] In 2010, France had an annual per capita consumption of sugar of 34.92 kg, but an annual per capita consumption of sugar of 35.98 kg in 2022.[29]
The obesity rate in France seems to have increased significantly in recent decades, though the rate remains low relative to most other EU countries. In 2020, 17 percent of the French population was obese, which marked a significant increase from 2012 and double the rate of 1997.[30] More recent data would be needed to evaluate any effect of the restructured tax on the prevalence of obesity in the French populace, but past experience in France and experiences elsewhere may indicate that the narrow SSB tax base will remain unable to significantly affect obesity rates in the future.
Surveys show the populace supports the tax, especially if the revenues are dedicated to health programs rather than general revenues. Additionally, as might be expected for a regressive taxTaxes can create different burdens on taxpayers of different income levels, measured by comparing taxes paid as a fraction of income. A regressive tax is one that creates a larger burden on lower-income taxpayers than on middle- or higher-income taxpayers. , people with higher incomes tend to be more supportive of the tax as are those who already believe SSBs to be unhealthy.[31]
The tax generated about €443 million in revenues for the French government in 2023, some of which is earmarked for health programs through their Social Security program, though not necessarily health programs related to obesity or other health effects of sugar consumption.[32] In response to the underwhelming effects of the tax, as well as a significant deficit in their Social Security program, the French Senate voted to drastically increase the tax and institute a new additional tax on sweetened drinks in 2024—over the objections of the country’s health minister.[33]
The new tax takes inspiration from the UK’s Soft Drink Industry Levy, which seemed to have more influence on product reformulation. However, no- and low-calorie sweeteners will still be taxed, at a new higher rate, and the tax still applies to the first gram of sugar in a beverage, which may still undermine the incentives for manufacturers to reformulate their products.
Netherlands
The Netherlands first imposed an excise tax on sugar in 1819, though this was meant to be a broad-base revenue tool (by 1819 standards) by taxing a universal commodity, not a modern measure to discourage sugar consumption. The country now levies a tax on nonalcoholic beverages, which excludes dairy and recently also excludes mineral waters.
In January 2024 the tax rate was increased to €0.2613 per liter of covered products regardless of sugar content.[34] The recent increase to the tax rate was projected to generate €300 million in annual revenue, for a total of about €600 million in 2024.[35]
With no variation in tax rate based on sugar content, beverage manufacturers have no incentive to reformulate their products outside of unrelated voluntary pledges or attempts to satisfy consumer preferences. However, there has reportedly been some “reformulation” to avoid the tax, which exempts dairy drinks, by adding a very small amount of milk to juices.[36]
Since the tax has historically applied to almost all nonalcoholic beverages, Dutch consumers have had no incentive to switch from SSBs to healthier, lower sugar options except for dairy drinks. Recently, flavored waters were excluded from the tax to lower their relative prices and encourage switching to water. To prevent the higher tax on nonalcoholic beverages from encouraging consumers switching to alcoholic beverages, the tax on alcohol was also increased in 2024.[37]
Sales of soda in the Netherlands have been declining for over a decade, while sales of flavored waters increased. Daily adolescent consumers of soda in the Netherlands decreased from about 48 percent in 2002 to about 21 percent in 2018.[38] The Dutch government attributes this trend to voluntary commitments from the beverage industry, not from consumer reactions to the tax regime.[39]
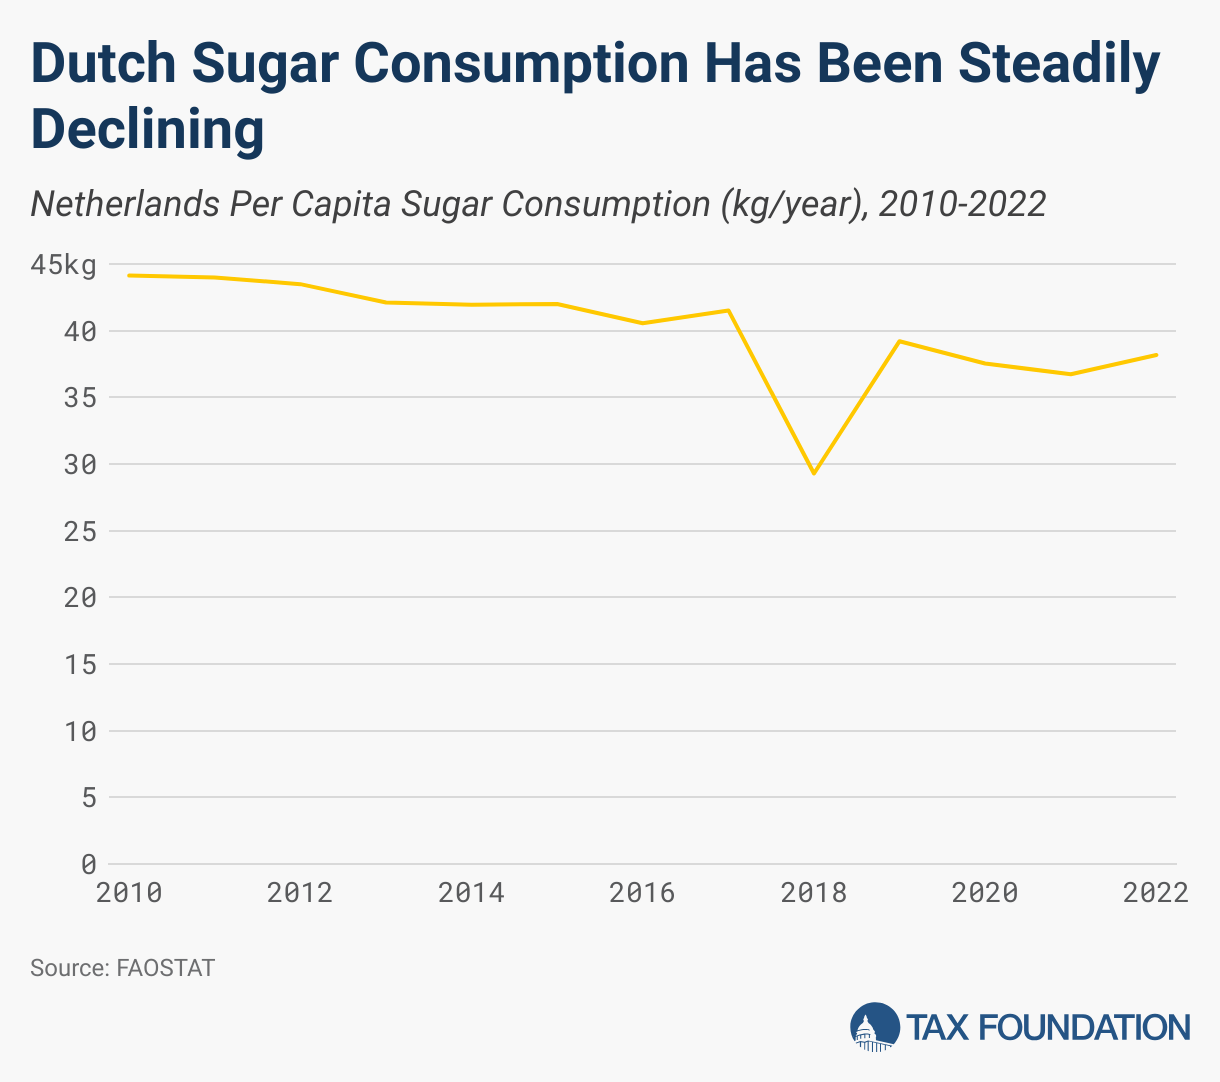
Sugar consumption has been declining slowly but steadily in the Netherlands for more than a decade, from 44.13 kg per year in 2010 to 38.18 kg per year in 2022.[40]
The obesity rate in the Netherlands, however, has been steadily increasing for decades: 15.6 percent of adults were obese in 2023, a tripling of obesity prevalence since 1985.[41] The rate in the Netherlands is still low relative to other EU countries but has increased significantly from only 11.8 percent in 2013.
The changes to the Netherlands’ nonalcoholic beverage tax are too recent to develop an empirical analysis of its effect on prices or sales. However, it could be intuitively expected that a flat excise tax uncoupled to sugar content and broadly applied to more drinks than just SSBs may be less effective at discouraging SSB consumption than a true SSB tax.
The Netherlands has been considering a true sugar tax, targeting sugar content, for years but no plans have been set and research suggests a sugar tax may not be an optimal way to improve Dutch health.[42] There has been some conflict arising from potentially competing goals of the Ministry of Finance and the Ministry of Health whether to prioritize revenue or public health in its design.[43]
United Kingdom
The United Kingdom Soft Drinks Industry Levy (SDIL) is a two-tiered excise tax on soft drinks except for dairy and 100% juices. Drinks between 5 and 8 grams of sugar per 100 mL are taxed at £0.18 per liter (€0.217 per liter), while drinks of at least 8 grams of sugar per 100 mL are taxed at £0.24 per liter (€0.289 per liter).[44] These rates have remained the same since 2018. To address the deteriorating inflationInflation is when the general price of goods and services increases across the economy, reducing the purchasing power of a currency and the value of certain assets. The same paycheck covers less goods, services, and bills. It is sometimes referred to as a “hidden tax,” as it leaves taxpayers less well-off due to higher costs and “bracket creep,” while increasing the government’s spending power. -adjusted value of the tax, the UK will increase the rates to £0.194 and £0.259 (€0.234 and €0.3124) in April 2025 and automatically adjust for inflation annually.[45]
The SDIL excluded milk drinks to avoid discouraging calcium consumption, but the high sugar content in some milk drinks has prompted some debate over the exemption’s merits.[46]
The SDIL generated £338 million (€407 million) for the 2023-2024 financial year, much less than what had been projected in the initial proposals.[47] Indexing the tax rate to inflation is projected to yield approximately an additional £20 million (€24 million) every year.[48] These revenues were initially promised to be dedicated to youth health programs but have since been absorbed into general funds.[49]
Despite the UK government’s claims that this was not meant to be a tax on consumers, the tax tends to be largely passed through to prices as expected for excise taxes.[50] However, only about 11 percent of drinks sold in the UK are subject to the SDIL. Many products sold in the UK have been reformulated to avoid the tax.
Reformulation was one of the key goals of the SDIL policy from its outset.[51] The average sugar content of drinks fell from 3.8 grams per 100 mL in 2015 to 2.1 grams per 100 mL in 2020. While soft drinks sales have increased 21.3 percent over that same time span, the total sugar sales from those drinks have decreased 34.3 percent.[52]
The UK government closely monitors changes in the products subject to the SDIL as part of its regular progress reports on sugar reduction efforts in the country. The Office for Health Improvement and Disparities uses the 2016 announcement of the SSB tax as a cutoff for evaluating the policy’s effects. However, voluntary pledges to reformulate products predate the policy implementation, muddying the causal implications of the differences observed over time attributable to the tax.
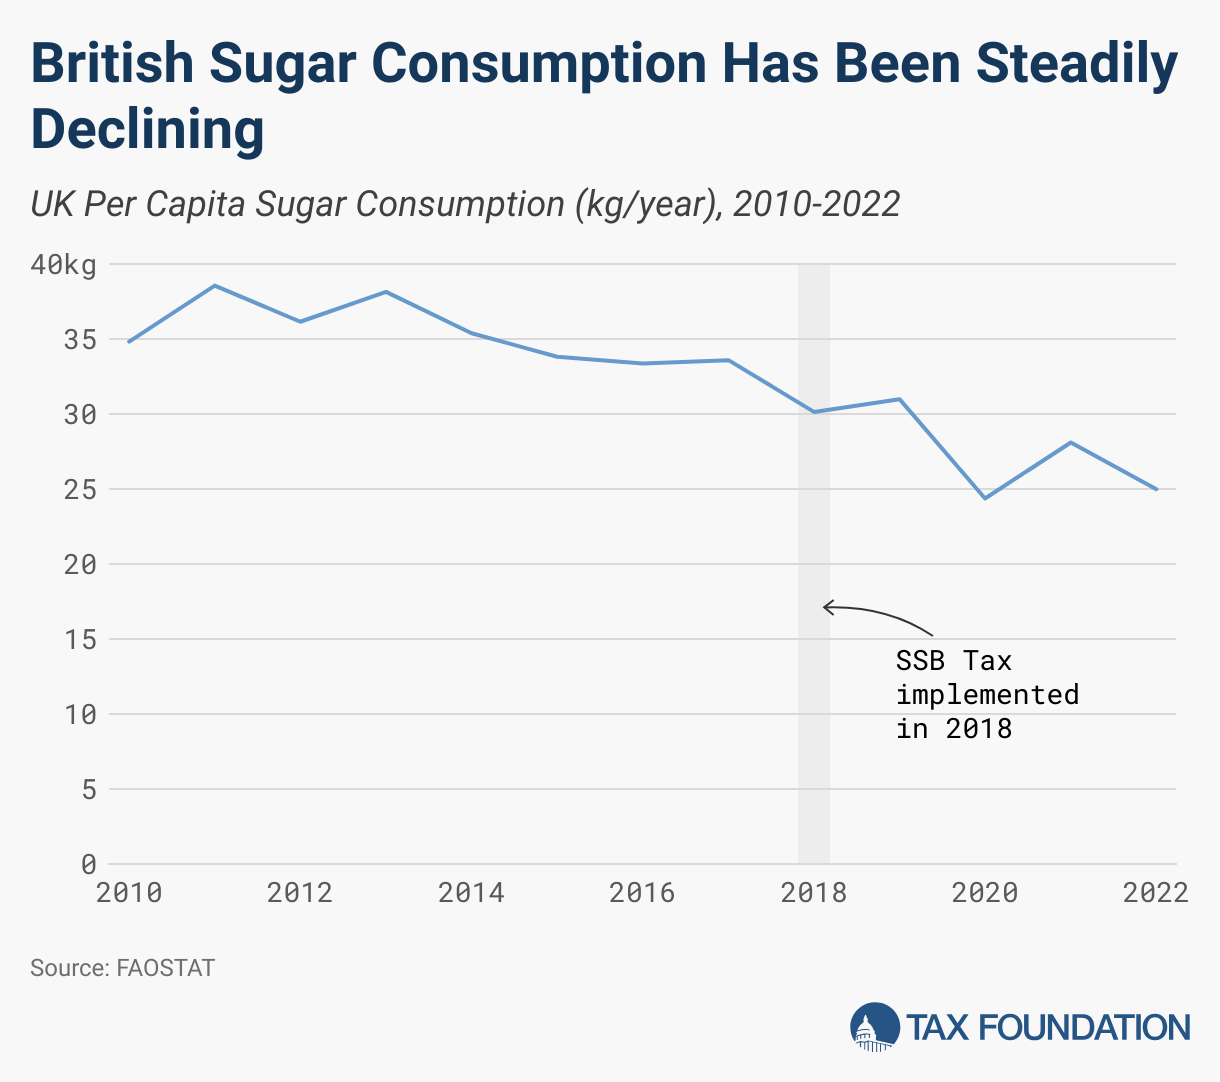
Sugar consumption in the UK has been declining since 2013. The rate of decrease accelerated in 2017, which is likely related to reformulation and other changes attributable to the country’s sugar reduction program. The program was implemented from 2016 to 2020 and targeted food categories in addition to soft drinks under the SDIL, which likely bolstered its effectiveness in reducing sugar consumption significantly.
While sugar consumption has declined, obesity rates have still increased in the UK. In 2022, about 29 percent of adults were obese, a slight increase from about 27 percent in 2016. This is a significant increase from only about 16 percent in 1994.[53]
The UK’s more comprehensive approach to sugar reduction may have influenced the more pronounced and lasting reductions in sugar consumption in the country, having been reduced from 34.83 kg per year in 2010 to 24.99 kg per year in 2022.[54] With the broader sugar reduction program no longer in effect, this leaves only the SDIL—and voluntary industry pledges and changes in consumer preferences—keeping sugar consumption down after 2020.
The UK government has begun to evaluate their sugar reduction program and possibly develop a replacement. One notable commissioned report from Henry Dimbleby and the National Food Strategy recommends a broader tax on sugar and salt used in foods to encourage further reformulation and generate better health outcomes.[55] Other areas of UK regulations use nutrient profile models, which could serve as the basis for a broader version of an SSB tax that would likely be more effective.
Ireland
Ireland’s Sugar Sweetened Drinks Tax (SSDT) went into effect in 2018. The SSDT applies to water or juice-based drinks with added sugar and levies two tiers of rates depending on sugar content: €0.1626 per liter for drinks with between 5 and 8 grams of sugar per 100 mL and €0.2439 per liter for drinks with at least 8 grams of sugar per 100 mL.[56]
The SSDT generated €29.3 million in 2023, which is sent to the general fund and not earmarked for addressing the health effects of sugar or any other health programs. Earmarking, or hypothecation, is not common for the Irish tax regime, but there are examples of tax revenues from a levy being dedicated to programs related to that levy.[57]
The pass-through rate of the SSDT has been less extensively examined than SSB taxes in other countries, but the existing empirical studies seem to indicate a lower pass-through rate than similar taxes elsewhere..[58] A study of the Irish hospitality sector found a mean pass-through rate of 38.3 percent, which was only partially attributable to the SSDT due to the inherent differences in cost between sugar and sugar alternatives.[59] The SSDT clearly raises prices for consumers, as any similar tax does, but this may indicate one more possible point of failure for Ireland’s attempts to influence public health through an SSB tax.
The Irish government’s official reports largely view the SSDT as a success, pointing to reductions in sugar consumption both from reductions in the sugar content of beverage products via extensive reformulation and reductions in sugary beverages purchased by consumers due to higher prices. While the SSDT likely succeeded in accelerating these changes, it is unclear to what extent the SSDT can be credited with these changes.
There is evidence that the changes to health outcomes may be more attributable to a continuation of preexisting trends in underlying consumer preferences for healthier beverages, industry changes, or other factors. For instance, there was a reduction in adolescent daily SSB consumption of 84.8 percent from 2002 to 2018.[60]
As in the UK, there has been much reformulation of soft drinks in response to the tax; four out of five of the leading brands have been reformulated.[61] This, too, may not be attributable to the SSDT as reformulation had been taking place since 2005.
In Ireland, the per person sugar consumption from soft drinks fell from 5 kg in 2018 to 3.8 kg in 2022. This reduction also continues a preexisting trend, with sugar consumption falling from 5.9 kg to 5 kg per person from 2010 to 2018, though the decrease has clearly accelerated since 2018.
In 2018, as the decline in per person sugar consumption from soft drinks accelerated, the per person sugar consumption from energy drinks began to increase. This increase peaked at an additional 0.1 kilograms of sugar per person, far from offsetting the decline in soft drink sugar intake but indicating that some consumers switched to energy drinks.[62]
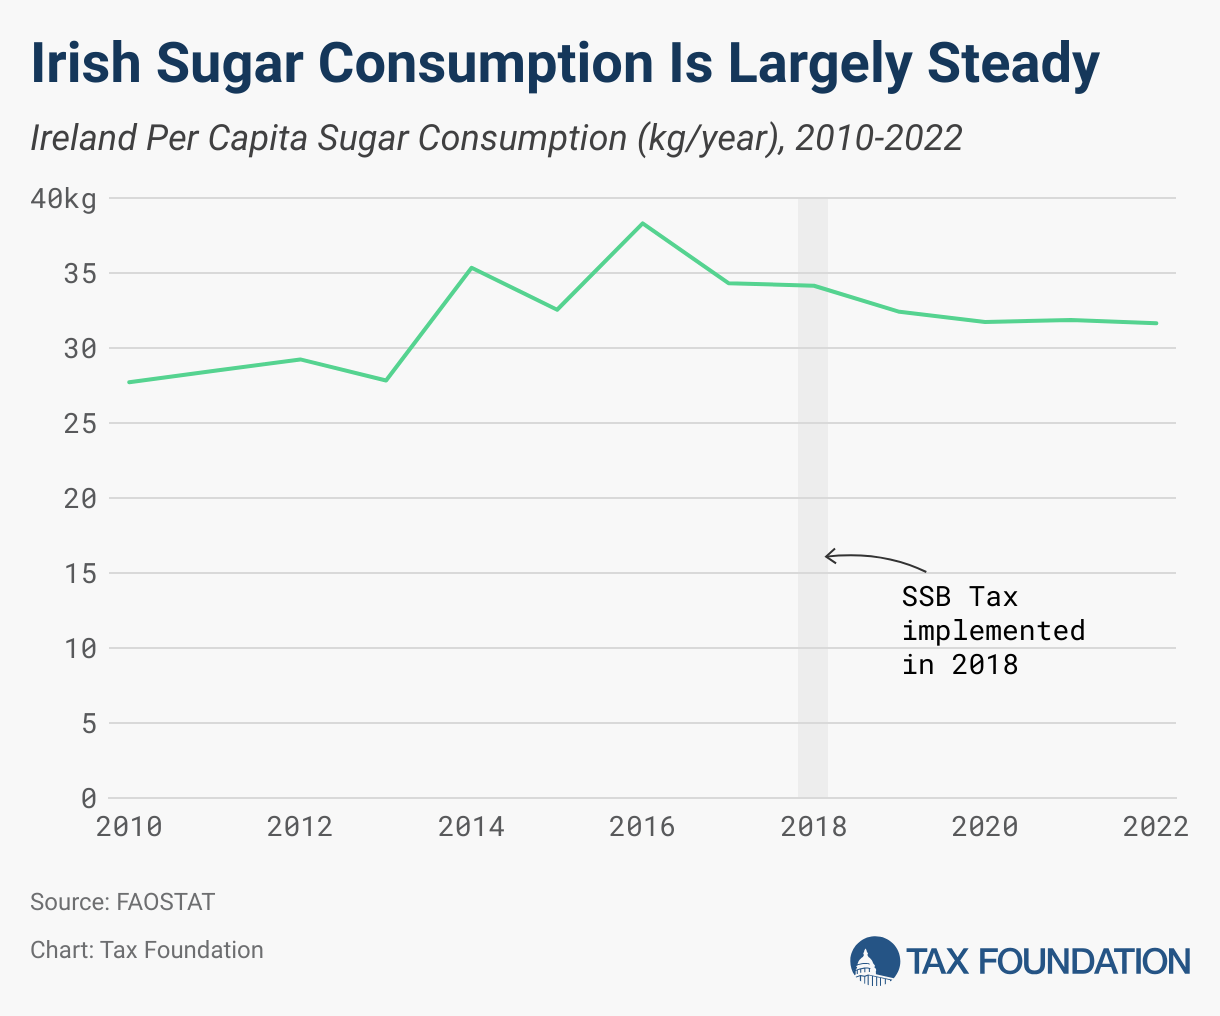
Total per capita sugar consumption has declined in Ireland since a peak in 2016 but has stagnated before reaching levels as low as in 2010.[63]
In 2022, about 29.5 percent of Ireland’s adult population was obese. This marked a drastic increase from 1990, when only 13.8 percent of adults were obese, and a sizable change from 2015, when 23 percent of the population was obese.[64] As in other countries, the SSB tax in Ireland seems to have been somewhat effective at reducing, or at least accelerating a preexisting trend of reduction in, sugar consumption from soft drinks. However, the SSDT has not been particularly effective at reducing overall sugar consumption and the obesity rate continues to increase despite the imposition of an SSB tax.
Portugal
Portugal has levied a tax on soft drinks with added sweeteners since 2017, with exceptions for milk, juices, and dietary supplements. Beverages with a sugar content of less than 2.5 grams per 100 mL are currently taxed at a rate of €0.0116 per liter, while beverages with more than 2.5 grams but less than 5 grams of sugar per 100 mL are taxed at €0.0695 per liter; beverages with more than 5 but less than 8 grams of sugar per 100 mL are taxed at €0.0926 per liter, and beverages with a sugar content of at least 8 grams per 100 mL are taxed at a rate of €0.2318 per liter.[65]
The Ministry of Finance reports that €60.1 to €80 million is generated from the tax annually.[66] These revenues are not earmarked to any specific program meant to address the health effects of sugar overconsumption but are dedicated to the National Health Service generally.[67]
The excise tax on sugary beverages was largely passed on to consumers, with an estimated pass-through rate of about 100 percent across drinks with different sugar contents.[68] Prior to the tax, high-sugar beverages had been 45 percent of soft drink sales, but within months of tax implementation, high-sugar beverages reportedly accounted for only 27 percent of sales.[69] Studies estimated that the tax’s effect was really a 7 percent reduction in sales.[70]
Some drinks in Portugal experienced reformulation to avoid the tax, resulting in an 11 percent reduction in the total energy consumption from SSBs. Reformulation was found to have a larger effect on public health than any decrease in sales resulting from higher prices of beverages subject to the tax. However, reformulation of these products had been a preexisting trend before the tax’s implementation.[71] Daily adolescent consumers of soda had also already decreased from about 32 percent in 2002 to about 17 percent in 2016.[72]
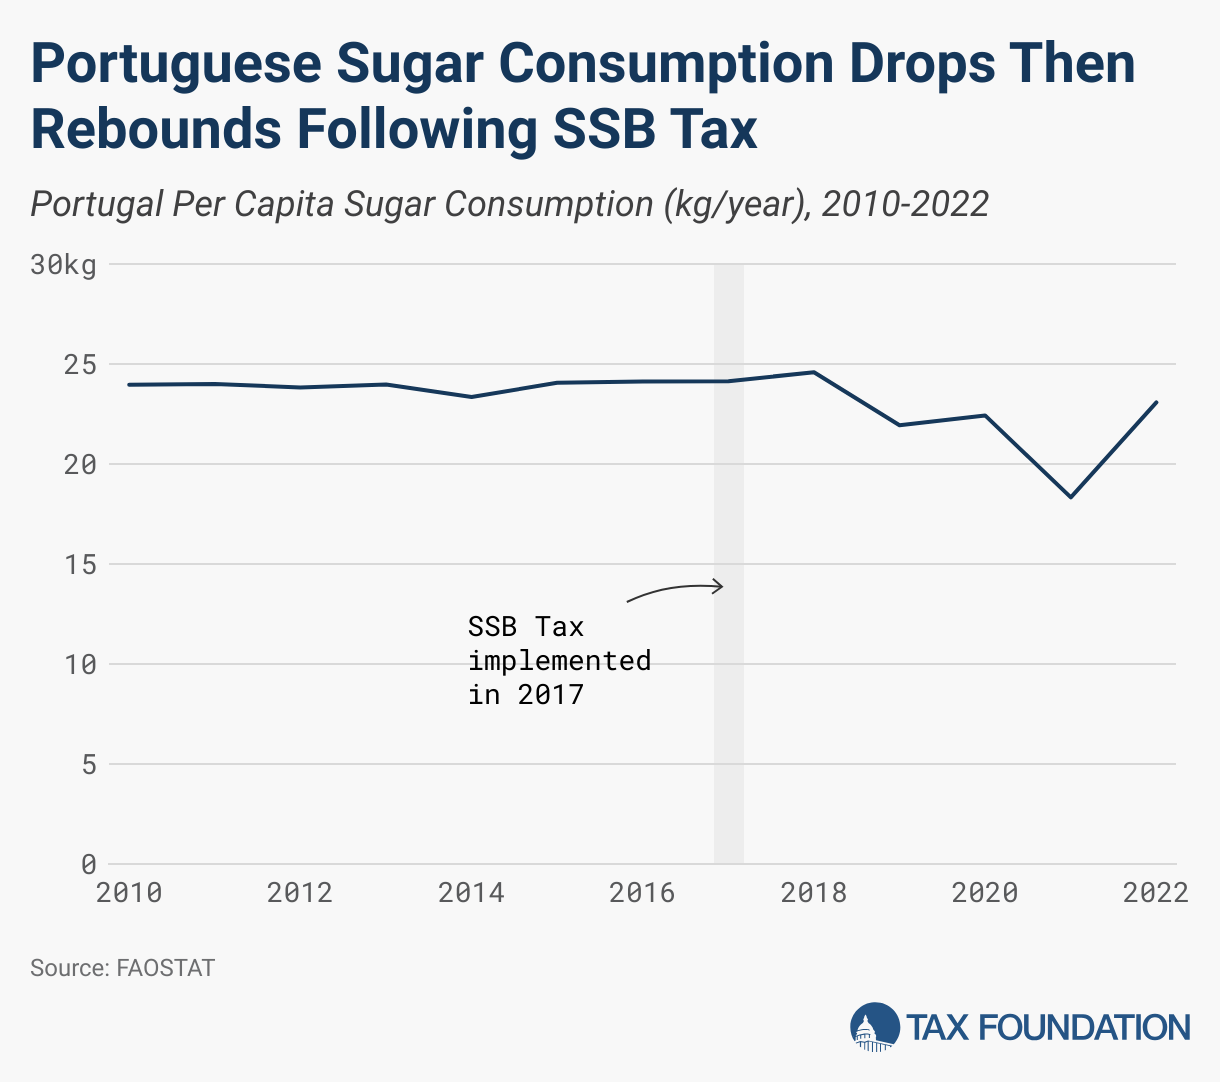
Per capita sugar consumption generally declined in Portugal from 2018 to 2021 but increased again in 2022. In 2010, per capita sugar consumption was 23.96 kg per year, which decreased slightly to 23.08 kg per year in 2022.[73] This is already a comparatively low rate of consumption among EU countries, which may affect the influence that the tax will have.
In 2016, the obesity rate among Portuguese adults was about 20.7 percent. The prevalence of obesity has been steadily increasing in Portugal since at least 2000, when about 13.5 percent of adults were obese.[74] More recent data is necessary to determine if the SSB tax in Portugal has had any impact on the overall health of the country’s population.
Poland
In 2021, Poland began levying a sugar tax on soft drinks with added sweeteners, caffeine, or taurine.[75] Milk and low-sugar fruit and vegetable juices are excluded from the tax. The total tax per liter is the sum of a fixed fee on any covered product of €0.118 and a variable fee of €0.0118 per gram of sugar above 5 grams per 100 mL of beverage. Drinks with no- and low-calorie sweeteners incur the fixed fee but not the variable fee. Drinks with caffeine or taurine are subject to an extra €0.0237, but the total fee per liter cannot be more than €0.284.
The tax was projected to generate €711 million annually but has consistently generated significantly less, only about €364 million annually. These revenues are not dedicated to any specific program meant to address the health effects of sugar consumption but are mostly allocated to the National Health Fund.[76]
Reformulation is estimated to be heavily contributory to the sugar tax revenue being much lower than originally projected. The sugar tax led to a significant increase in soft drink prices, estimated to be approximately 17.5 to 29.5 percent on average depending on the type of store.[77]
Most Poles did not support the levy in 2021, and about half believed it to be a tool primarily aimed at increasing revenues rather than improving public health.[78]
Total per capita sugar consumption from all sources in Poland has been relatively stable, though comparatively high, for more than a decade. In 2010, per capita sugar consumption was 41.33 kg per year, which rose to 46.33 kg per year in 2022.[79] This includes sugar from nonalcoholic beverages, but beverages tend to be a relatively small portion of overall sugar or calorie intake.
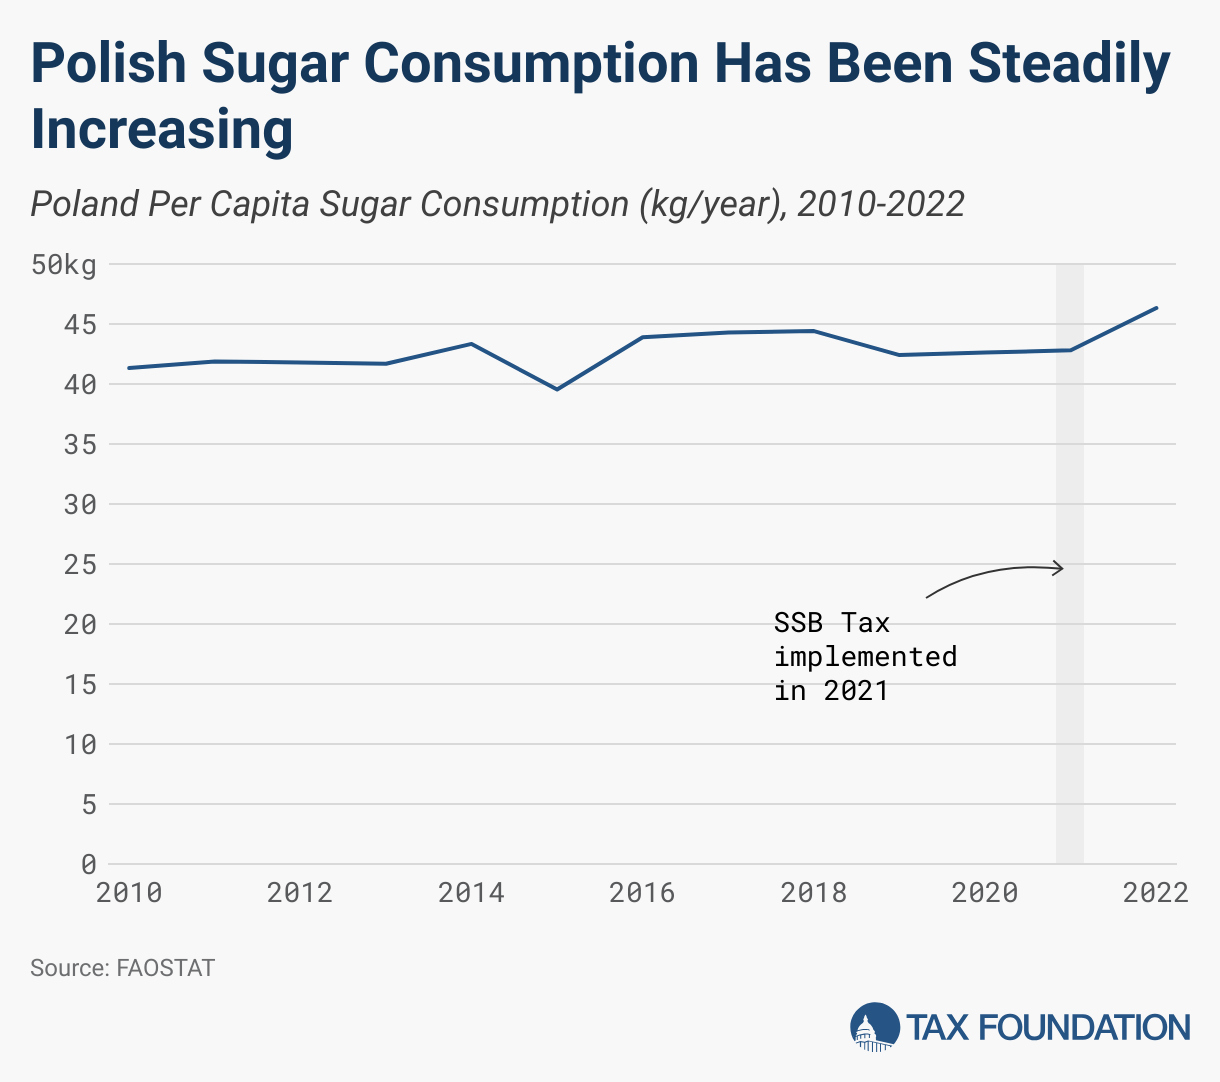
The tax was implemented too recently for an empirical analysis of its effects on public health. There may be more success in Poland than in other countries due to preexisting trends of sugar consumption in the country. Elsewhere, reformulation and reductions in sugar consumption per person had been a preexisting trend before implementation of any SSB taxes. From 2008 to 2017, the average consumption of sugar as an ingredient of food products increased by 11.8 kg per person in Poland.[80] This includes sugary snacks, sugary drinks, and all other food products. Thus, even a plateau of sugar consumption resulting from the SSB tax may be considered an improvement based on existing trends.
However, reformulation in response to the SSB would be limited to only covered beverages. This would still enable consumers to switch to sugary drinks not included in the tax, sugary snacks, or other sources. The narrow base of the SSB, then, may still undermine efforts to reduce obesity rates and improve public health in Poland.
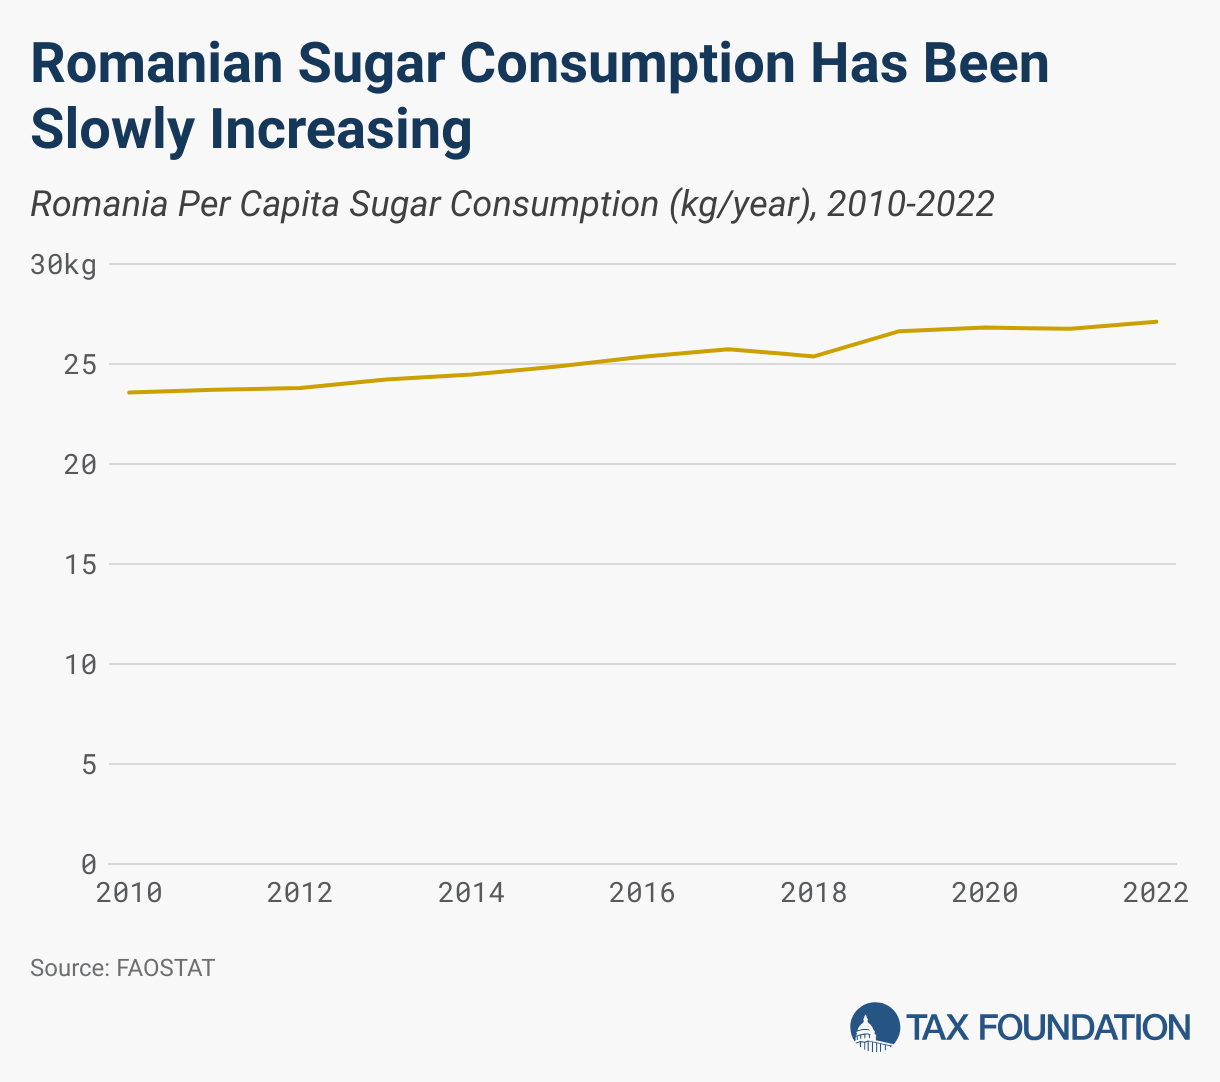
Romania
Romania implemented its sugar tax in 2024. The sugar tax is a tiered excise tax levied on nonalcoholic beverages with added sugar and with a sugar content of at least 5 grams per 100 mL. Beverages between 5 and 8 grams of sugar per 100 mL are subject to a tax of €0.08 per liter and beverages with a sugar content of at least 8 grams of sugar per 100 mL are subject to a tax of €0.12 per liter.[81]
This was only one year after Romania established an elevated VAT rate on sugary beverages in 2023, relative to the reduced rate on other beverages, which still applies in addition to the SSB tax.
There have not yet been any publications from the Ministry of Finance regarding how much revenue the tax generated, but it does not seem as though whatever revenues are generated are dedicated to any health programs.
This tax was levied too recently for there to be any empirical analysis of its effects, but the structure of Romania’s sugar taxes is worth examining.
At the same time as the SSB tax was established in Romania, the country also levied an increased tax on sugary (non-beverage) foods. This was in the form of raising the VAT rate on foods with added sugars (other than bread and biscuits) whose total sugar content was at least 10 grams per 100 grams of food. The VAT rate was raised from 9 percent to 19 percent on those food products.[82]
These taxes were part of a comprehensive package to address Romania’s budget deficit, so the primary aims of the tax may be fiscal rather than health-related.[83] However, the pairing of an elevated VAT rate on sugary drinks and sugary foods is a more neutral treatment of calories from sugar. The addition of an SSB tax on only drinks, however, undermines this neutrality and may inappropriately advantage some businesses and industries over others. Soft drinks account for an average of 3 percent of the daily caloric intake of an adult, so focusing solely on a beverage tax would not have captured a majority amount of sugar consumption.[84] The SSB tax could be broadened in Romania to cover food and other vehicles of sugar consumption to align with the country’s elevated VAT rate on both sugary drinks and foods.
Broadening the base of the sugar tax by including food may have a larger impact on public health. The combined taxes may spur both reformulation and reductions in consumption for sugary drinks and sugary foods—all while generating revenue from both industries. The broader base also makes it much harder for consumers to simply substitute sugary snacks or other products to offset the reduction in sugar consumption from soft drinks.
Romania has had a relatively low but slowly increasing per capita sugar consumption for more than a decade. In 2010, per capita sugar consumption was 23.57 kg per year, which has risen to 27.11 kg per year in 2022.[85]
Romania’s obesity rate has climbed much faster than the country’s sugar consumption. In 2016, about 22.5 percent of adults in Romania were obese, having steadily increased from about 16.1 percent in 2000.[86]
More research is needed to examine the secondary effects of SSB taxes, develop an understanding of the unintended consequences of the policies, and analyze overall changes in consumer behavior to get adequate estimates of overall effect on public health. Romania levying taxes on both sugary beverages and sugary foods could become an inspirational model for sugar or other health taxes across Europe.
Lessons and Conclusion
The empirical evidence thus far on sugar-sweetened beverage taxes fails to support claims that these taxes will create substantial health benefits. At the same time, their structural limitations make them ill-suited for generating stable, equitable revenue. A broader tax on added sugars in all manufactured foods might offer more significant health and fiscal outcomes, but its implementation would be complex, and the regressive nature of food taxes poses serious equity concerns.
The examples of SSB taxes in Europe suggest that even though, in most cases, they are not successful in either raising sustainable revenues or improving public health, an SSB tax is more efficient when its rate is tiered or scaled according to the sugar content of the product being taxed, thereby more effectively targeting sugar consumption and incentivizing more reformulation of products. These results also indicate that exemptions for certain types of high-sugar beverages like milk-based drinks are probably not warranted and may undermine health gains by incentivizing switching to high-sugar beverages that are exempt from the tax.
A primary lesson is that there is not an adequate understanding of the secondary effects of SSB taxes on consumer behavior, and thus on public health. The primary effects are relatively intuitive and seemingly universal. Taxing SSBs increases their price, decreases quantity demand, and encourages producers to reformulate and bring to market products with less sugar.
The secondary effects are less foreseeable. Many experts raise concerns over consumers not reducing consumption but turning to less expensive SSBs. This was one aspect of the failures of a tiered SSB tax in Denmark, which was implemented in 2009 but repealed in 2014 after yielding no health benefits.[87]
Whether and to what degree consumers substitute SSBs with different beverages is largely uncertain, though it could be expected that many consumers do. Understanding whether those substituted beverages are of low sugar content, high sugar content but exempt from the SSB tax, or are more harmful in other ways like beer is crucial to understanding the overall impact on public health.
Another unknown is whether and to what degree consumers make up for reductions in sugar consumption from SSBs with substitutions for sugary snacks or other foods. It is likely that sugary snacks are more contributory to obesity and other health effects than SSBs.[88] Only taxing SSBs may inadvertently spurn more consumption of sugary snacks, substantially offsetting health gains.
Experiences in Europe demonstrate that, while SSB taxes can accelerate reformulation and reductions in sugar consumption from covered sugary beverages, any health gains are largely offset by consumers substituting food or other sources of sugar. This indicates that the narrow bases of SSB taxes are not effective at improving overall public health while unduly burdening one industry over all others and making consumers worse off.
Some studies have emphasized that a broader tax on sugar would be much more effective at reducing sugar consumption than a narrow SSB tax.[89] In addition to more directly capturing the public health harm-causing element, such a tax would also be more neutral and likely easier to comply with. A tax like this, as well as SSB taxes, may be incongruous with current EU policy that subsidizes sugar production, however.[90]
Obesity prevention experts emphasize that SSB consumption is far from the only cause of obesity, and an SSB tax may undermine attempts to address other harmful consumption, sedentary lifestyles, or other contributory factors. An SSB tax alone would likely reduce consumption of SSBs but not have a large impact on total sugar consumption, the other factors contributory to obesity, and overall public health.
Stay informed on the tax policies impacting you.
Subscribe to get insights from our trusted experts delivered straight to your inbox.
SubscribeReferences
[1] World Bank, “SSB Tax Database,” August 2023, https://ssbtax.worldbank.org/.
[2] Elisabeth Mahase, “Obesity: raising price of sugary snacks may be more effective than soft drink tax,” BMJ 366 (2019), https://doi.org/10.1136/bmj.l5436.
[3] Global Food Research Program, “Sweetened soft drink taxes,” UNC-Chapel Hill, October 2024, https://www.globalfoodresearchprogram.org/wp-content/uploads/2024/10/GFRP-UNC_Tax_maps_combined_2024-Oct.pdf.
[4] Francesco Pizzo, ed., “Plastic Tax and Sugar Tax – Further postponement approved by the Italian Government,” PwC, May 24, 2024, https://blog.pwc-tls.it/en/2024/05/24/plastic-tax-and-sugar-tax-further-postponement-approved-by-the-italian-government/.
[5] Tatiana Andreyeva et al., “Outcomes Following Taxation of Sugar-Sweetened Beverages A Systematic Review and Meta-analysis,” JAMA Network Open 5(6), June 1, 2022.
[6] Mabel Andalón and John Gibson, “The ‘Soda Tax’ is Unlikely to Make Mexicans Lighter: New Evidence on Biases in Elasticities of Demand for Soda,” I Z A Institute of Labor Economics, Discussion Paper 10765, May 22, 2017.
[7] S. Seiler, A. Tuchman, and S. Yao, “The Impact of Soda Taxes: Pass-Through, Tax Avoidance, and Nutritional Effects,” Journal of Marketing Research 58:1 (February 2021):22-49, https://doi.org/10.1177/0022243720969401.
[8] A.M. Teng, A.C. Jones, A. Mizdrak, L. Signal, M. Genc, and N. Wilson, “Impact of sugar-sweetened beverage taxes on purchases and dietary intake: systematic review and meta-analysis,” Obesity Reviews 20:9 (September 2019).
[9] Lisa M. Powell and Julien Leider, “Impact of the Seattle Sweetened Beverage Tax on substitution to alcoholic beverages,” Plos One 17:1 (2022):e0262578.
[10] A. Hanks, B. Wansink et. al, “From Coke to Coors: A Field Study of a Fat Tax and its Unintended Consequences,” Journal of Nutrition Education and Behavior 45:4 (July-August 2013):S40.
[11] J.M. Fletcher, D.E. Frisvold, and N. Tefft, “Non-linear effects of soda taxes on consumption and weight outcomes,” Health Economics 24:5 (May 2015):566-582, doi:10.1002/hec.3045.
[12] J.M. Fletcher, D.E. Frisvold, and N. Tefft, “The effects of soft drink taxes on child and adolescent consumption and weight outcomes,” Journal of Public Economics 94:11-12 (December 2010):967-974, doi:10.1016/j.jpubeco.2010.09.005.
[13] J.M. Fletcher, D. Frisvold, and N. Tefft, “Taxing soft drinks and restricting access to vending machines to curb child obesity,” Health Affairs 29:5 (May 2010):1059-1066.
[14] T. Pak, “The Unequal Distribution of Body Mass Index: Examining the Effect of State-Level Soft Drink Taxes on Obesity Inequality,” Thesis, University of Georgia, May 2013.
[15] J.M. Fletcher, D.E. Frisvold, and N. Tefft, “Non-linear effects of soda taxes on consumption and weight outcomes.”
[16] Mabel Andalón and John Gibson, “The ‘Soda Tax’ is Unlikely to Make Mexicans Lighter: New Evidence on Biases in Elasticities of Demand for Soda.”
[17] J. Cawley, D. Frisvold, A. Hill, and D. Jones, “The impact of the Philadelphia beverage tax on purchases and consumption by adults and children,” Journal of Health Economics 67 (September 2019):102225, https://www.sciencedirect.com/science/article/abs/pii/S0167629618309494.
[18] S. Seiler S, A. Tuchman, and S. Yao, “The impact of soda taxes: pass-through, tax avoidance, and nutritional effects.”
[19] L. Powell, J. Leider, and P. Léger, “The impact of a sweetened beverage tax on beverage volume sold in Cook County, Illinois, and its border area,” Annals of Internal Medicine 172:6 (Feb. 25, 2020):390-397. https://www.acpjournals.org/doi/10.7326/M19-2961.
[20] Boston Consulting Group, “Danes’ cross-border trade,” March 2021, https://www.vsod.dk/media/1652/210308_graensehandelsanalyse_bcg-og-fonden-af-1-okt-1959_vf.pdf.
[21] E. Baskin, and S.P. Coary, “Implications of the Philadelphia beverage tax on sales and beverage substitution for a major grocery retailer chain,” Journal of International & Food Agribusiness Marketing 31:3 (2019):293-307, doi:10.1080/08974438.2018.1520180.
[22] C.A. Roberto, H.G. Lawman, HG, M.T. LeVasseur, et al., “Association of a beverage tax on sugar-sweetened and artificially sweetened beverages with changes in beverage prices and sales at chain retailers in a large urban setting,” JAMA 321:18 (May 2019):1799-1810, doi:10.1001/jama.2019.4249.
[23] Adam J. Hoffer and Donald J. Lacombe, “Excise tax setting in a dynamic space-time framework,” Public Finance Review 45:5 (2017):628-646.
[24] E. Eykelenboom, S. Djojosoeparto, M. Stralen, et al., “Stakeholder views on taxation of sugar-sweetened beverages and its adoption in the Netherlands,” Health Promotion International 37:2 (April 2022), https://doi.org/10.1093/heapro/daab114.
[25] Directorate for Legal and Administrative Information, “Taxation of Beverages,” French Republic, Jan. 1, 2025, https://entreprendre.service-public.fr/vosdroits/F32101?lang=en.
[26] Nicoletta Berardi et al., “The impact of a ‘soda tax’ on prices: evidence from French micro data,” Applied Economics 48:41 (March 2016), https://doi.org/10.1080/00036846.2016.1150946; and S. Capacci, O. Allais, C. Bonnet, and M. Mazzocchi, “The impact of the French soda tax on prices and purchases. An ex post evaluation,” PLoS One 14:10 (October 2019), https://doi.org/10.1371/journal.pone.0223196.
[27] A. Chatelan, M. Rouche, A. Dzielska, et al., “Sixteen-year trends in adolescent consumption of sugar-sweetened soda in six European countries with a soda tax and comparison countries: a repeated cross-sectional survey analysis,” Public Health Nutrition 26:3 (March 2023), https://doi.org/10.1017/S1368980022002361.
[28] Marie-Cecile Renault, “Increase the ‘soda tax’ to better fight obesity,” Economie, Oct. 19, 2023, https://www.lefigaro.fr/conjoncture/hausse-de-la-taxe-soda-pour-mieux-lutter-contre-l-obesite-20231019; Y. Bodo, F. Etile, C. Julia, et al., “Public health lessons from the French 2012 soda tax and insights on the modifications enacted in 2018,” Health Policy 126:7 (July 2022), https://doi.org/10.1016/j.healthpol.2022.04.012; and S. Capacci, O. Allais, C. Bonnet, and Mazzocchi M, “The impact of the French soda tax on prices and purchases. An ex post evaluation.”
[29] Food and Agricultural Organization of the United Nations, “Food Balances (2010-),” FAOSTAT, July 19, 2024, https://www.fao.org/faostat/en/#data/FBS.
[30] Nathalie Vauterin, “Obesity is on the rise in France according to the latest epidemiological survey,” C3 Collaborating for Health, https://www.c3health.org/obesity-is-on-the-rise-in-france-according-to-the-latest-epidemiological-survey/.
[31] Sarda B, Debras C, Chazelas E, et al., “Public perception of the tax on sweetened beverages in France,” Public Health Nutrition 25:11 (2022), https://doi.org/10.1017/S1368980022001665.
[32] World Health Organization, “Global report on the use of sugar-sweetened beverage taxes,” WHO, 2023, https://iris.who.int/bitstream/handle/10665/374530/9789240084995-eng.pdf?sequence=1; Ministry of Action and Public Accounts, “Tariffs of duties on alcohol, alcoholic beverages, and non-alcoholic beverages applicable on 1 January 2019,” French Republic, December 18, 2018, https://www.douane.gouv.fr/sites/default/files/bod/src/dana/da/Contributions%20indirectes_18-070.pdf?lang=en; and Alex Ledsom, “France’s proposed new sugar tax could transform the biggest food companies—will the consumer pay the price?” Fortune, Dec. 1, 2024, https://fortune.com/europe/2024/12/01/france-new-sugar-tax-could-transform-the-biggest-food-companies-consumer-pay-price-mcdonalds-krispy-kreme/.
[33] Zane Lilley, “French senate votes for increase in taxes on tobacco, gambling, and soda,” The Connexion, Nov. 22, 2024, https://www.connexionfrance.com/news/french-senate-votes-for-increase-in-taxes-on-tobacco-gambling-and-soda/690999.
[34] Ministry of Finance, “Increase in tax on non-alcoholic beverages,” Government of the Netherlands, https://www.rijksoverheid.nl/onderwerpen/koopkracht/verhoging-belasting-op-frisdrank.
[35] Ministry of Finance, “Note on the state of the State Finances,” Tweede Kamer, Sept. 20, 2022, https://www.tweedekamer.nl/kamerstukken/brieven_regering/detail?id=2022D34541&did=2022D34541.
[36] Maarten van Ooijen, “Netherlands considering several possible sugar taxes on soft drinks,” NL Times, Apr. 26, 2024, https://nltimes.nl/2024/04/26/netherlands-considering-several-possible-sugar-taxes-soft-drinks.
[37] House of Representatives of the States General, “Tax legislation with matrix,” Tweede Kamer, June 3, 2022, https://www.tweedekamer.nl/kamerstukken/detail?id=2022D23037&did=2022D23037; and Official Gazette of the Kingdom of the Netherlands, “656 Act of 22 December 2021,” https://www.eerstekamer.nl/behandeling/20211227/publicatie_wet_5/document3/f=/vlp2ei9ua7wx.pdf.
[38] A. Chatelan, M. Rouche, A. Dzielska, et al., “Sixteen-year trends in adolescent consumption of sugar-sweetened soda in six European countries with a soda tax and comparison countries: a repeated cross-sectional survey analysis.”
[39] Marit van der Hoek, “Dutch Reviewing Options for a Sugar Tax,” USDA, Nov. 29, 2022, https://apps.fas.usda.gov/newgainapi/api/Report/DownloadReportByFileName?fileName=Dutch%20Reviewing%20Options%20for%20a%20Sugar%20Tax_The%20Hague_Netherlands_NL2022-0063.pdf; National Institute for Public Health and the Environment, “The diet of the Dutch,” 2020, https://www.rivm.nl/bibliotheek/rapporten/2020-0083.pdf.
[40] Food and Agricultural Organization of the United Nations, “Food Balances (2010-).”
[41] Central Bureau of Statistics Netherlands, “Obesity rate has tripled in the last 40 years,” Apr. 3, 2024, https://www.cbs.nl/en-gb/news/2024/10/obesity-rate-has-tripled-in-the-last-40-years.
[42] Marit van der Hoek, “Dutch Reviewing Options for a Sugar Tax”; M. Eykelenboom, M. Olthof, M. Stralen, et al., “The effects of a sugar-sweetened beverage tax and a nutrient profiling tax based on Nutri-Score on consumer food purchases in a virtual supermarket: a randomized controlled trial,” Public Health Nutrition 25:4 (November 2021), https://doi.org/10.1017/S1368980021004547.
[43] E. Eykelenboom, S. Djojosoeparto, M. Stralen, et al., “Stakeholder views on taxation of sugar-sweetened beverages and its adoption in the Netherlands.”
[44] UK Statutory Instruments, “The Soft Drinks Industry Levy Regulations 2018,” 2018 No. 41, https://www.legislation.gov.uk/uksi/2018/41/contents/made.
[45] Rachel Arthur, “UK looks to expand sugar tax,” Beverage Daily, Nov. 5, 2024, https://www.beveragedaily.com/Article/2024/11/04/UK-looks-to-expand-sugar-tax/.
[46] HM Treasury and HM Revenue & Customs, “HMT-HMRC Soft Drinks Industry Levy Review,” Oct. 30, 2024, https://www.gov.uk/government/publications/soft-drinks-industry-levy-review/hmt-hmrc-soft-drinks-industry-levy-review.
[47] HM Revenue & Customs, “Soft Drinks Industry Levy,” Dec. 5, 2016, https://www.gov.uk/government/publications/soft-drinks-industry-levy/soft-drinks-industry-levy; HM Revenue & Customs, “Soft Drinks Industry Levy statistics commentary 2024,” Sept. 27, 2024, https://www.gov.uk/government/statistics/soft-drinks-industry-levy-statistics/soft-drinks-industry-levy-statistics-commentary-2021.
[48] HM Revenue & Customs, “Soft Drinks Industry Levy uprating,” Oct. 30, 2024, https://www.gov.uk/government/publications/increasing-the-rates-of-the-soft-drinks-industry-levy/soft-drinks-industry-levy-uprating.
[49] HM Treasury, “Soft Drinks Industry Levy: 12 things you should know,” Aug. 18, 2016, https://www.gov.uk/government/news/soft-drinks-industry-levy-12-things-you-should-know; and Iona Vlad and Jennifer O’Mara, “Looking back at 5 years of the UK Soft Drinks Industry Levy,” World Cancer Research Fund, Mar. 30, 2023, https://www.wcrf.org/about-us/news-and-blogs/looking-back-at-5-years-of-the-uk-soft-drinks-industry-levy/.
[50] M. Luick, L. Bandy, R. Harrington, et al., “The impact of the UK soft drink industry levy on the soft drink marketplace, 2017-2020: An interrupted time series analysis with comparator series,” PLoS One 19:6 (2024), https://doi.org/10.1371/journal.pone.0301890.
[51] Rachel Arthur, “UK looks to expand sugar tax”; HM Revenue & Customs, “Soft Drinks Industry Levy”; HM Revenue & Customs, “Soft Drinks Industry Levy uprating.”
[52] Office for Health Improvement & Disparities, “Sugar reduction and reformulation progress report 2015 to 2020,” Dec. 1, 2022, https://assets.publishing.service.gov.uk/media/6388cd71d3bf7f328c0ded27/Sugar-reduction-and-reformulation-progress-report-2015-to-2020.pdf.
[53] National Health Service, “Health Survey for England, 2022 Part 2,” Sept. 24, 2024, https://digital.nhs.uk/data-and-information/publications/statistical/health-survey-for-england/2022-part-2/adult-overweight-and-obesity; and Office for Health Improvement & Disparities, “Obesity Profile: short statistical commentary May 2024,” May 8, 2024, https://www.gov.uk/government/statistics/update-to-the-obesity-profile-on-fingertips/obesity-profile-short-statistical-commentary-may-2024.
[54] Food and Agricultural Organization of the United Nations, “Food Balances (2010-).”
[55] National Food Strategy, “The Plan,” 2021, https://www.nationalfoodstrategy.org/.
[56] Revenue Irish Tax and Customs, “Sugar Sweetened Drinks Tax (SSDT),” June 4, 2024, https://www.revenue.ie/en/companies-and-charities/excise-and-licences/sugar-sweetened-drinks-tax/rate-of-tax.aspx; and Conor Pope, “The sugar tax: questions and answers,” The Irish Times, Apr. 30, 2018, https://www.irishtimes.com/news/ireland/irish-news/the-sugar-tax-questions-and-answers-1.3479487.
[57] Paul Hosford, “Campaigners want €31m from sugar tax ringfenced to fight obesity,” Irish Examiner, Apr. 11, 2021, https://www.irishexaminer.com/news/arid-40263365.html.
[58] F. Houghton, J. Stritch, J. Auerbach, et al., “Exploring the Sugar Sweetened Drinks Tax (Sugar Tax) Pass Through Rate in the Irish Hospitality Sector,” BMC Public Health 24:2360 (2024), https://doi.org/10.1186/s12889-024-19891-y.
[59] F. Houghton, J. Stritch, and J. Auerbach, “Evaluation of Ireland’s Sugar-Sweetened Drinks’ Tax (SSDT),” Munster Research Consultancy, 2024, https://www.gov.ie/pdf/?file=https://assets.gov.ie/306044/6588fc8d-54a2-4749-b931-ffdb3a0de68a.pdf.
[60] A. Chatelan, T. Lebacq, M. Rouche, et al., “Long-term trends in the consumption of sugary and diet soft drinks among adolescents: a cross-national survey in 21 European countries,” European Journal of Nutrition 61 (2022), https://doi.org/10.1007/s00394-022-02851-w.
[61] Department of Health, “Minister for Health publishes Evaluation of the Sugar-Sweetened Drinks Tax,” Sept. 27, 2024, https://www.gov.ie/en/press-release/5c3e0-minister-for-health-publishes-evaluation-of-the-sugar-sweetened-drinks-tax/.
[62] F. Houghton, J. Stritch, and J. Auerbach, “Evaluation of Ireland’s Sugar-Sweetened Drinks’ Tax (SSDT).”
[63] Food and Agricultural Organization of the United Nations, “Food Balances (2010-).”
[64] Irish Medical Times, “Almost one-in-four people in Ireland living with obesity,” Mar. 1, 2024, https://www.imt.ie/news/almost-one-in-four-people-in-ireland-living-with-obesity-01-03-2024/; and Health Service Executive, “Healthy Eating and Active Living Programme Key Facts,” https://www.hse.ie/eng/about/who/healthwellbeing/our-priority-programmes/heal/key-facts/.
[65] Assembly of the Republic, “Law No. 42/2016, of 28 December,” Dec. 28, 2016, https://diariodarepublica.pt/dr/detalhe/lei/42-2016-105637672.
[66] Branislav Pekic, “Soft Drink Sales in Portugal Down 25% Following Sugar Tax,” European Supermarket Magazine, Sept. 26, 2017, https://www.esmmagazine.com/a-brands/soft-drinks-sales-portugal-sugar-tax-49532; and J. Goncalves, R. Merenda, and J. Santos, “IZA DP No. 15968: Not So Sweet: Impacts of a Soda Tax on Producers,” International Tax and Public Finance 31 (2024), https://www.iza.org/publications/dp/15968/not-so-sweet-impacts-of-a-soda-tax-on-producers.
[67] Lusa, “Government to increase tax on sugary drinks,” The Portugal News, Oct. 18, 2021, https://www.theportugalnews.com/news/2021-10-18/government-to-increases-tax-on-sugary-drinks/63010; World Health Organization, “Global report on the use of sugar-sweetened beverage taxes.”
[68] Rui Albuquerque, “Evaluating the effects of the soda tax on prices and consumption in Portugal,” Portuguese Economy Research Report, Oct. 3, 2019, https://research.pej.pt/2019/10/03/evaluating-the-effects-of-the-soda-tax-on-prices-and-consumption-in-portugal/; J. Santos and J. Goncalves J, “Brown Sugar, how come you taste so good? The impact of a soda tax on prices and consumption,” GEE Papers 00124 (2019), https://ideas.repec.org/p/mde/wpaper/00124.html.
[69] Antonio Larguesa, “New tax on soft drinks has already yielded almost 50 million,” Journal de Negocios, Sept. 18, 2017, https://www.jornaldenegocios.pt/economia/saude/detalhe/novo-imposto-sobre-refrigerantes-ja-rendeu-quase-50-milhoes.
[70] F. Goiana-da-Silva, D. Cruz-e-Silva, M. Gregorio, et al., “The future of the sweetened beverages tax in Portugal,” The Lancet Public Health 3:12 (December 2018), https://www.thelancet.com/journals/lanpub/article/PIIS2468-2667%2818%2930240-8/fulltext; J. Goncalves, R. Merenda, and J. Santos J, “IZA DP No. 15968: Not So Sweet: Impacts of a Soda Tax on Producers”; F. Goiana-da-Silva, A. Nunes, M. Miraldo, et al., “Using Pricing Policies to Promote Public Health: The Sugar Sweetened Beverages Taxation Experience in Portugal,” Acta Medica Portuguesa 31:4 (April 2018), https://doi.org/10.20344/amp.10222.
[71] F. Goiana-da-Silva, D. Cruz-e-Silva, M. Gregorio, et al., “The future of the sweetened beverages tax in Portugal”; Working Group, “Impact of Excise Duty on Sugary and Sweetened Beverages,” June 30, 2018, https://www.portugal.gov.pt/download-ficheiros/ficheiro.aspx?v=%3D%3DBAAAAB%2BLCAAAAAAABAAzM7I0AQCQMNv8.
[72] A. Chatelan, M. Rouche, A. Dzielska, et al., “Sixteen-year trends in adolescent consumption of sugar-sweetened soda in six European countries with a soda tax and comparison countries: a repeated cross-sectional survey analysis.”
[73] Food and Agricultural Organization of the United Nations, “Food Balances (2010-).”
[74] Global Nutrition Report, “Portugal Nutrition Profile,” https://globalnutritionreport.org/resources/nutrition-profiles/europe/southern-europe/portugal/.
[75] Ministry of Finance, “Sugar tax – who is obliged to pay,” Biznes PL, Oct. 4, 2022, https://www.biznes.gov.pl/pl/portal/00252.
[76] Poland Zalewski Consulting, “Sugar Tax Revenue Falls Short of Expectations for Third Consecutive Year,” PZC, Dec. 15, 2023, https://zalewskiconsulting.pl/sugar-tax-revenue-falls-short-of-expectations-for-third-consecutive-year/; and PwC Poland, “The effects of the sugar tax,” PwC, https://www.pwc.pl/en/articles/sugar-tax.html.
[77] Portal Spozywczy, “Sugar tax in practice (analysis),” Feb. 24, 2021, https://www.portalspozywczy.pl/napoje/wiadomosci/podatek-cukrowy-w-praktyce-analiza,195815.html.
[78] Piotr Mazurkiewicz, “Sugar tax will bring an increase in prices in stores,” Rzeczpospolita, Nov. 20, 2020, https://www.rp.pl/przemysl-spozywczy/art413801-podatek-cukrowy-przyniesie-wzrost-cen-w-sklepach; and Zosia Wanat, “Poles fume over price of coke after new sugar tax,” Politico, Jan. 8, 2021, https://www.politico.eu/article/poland-coke-pepsi-price-sugar-tax/.
[79] Food and Agricultural Organization of the United Nations, “Food Balances (2010-).”
[80] Analysis and Strategy Department, “Sugar, obesity – consequences,” National Health Fund, https://www.nfz.gov.pl/download/gfx/nfz/pl/defaultaktualnosci/370/7296/1/raport_-_cukier.pdf; Zosia Wanat, “Poles fume over price of coke after new sugar tax.”
[81] Parliament of Romania, “Law no. 296 of October 26, 2023,” https://legislatie.just.ro/Public/DetaliiDocument/275745.
[82] Dario Dongo, “Romania, a ‘sugar tax’ to mitigate obesity,” Great Italian Food Trade, Oct. 30, 2023, https://www.greatitalianfoodtrade.it/en/salute/romania-una-sugar-tax-per-mitigare-lobesita/.
[83] Adriana Stoian, “Romania introduces massive tax changes,” Schonherr, Nov. 6, 2023, https://www.schoenherr.eu/content/romania-introduces-massive-tax-changes/; Sugar Online, “ROMANIA: Government plans sugar tax rise to boost budget revenue,” July 6, 2022, https://www.sugaronline.com/2022/07/06/romania-government-plans-sugar-tax-rise-to-boost-budget-revenue/.
[84] Progresiv, “The government wants to introduce a tax on soft drinks with sugar, under the pressure of the budget deficit,” Aug. 5, 2019, https://revistaprogresiv.ro/arhive/government-wants-introduce-tax-soft-drinks-sugar-under-pressure-budget-deficit/.
[85] Food and Agricultural Organization of the United Nations, “Food Balances (2010-).”
[86] Global Nutrition Report, “Romania Nutrition Profile,” https://globalnutritionreport.org/resources/nutrition-profiles/europe/eastern-europe/romania/.
[87] Brukało K, Kaczmarek K, Kowalski O, et al., “Implementation of sugar-sweetened beverages tax and its perception among public health stakeholders. A study from Poland,” Frontiers in Nutrition 9 (2022), https://doi.org/10.3389/fnut.2022.957256; Bill Wirtz, “France’s New Sugar Tax Is Bitterly Ironic,” FEE, Oct. 31, 2017, https://fee.org/articles/frances-new-sugar-tax-is-bitterly-ironic/; and Progresiv, “The government wants to introduce a tax on soft drinks with sugar, under the pressure of the budget deficit.”
[88] Elisabeth Mahase, “Obesity: raising price of sugary snacks may be more effective than soft drink tax,” BMJ 366 (2019), https://doi.org/10.1136/bmj.l5436.
[89] M. Eykelenboom, M. Olthof, M. Stralen, et al., “The effects of a sugar-sweetened beverage tax and a nutrient profiling tax based on Nutri-Score on consumer food purchases in a virtual supermarket: a randomized controlled trial”; Matthew Harding and Michael Lovenheim, “The effect of prices on nutrition: Comparing the impact of product- and nutrient-specific taxes,” Journal of Health Economics 53 (May 2017), https://doi.org/10.1016/j.jhealeco.2017.02.003.
[90] EU Agriculture and Rural Development, “Sugar,” European Commission, https://agriculture.ec.europa.eu/farming/crop-productions-and-plant-based-products/sugar_en.
Share this article