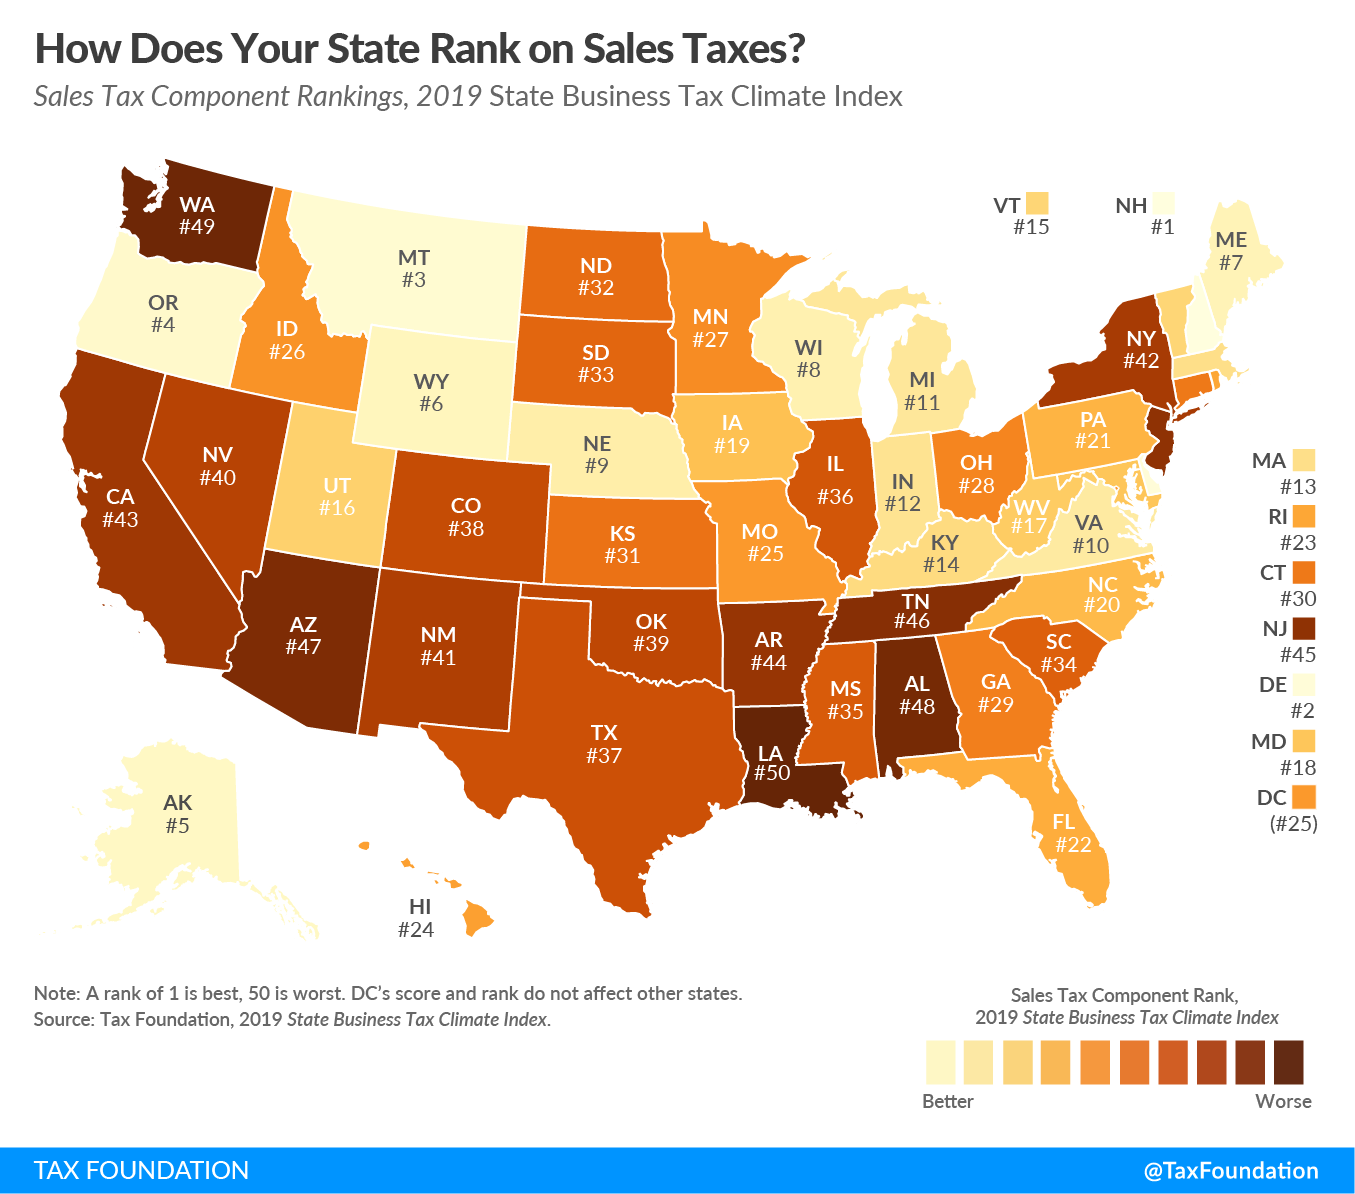
Today we continue our map series on the 2019 State Business Tax Climate Index with a map showing states’ rankings on the Index’s sales tax component. The sales tax component accounts for 25.3 percent of each state’s overall Index score.
A state’s sales taxA sales tax is levied on retail sales of goods and services and, ideally, should apply to all final consumption with few exemptions. Many governments exempt goods like groceries; base broadening, such as including groceries, could keep rates lower. A sales tax should exempt business-to-business transactions which, when taxed, cause tax pyramiding. rate and structure can make a state more or less attractive to businesses for two key reasons: (1) some states apply the sales taxA tax is a mandatory payment or charge collected by local, state, and national governments from individuals or businesses to cover the costs of general government services, goods, and activities. to business inputs, which drives up the costs of production, and (2) as sales tax rates increase, consumers may cut back on purchases or move their shopping to lower-tax jurisdictions.
An ideal sales tax applies to a broad base of final consumer goods and services, with few exemptions, and is levied at a low rate. Broad-based, low-rate tax structures minimize tax-induced economic distortions that can occur when consumers alter their purchasing behavior due to tax differentials. In addition, sales tax exemptions narrow the tax base, driving up the sales tax rate on those goods and services that remain subject to the tax, making the rate higher than otherwise necessary.
Importantly, a well-structured sales tax applies to the end-user at the point of sale but does not apply to the sale of machinery, raw materials, and other business inputs, as those taxes increase the costs of production and ultimately get passed along to consumers in the form of higher prices. States that avoid taxing business inputs perform better on the Index.
[newsletter_inline_widget campaign=”//TaxFoundation.us1.list-manage.com/subscribe/post?u=fefb55dc846b4d629857464f8&id=4b9873a934″ title=”Get Updates About Tax Policy in Your State”]
Note: This is part of a map series in which we will examine each of the five major components of our 2019 State Business Tax Climate Index.
As shown on the map above, the highest-scoring states are those without a state sales tax: New Hampshire, Delaware, Montana, Oregon, and Alaska. The states with the next best scores–Wyoming, Maine, Wisconsin, Nebraska, Virginia, Michigan, and Indiana–have well-structured sales taxes and modest excise tax rates.
The lowest-scoring states on this component are states that have high sales tax rates, high excise taxAn excise tax is a tax imposed on a specific good or activity. Excise taxes are commonly levied on cigarettes, alcoholic beverages, soda, gasoline, insurance premiums, amusement activities, and betting, and typically make up a relatively small and volatile portion of state and local and, to a lesser extent, federal tax collections. rates, or apply the sales tax to a variety of business inputs. The states with the lowest scores on this component are Louisiana, Washington, Alabama, Arizona, Tennessee, and New Jersey.
To learn more about your state’s score on the sales tax component, click here.
To see whether your state’s sales tax structure has become more or less competitive in recent years, check out the table below.
| 2016 Rank | 2017 Rank | 2018 Rank | 2019 Rank | Rank Change from 2018 to 2019 | |
|---|---|---|---|---|---|
|
Note: A rank of 1 is best, 50 is worst. All scores are for fiscal years. DC’s score and rank do not affect other states. Source: Tax Foundation. |
|||||
| Alabama | 48 | 48 | 48 | 48 | 0 |
| Alaska | 5 | 5 | 5 | 5 | 0 |
| Arizona | 46 | 47 | 47 | 47 | 0 |
| Arkansas | 47 | 44 | 44 | 44 | 0 |
| California | 42 | 40 | 41 | 43 | -2 |
| Colorado | 39 | 39 | 39 | 38 | +1 |
| Connecticut | 30 | 29 | 28 | 30 | -2 |
| Delaware | 1 | 1 | 1 | 2 | -1 |
| Florida | 22 | 22 | 22 | 22 | 0 |
| Georgia | 35 | 34 | 29 | 29 | 0 |
| Hawaii | 24 | 26 | 26 | 24 | +2 |
| Idaho | 28 | 27 | 27 | 26 | +1 |
| Illinois | 34 | 35 | 35 | 36 | -1 |
| Indiana | 17 | 12 | 10 | 12 | -2 |
| Iowa | 19 | 20 | 19 | 19 | 0 |
| Kansas | 33 | 28 | 31 | 31 | 0 |
| Kentucky | 14 | 13 | 14 | 14 | 0 |
| Louisiana | 49 | 50 | 50 | 50 | 0 |
| Maine | 8 | 8 | 8 | 7 | +1 |
| Maryland | 16 | 17 | 18 | 18 | 0 |
| Massachusetts | 18 | 18 | 13 | 13 | 0 |
| Michigan | 10 | 11 | 12 | 11 | +1 |
| Minnesota | 26 | 25 | 25 | 27 | -2 |
| Mississippi | 38 | 38 | 38 | 35 | +3 |
| Missouri | 25 | 24 | 24 | 25 | -1 |
| Montana | 3 | 3 | 3 | 3 | 0 |
| Nebraska | 9 | 9 | 9 | 9 | 0 |
| Nevada | 40 | 41 | 42 | 40 | +2 |
| New Hampshire | 2 | 2 | 2 | 1 | +1 |
| New Jersey | 44 | 45 | 46 | 45 | +1 |
| New Mexico | 41 | 42 | 40 | 41 | -1 |
| New York | 43 | 43 | 43 | 42 | +1 |
| North Carolina | 20 | 19 | 20 | 20 | 0 |
| North Dakota | 32 | 32 | 32 | 32 | 0 |
| Ohio | 29 | 31 | 30 | 28 | +2 |
| Oklahoma | 36 | 36 | 36 | 39 | -3 |
| Oregon | 4 | 4 | 4 | 4 | 0 |
| Pennsylvania | 21 | 21 | 21 | 21 | 0 |
| Rhode Island | 23 | 23 | 23 | 23 | 0 |
| South Carolina | 31 | 30 | 33 | 34 | -1 |
| South Dakota | 27 | 33 | 34 | 33 | +1 |
| Tennessee | 45 | 46 | 45 | 46 | -1 |
| Texas | 37 | 37 | 37 | 37 | 0 |
| Utah | 13 | 16 | 17 | 16 | +1 |
| Vermont | 15 | 15 | 16 | 15 | +1 |
| Virginia | 11 | 10 | 11 | 10 | +1 |
| Washington | 50 | 49 | 49 | 49 | 0 |
| West Virginia | 12 | 14 | 15 | 17 | -2 |
| Wisconsin | 7 | 7 | 7 | 8 | -1 |
| Wyoming | 6 | 6 | 6 | 6 | 0 |
| District of Columbia | 27 | 27 | 27 | 25 | +2 |
To learn more about how we determined these rankings, read our full methodology here.
[newsletter_inline_widget campaign=”//TaxFoundation.us1.list-manage.com/subscribe/post?u=fefb55dc846b4d629857464f8&id=4b9873a934″ title=”Get Updates About Tax Policy in Your State”]
Share this article