This week’s map examines states’ rankings on the individual income taxAn individual income tax (or personal income tax) is levied on the wages, salaries, investments, or other forms of income an individual or household earns. The U.S. imposes a progressive income tax where rates increase with income. The Federal Income Tax was established in 1913 with the ratification of the 16th Amendment. Though barely 100 years old, individual income taxes are the largest source component of the 2019 State Business Tax Climate Index. The individual income tax component is the most heavily weighted in the Index, accounting for 30.1 percent of a state’s overall rank, because this is the component for which states have the greatest degree of structural variability.
The individual income tax is important to businesses because states taxA tax is a mandatory payment or charge collected by local, state, and national governments from individuals or businesses to cover the costs of general government services, goods, and activities. sole proprietorships, partnerships, and in most cases, limited liability companies (LLCs) and S corporations, under the individual income tax code. However, even traditional C corporations are indirectly impacted by the individual income tax, as this tax influences the location decisions of individuals, potentially impacting the state’s labor supply.
States that score well on the Index’s individual income tax component usually have a flat, low rate with few deductions and exemptions. They also tend to protect married taxpayers from being taxed more heavily if they file jointly than they would be if filing as two single individuals. In addition, states perform better on the Index’s individual income tax component if they index their brackets, deductions, and exemptions for inflation, which improves revenue stability.
[newsletter_inline_widget campaign=”//TaxFoundation.us1.list-manage.com/subscribe/post?u=fefb55dc846b4d629857464f8&id=4b9873a934″ title=”Get Updates About Tax Policy in Your State”]
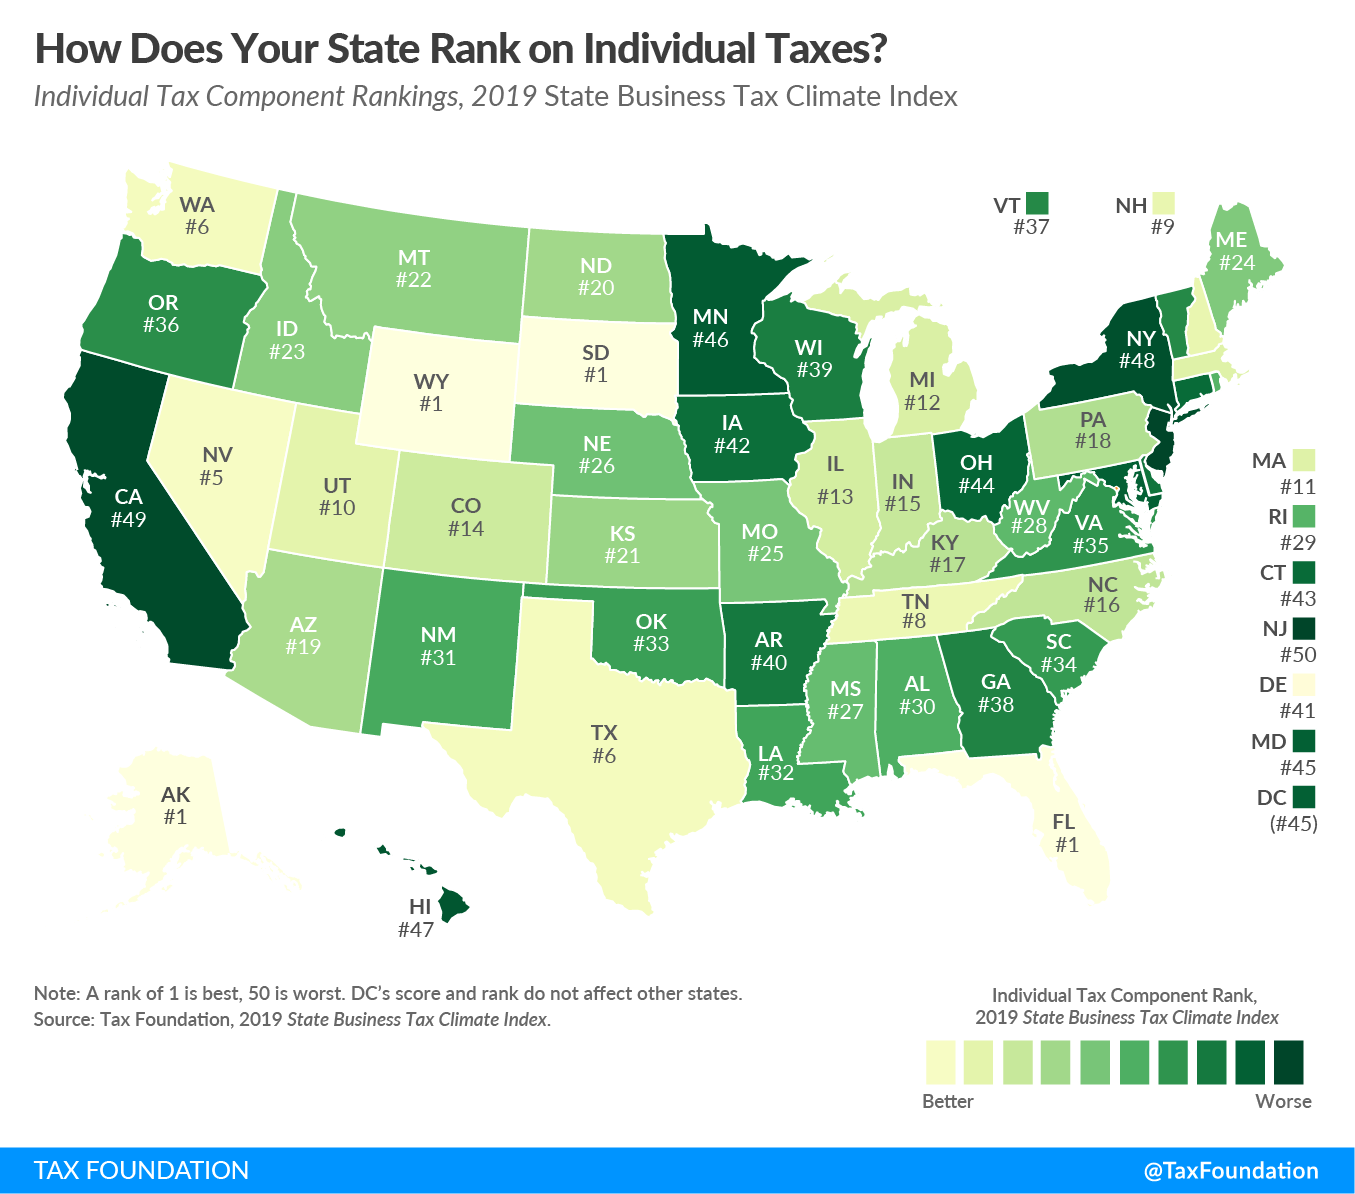
Some states show a perfect score on the individual income tax component because they have no individual income tax and no payroll taxes besides the unemployment insurance tax: Alaska, Florida, South Dakota, and Wyoming. The next highest-scoring states are Nevada, Texas, Washington, Tennessee, and New Hampshire. Nevada taxes wage income at a low rate under the state’s Modified Business Tax but does not tax investment income. Meanwhile, Tennessee and New Hampshire tax interest and dividends but not wage income. Texas and Washington do not tax wage income, but because they apply their gross receipts taxes to LLCs and S corporations instead of taxing them under the individual income tax code, they do not receive a perfect score on this component. Other states that score well on the individual income tax component are Colorado, Illinois, Indiana, Massachusetts, Michigan, North Carolina, Pennsylvania, and Utah, because they all have a single, low tax rate.
States that score poorly on this component are those that tend to have high tax rates and very progressive bracket structures. They generally fail to index their brackets, exemptions, and deductions for inflationInflation is when the general price of goods and services increases across the economy, reducing the purchasing power of a currency and the value of certain assets. The same paycheck covers less goods, services, and bills. It is sometimes referred to as a “hidden tax,” as it leaves taxpayers less well-off due to higher costs and “bracket creep,” while increasing the government’s spendin, do not allow the deduction of foreign or other state taxes, penalize married couples filing jointly, and do not include LLCs and S corporations under the individual income tax code. The poorest-performing states on this year’s individual income tax component are New Jersey, California, New York, Hawaii, and Minnesota.
Click the map below to see an interactive version of states’ individual income tax rankings, and then click on your state for more information about how its tax system compares both regionally and nationally.
[newsletter_inline_widget campaign=”//TaxFoundation.us1.list-manage.com/subscribe/post?u=fefb55dc846b4d629857464f8&id=4b9873a934″ title=”Get Updates About Tax Policy in Your State”]
Note: This is part of a map series in which we will examine each of the five major components of our 2019 State Business Tax Climate Index.
To see whether your state’s individual income tax structure has moved up or down in the ranks in recent years, check out the table below.
| 2016 Rank | 2017 Rank | 2018 Rank | 2019 Rank | Change from 2018 to 2019 | |
|---|---|---|---|---|---|
|
Note: A rank of 1 is best, 50 is worst. All scores are for fiscal years. DC’s score and rank do not affect other states. Source: Tax Foundation. |
|||||
| Alabama | 27 | 28 | 28 | 30 | -2 |
| Alaska | 1 | 1 | 1 | 1 | 0 |
| Arizona | 18 | 19 | 18 | 19 | -1 |
| Arkansas | 37 | 39 | 39 | 40 | -1 |
| California | 50 | 50 | 50 | 49 | +1 |
| Colorado | 14 | 14 | 14 | 14 | 0 |
| Connecticut | 43 | 44 | 44 | 43 | +1 |
| Delaware | 40 | 40 | 40 | 41 | -1 |
| Florida | 1 | 1 | 1 | 1 | 0 |
| Georgia | 35 | 35 | 35 | 38 | -3 |
| Hawaii | 46 | 38 | 38 | 47 | -9 |
| Idaho | 22 | 22 | 23 | 23 | 0 |
| Illinois | 11 | 11 | 13 | 13 | 0 |
| Indiana | 15 | 15 | 15 | 15 | 0 |
| Iowa | 39 | 42 | 42 | 42 | 0 |
| Kansas | 19 | 18 | 19 | 21 | -2 |
| Kentucky | 38 | 37 | 37 | 17 | +20 |
| Louisiana | 21 | 21 | 22 | 32 | -10 |
| Maine | 29 | 25 | 20 | 24 | -4 |
| Maryland | 44 | 47 | 47 | 45 | +2 |
| Massachusetts | 12 | 12 | 11 | 11 | 0 |
| Michigan | 13 | 13 | 12 | 12 | 0 |
| Minnesota | 45 | 46 | 46 | 46 | 0 |
| Mississippi | 24 | 24 | 25 | 27 | -2 |
| Missouri | 30 | 32 | 32 | 25 | +7 |
| Montana | 20 | 20 | 21 | 22 | -1 |
| Nebraska | 23 | 23 | 24 | 26 | -2 |
| Nevada | 5 | 5 | 5 | 5 | 0 |
| New Hampshire | 9 | 9 | 9 | 9 | 0 |
| New Jersey | 48 | 48 | 48 | 50 | -2 |
| New Mexico | 28 | 29 | 29 | 31 | -2 |
| New York | 49 | 49 | 49 | 48 | +1 |
| North Carolina | 16 | 16 | 16 | 16 | 0 |
| North Dakota | 26 | 27 | 27 | 20 | +7 |
| Ohio | 47 | 45 | 45 | 44 | +1 |
| Oklahoma | 33 | 31 | 31 | 33 | -2 |
| Oregon | 36 | 36 | 36 | 36 | 0 |
| Pennsylvania | 17 | 17 | 17 | 18 | -1 |
| Rhode Island | 31 | 30 | 30 | 29 | +1 |
| South Carolina | 32 | 34 | 34 | 34 | 0 |
| South Dakota | 1 | 1 | 1 | 1 | 0 |
| Tennessee | 8 | 8 | 8 | 8 | 0 |
| Texas | 6 | 6 | 6 | 6 | 0 |
| Utah | 10 | 10 | 10 | 10 | 0 |
| Vermont | 42 | 43 | 43 | 37 | +6 |
| Virginia | 34 | 33 | 33 | 35 | -2 |
| Washington | 6 | 6 | 6 | 6 | 0 |
| West Virginia | 25 | 26 | 26 | 28 | -2 |
| Wisconsin | 41 | 41 | 41 | 39 | +2 |
| Wyoming | 1 | 1 | 1 | 1 | 0 |
| District of Columbia | 44 | 48 | 48 | 45 | +3 |
To learn more about how we determined these rankings, read our full methodology here.
Share this article