Key Findings
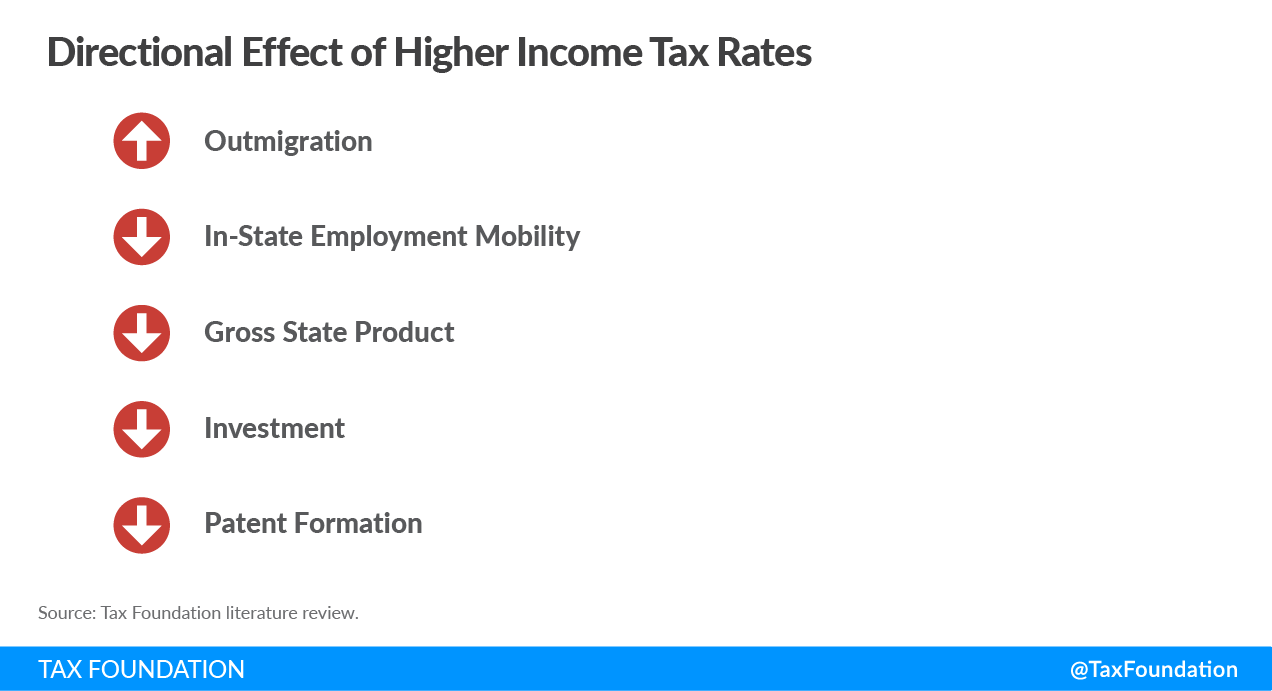
- Research almost invariably shows a negative relationship between income taxA tax is a mandatory payment or charge collected by local, state, and national governments from individuals or businesses to cover the costs of general government services, goods, and activities. rates and gross domestic product (GDP).
- The mobility of higher-skilled and higher income earners in an open economy works against the effort of progressive state and local tax systems to achieve long-term redistribution of income.
- The likelihood of an employed head of household obtaining a better job within a year is higher when a tax system’s progressivity is reduced.
- A decrease in a tax system’s progressivity is associated with an increase in the real growth rate of wages.
- Changes in rates of private investment and private consumption are highly correlated with tax changes. Measures of the magnitude of the investment and consumption changes vary, but the relationship between the variables is consistently negative: as tax levels or rates decrease, investment and/or consumption increases and vice versa.
- Cuts to marginal tax rates are highly correlated with decreases in the unemployment rate.
Table of Contents
Introduction
This November, Massachusetts voters will decide whether the state’s constitution should be amended to transition the Bay State from a flat rate individual income taxAn individual income tax (or personal income tax) is levied on the wages, salaries, investments, or other forms of income an individual or household earns. The U.S. imposes a progressive income tax where rates increase with income. The Federal Income Tax was established in 1913 with the ratification of the 16th Amendment. Though barely 100 years old, individual income taxes are the largest source of tax revenue in the U.S. to a graduated rate system through the imposition of a 4 percent surtax on income over $1 million. The question before voters is a significant one, with meaningful implications for Massachusetts’ economy.
So far, attention has largely been focused on the approximately $2 billion in revenue the surtax is estimated to generate. However, less discussion focuses on the potential economic ramifications of the surtaxA surtax is an additional tax levied on top of an already existing business or individual tax and can have a flat or progressive rate structure. Surtaxes are typically enacted to fund a specific program or initiative, whereas revenue from broader-based taxes, like the individual income tax, typically cover a multitude of programs and services. . This omission is of particular significance because the surtax on November’s ballot is different than most tax legislation in that, if it is approved, any revision to the new 9 percent top marginal rate will require another constitutional amendment—a process that can take years to accomplish. In other words, if policymakers improperly anticipated individuals’ behavioral responses or if other unintended economic consequences result from the tax increase, it could take years to adjust the rate or reconsider the policy, and the damage—even if the policy were reversed, but especially if not—could be long lasting. Therefore, it is in the best interest of policymakers and voters alike to be fully informed on the possible ramifications of the measure.
While literature addressing an individual income tax system’s conversion from a flat rate (where everyone pays the same proportion of their taxable income) to a progressive rate (where higher earners pay a larger percentage of their income than lower earners) is limited, many more studies have examined the relationship between various measures of income taxes and their impact on the macroeconomy (Gross Domestic Product, unemployment rates, levels of private investment, etc.). This paper summarizes the academic literature that empirically studied the relationship among the macroeconomy, taxes, and individuals’ behavioral responses to rate cuts or rate increases both in the United States and abroad. We find significant support for the conclusions that a shift from a flat income tax system to a graduated income tax system, and from a lower to a higher marginal rate, often has a negative relationship with economic growth.
Notably, many of the studies referenced in this review were completed with national level income tax data. That should not, however, disqualify the studies’ findings from generalizability at the state level. In fact, many of the studies implicitly examine the impact of taxes on relatively closed economies—those where the factors of production are constrained within a country’s borders. In contrast to the national economy, subnational economies are much more open. Therefore, since it is much easier to avoid the impact of a particular state policy by relocating labor or capital to a different state, it is reasonable to assume that the empirical findings of a national study could be magnified at the state level.
The individual income tax generates geographic mobility and innovation output responses that hamper the return to innovation, with high earners showing particular sensitivity to higher individual income tax rates.
Literature Review
Gentry and Hubbard (2002) studied the likelihood of achieving upward mobility under an increasingly progressive tax system. In particular, the authors examined the likelihood of moving to a better job under higher tax rates and increased tax rate progressivity. In the study, the authors examine data collected in the Panel Study of Income Dynamics (PSID), a longitudinal study conducted annually by the University of Michigan. A longitudinal study differs from traditional surveys in that the same respondents are surveyed every year for many years. Gentry and Hubbard leverage the PSID for data indicating whether respondents moved to a “better job” during the coming year. The definition of a better job is left to the discretion of the respondent but can generally be understood as one offering a promotion or higher pay. The authors examined national PSID responses from 1979 to 1993.
To construct their measures of tax variables, including a household’s likely future marginal tax rate and the progressivity (or convexity) of a tax system, the authors made use of TAXSIM, a tax modeling program from the National Bureau of Economic Research. The study incorporates federal and state income tax payments as well as the various marginal income tax rates of the federal and state governments.
The baseline results focused on the likelihood that an employed head of household would move to a better job during the next year. Gentry and Hubbard found that for each percentage point reduction in the marginal tax rateThe marginal tax rate is the amount of additional tax paid for every additional dollar earned as income. The average tax rate is the total tax paid divided by total income earned. A 10 percent marginal tax rate means that 10 cents of every next dollar earned would be taken as tax. the probability that an employed male head of household would move to a better job during the next year increased by 0.158 percentage points. Put differently, the authors found that a “five-percentage-point reduction in the marginal tax rate increases the probability of moving to a better job by 0.79 percentage points.” The average propensity to move to a better job was 9.87 percent. Thus, the effect of a 5 percentage point decrease in the marginal tax rate increased the propensity to move by 8 percent. Under the same conditions, female heads of household were, on average, even more likely (8 percent more likely) to move to a better job in the coming year. The results for the impact of marginal tax rates on likelihood of moving to a better job were highly statistically significant.
In terms of the impact of the progressivity of the tax system, Gentry and Hubbard found that for every percentage point decrease in their measure of tax structure convexity, the probability of moving to a better job increased by 0.277 percentage points. As the authors note, “[I]n terms of economic significance, this estimate implies that a one-standard-deviation reduction in the marginal tax convexity measure (3.12 percentage points) would increase the turnover propensity by 0.86 percentage points.” When applied to the average propensity to move to a better job, a decrease in the average progressivity of a tax structure leads to an 8.71 percent increase in the probability of moving to a better job.
Lastly, the study found evidence of a statistically significant relationship between the real growth rate of wages and tax progressivity. According to the authors’ findings, a one percentage point decrease in tax convexity increased the three-year real growth rate in wages from 9.1 percent to 10.5 percent.
Feldstein and Wrobel (1998) examined the question of whether state and local governments can effectively redistribute income through taxation and transfers. Their findings broadly support the economic theory that in the long run (under conditions of perfect mobility) an individual’s pretax wages adjust to make the individual’s after-tax real income the same in all jurisdictions. This leveling occurs when individuals realize after-tax income is higher in a different jurisdiction and relocate to areas where real net incomes are more favorable. Conditions of perfect mobility do not exist—though mobility has clearly increased post-pandemic—but Feldstein and Wrobel find real effects substantially conforming to the stylized theory.
The authors’ research corroborated the theory that more progressive state tax structures cannot achieve redistribution of income in the long run. In states where high income individuals are taxed more heavily, migration increases high earners’ pretax real incomes and lowers pretax incomes of lower income individuals.
Instead of achieving a long-run redistribution of income, a more progressive taxA progressive tax is one where the average tax burden increases with income. High-income families pay a disproportionate share of the tax burden, while low- and middle-income taxpayers shoulder a relatively small tax burden. system distorts economic choices and reduces total real incomes. A change in the progressivity of a state tax structure promotes migration and changes the allocation of resources within the state. As pretax wages of highly skilled individuals rise and wages of low skilled individuals fall, firms are incentivized to reduce the number of higher paying jobs and increase the number of lower paying jobs.
Feldstein and Wrobel’s point estimates are somewhat imprecise but broadly indicate a rapid adjustment of gross wages to changes in the progressivity of state and local tax systems in the 1980s. They conclude that because “individuals can avoid unfavorable taxes by migrating to jurisdictions that offer more favorable tax conditions, a relatively unfavorable tax will cause affected individuals to migrate out until the gross wage for their skill level is raised to a level at which the resulting net wage is equal to that available elsewhere.” Furthermore, since wages rapidly adjust to changing tax environments, the evidence supports the view that states cannot redistribute income for even a few years.
Romer and Romer (2010) examine the relationship between exogenous tax changes—those motivated by factors other than economic stabilization—and economic growth. For purposes of the study, the authors defined a tax change as any action “that actually changed tax liabilities from one quarter to the next.” To control for variables that may simultaneously influence tax rates and economic conditions (endogenous factors), Romer and Romer screened out policies designed to return the economy to normal growth. The authors chose to examine only tax changes that were enacted through exogenous motivations—policy rationales that were less likely to affect rates and economic output simultaneously, such as the reduction of inherited debt, long-term economic growth, or ideology.
By controlling for endogenous tax changes, the authors were able to estimate the effects of tax changes on the economy without the influence of confounding variables that could mask or amplify the impact of the policy change. To identify these tax changes, the authors scrutinized the narrative record of tax proposals from the executive and legislative branches of the federal government, between 1947 and 2006, and used their findings to filter the empirical data for statistical testing. The authors concluded that “tax increases are highly contractionary” and attribute the negative effect on the economy to the strong negative effect of tax increases on investment.
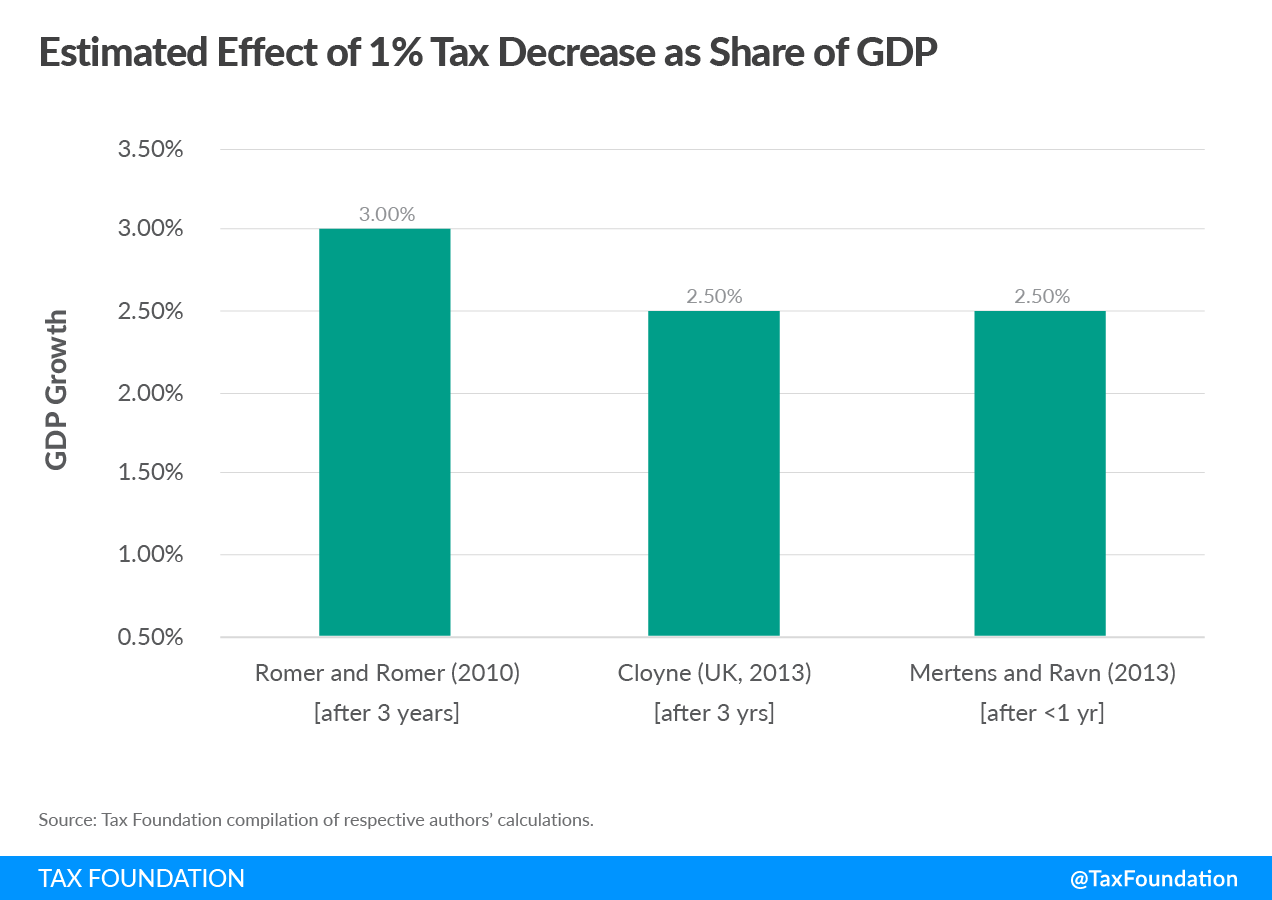
The study found that an exogenous tax increase of 1 percent of GDP resulted in an estimated 3 percent decline in GDP after three years (12 quarters). Much of the decrease in GDP was attributed to a reduction in personal consumption expenditures and private domestic investment. The authors found that if taxes are increased by 1 percent of GDP, personal consumption expenditures and private domestic investment consistently decline for approximately two years. Nine quarters after the change occurred, personal consumption expenditures were estimated to fall by 2.6 percent. Likewise, 10 quarters after the tax increase, private domestic investment was estimated to fall by 12.6 percent.
Rhee (2012) examined the relationship between income tax progressivity and gross production. The author’s study was motivated by his observation that theory alone cannot determine whether the progressivity of the tax system will lead to greater income equality. In his view, the issue is necessarily an empirical one, because the relationship is a function of—among other things—income distribution, labor supply elasticity of various income groups, migration, and the propensity to save or consume.
Rhee examined the average tax rate and the progressivity of the individual income tax in each state in the United States between 1979 and 2004. After examining each state’s average tax rateThe average tax rate is the total tax paid divided by taxable income. While marginal tax rates show the amount of tax paid on the next dollar earned, average tax rates show the overall share of income paid in taxes. , income tax progressivity, and output, Rhee (2012) concluded that there was no statistically significant contemporaneous relationship between average tax rate and growth. Similarly, there was no statistically significant relationship between progressivity and production growth rate in the same year.
The author considered whether a tax system’s progressivity may have a delayed effect on output. Since it may take time for employers, employees, and consumers to process changes in the tax code, it may take several years for the effect of a tax to become apparent in a person’s behavior. According to Rhee’s statistical analysis, a strong negative relationship exists between the lagged progressivity index and the growth rate of gross state product. The relationship is economically and statistically significant. The absolute value of the negative relationship grows for three years of progressivity lag, as individuals respond to the changing tax code, after which continued adjustments diminish.
Lastly, the author considered whether migration had an impact on the change in gross state product mentioned in the previous paragraph. Rhee could find no significant relationship between a state’s net migration rate and a state’s average tax rate or its progressivity index. What was not examined was the relationship between an income group’s migration and a state’s tax progressivity. According to Rhee, net migration rate data may mask an offsetting effect. In other words, it is possible that states with highly progressive tax systems may see out-migration of high-income individuals offset by the in-migration of lower income individuals. Other studies on migration tend to find that high-rate progressive taxes have the greatest effect on the location decisions of high earners and particularly of entrepreneurs, who tend to be the most sensitive to higher levels of taxation.
Cloyne (2013) built on the work of Romer and Romer (2010) by analyzing the narrative record of legislated tax changes in the United Kingdom between 1955 and 2009. Like Romer and Romer, Cloyne controlled for endogenous tax changes and included only exogenous tax changes in his analysis—those uncorrelated with rate changes and macroeconomic output. The primary finding of the author’s research is that on average a 1 percentage point cut in taxes as a proportion of GDP increases GDP by 0.6 percent within one quarter of the tax change, and by 2.5 percent after about three years.
Cloyne also assessed the effect of tax cuts on household consumption and investment and found them to be similar to the results of Romer and Romer (2010). On average, a 1 percentage point cut in taxes as a proportion of GDP causes a 1.3 percent increase in consumption one quarter after the policy change. The maximum impact to consumption is a 2.9 percent change which occurs two years after the tax shock. In terms of investment, a 1 percentage point cut in taxes as a proportion of GDP, on average, increased investment by 1.2 percent on impact. Two years after the tax change, investment increased by 4.6 percent, on average.
The study also addresses the impact of a similar 1 percentage point tax change on the labor market. Cloyne found that, on average, there were sizable and highly significant changes in the real wage: a 1.2 percent increase on impact and a 3.3 percent increase after 11 quarters.
Mertens and Olea (2013, updated 2017) provide insight into the relationship between federal marginal individual income tax rates and income. They sought to answer the question “to what extent do marginal tax rates matter for individual decisions to work and invest?” Mertens and Olea found that incomes of earners in the top 1 percent of the income distribution have the greatest response to changes in tax rates. The authors also found that the incomes of lower earners respond to tax rate changes but with less intensity than the top 1 percent. Aggregate non-wage income (from S corporations, partnerships, sole proprietorships, rents, dividends and interest, and realized capital gains) is especially responsive to taxes.
Additionally, Mertens and Olea found that cuts to marginal tax rates led to increases in real gross domestic product and decreases in the unemployment rate. After marginal tax rate cuts, the number of aggregate hours worked increased. This was due to the hiring of previously unemployed people (the extensive margin) as well as the increase in hours worked by those already employed (the intensive margin).
The authors highlighted an important distinction between how average tax rates and marginal tax rates relate to real economic activity. Their research found that changes in marginal tax rates lead to nearly proportional responses in income even if the average tax rate remains the same. Conversely, they found no evidence that incomes change when average tax rates decline but marginal rates do not.
Lastly, the authors estimated the effect of tax reforms that cut average marginal tax rates (AMTR)[1] exclusively for the top 1 percent or the bottom 99 percent in the income distribution. They found that in the short run, a cut to the AMTR for the top 1 percent is met with an increase in real GDP, lower overall unemployment, a positive effect on incomes in the bottom 99 percent, and greater income inequality.
Mertens and Olea found that a 1 percent cut to the AMTR of the top 1 percent led to an increase in real GDP of 0.26 percent within one quarter and of 0.30 percent within the first year. In response to the same average rate cut, the unemployment rate decreased by 0.17 percentage points one year after the change. Similarly, a 1 percent cut to the AMTR of the top 1 percent of income earners led to a 1.51 percent increase in income within one quarter for that segment of earners. The rate of income growth then rose to 1.57 percent within the first year.
However, benefits from a tax cut to the top 1 percent were not constrained to the top 1 percent of earners. According to the authors, “Average incomes of the bottom 99 [percent] rise by 0.23 [percent] on impact and by up to 0.44 [percent] in the following year.”
Marginal rate cuts affecting only the bottom 99 percent led to aggregate economic growth, individual income growth, and a decrease in the unemployment rate as well. However, those benefits took several years to materialize. Whereas a targeted cut to the AMTR of the top 1 percent led to immediate growth in aggregate economic activity, a targeted AMTR cut for the bottom 99 percent resulted in essentially no change in real GDP over most of the following year. Real GDP began to increase in year two and peaked at 1.63 percent by the end of year three. Likewise, incomes of the bottom 99 percent showed effectively no change in the short term, but eventually plateaued at 2.1 percent growth three and four years after the targeted AMTR cut. The unemployment rate behaved similarly: little change through the first year, but by the third year it had declined by 0.53 percentage points.
Mertens and Ravn (2013) used a narrative study similar to that of Romer and Romer (2010) to examine the impact of changes to the average federal individual income tax rate and the average federal corporate income tax rate on gross domestic product between 1947 and 2006. As with other studies, using the narrative record to identify tax shocks helps control for endogenous effects—where observed tax liabilities and observed GDP influence each other simultaneously. The authors also took steps to control for the influence that changes in individual income taxes may have had on changes in corporate income taxes and vice versa. This study focused on the relationship between GDP and specific types of taxation whereas previously, narrative studies focused only on exogenous changes affecting total tax revenues.
Mertens and Ravn found a negative relationship between the average personal income tax rate (APITR) and real GDP per capita. More specifically, “a 1 percentage point cut in the APITR resulted in an increase in real GDP per capita of 1.4 percent on impact and by up to 1.8 percent after three quarters.” In terms of the multiplicative effect on the economy, a change in individual income tax rates that yields a 1 percent of GDP reduction in tax revenue leads to a 2.5 percent increase in GDP.
Additionally, the authors found that changes in the APITR raises employment, lowers the unemployment rate, and increases hours worked per worker. In particular, a 1 percentage point decrease in the APITR is associated with a statistically significant increase in employment per capita, of 0.3 percent within the first quarter. The increase to employment peaked five quarters after the tax cut at 0.8 percent. The number of hours worked per worker also increased by a significant margin, up 0.4 percent within the first quarter after the tax cut. The increase remained significantly positive for the first year. Those already in the labor force were able to find employment as evidenced by the unemployment rate which fell 0.3 percent within one quarter of the tax cut and 0.5 percent within one year. However, notwithstanding the short-term benefits to the employment and unemployment rates, the labor force participation rate did not move in any statistically significant way.
Additionally, Mertens and Ravn found an increase in private sector investment and a stimulation of private consumption. In response to a 1 percentage point cut in the APITR, durable goods consumption increased by a statistically significant 3.6 percent within one quarter and 5 percent within two quarters and remained at that level for another two quarters before becoming statistically insignificant. The same 1 percentage point cut resulted in a statistically significant 2.1 percent increase in private nonresidential investment within one quarter of the tax cut. The increase grew to 4 percent within one year of the average rate reduction.
The authors concluded that “if relatively rapid job creation is a policy goal, cuts in the personal income tax rate are probably the best fiscal instrument.” Alternatively, if the objective of tax policy change is to raise revenue, raising personal income taxes is effective. However, the trade-offs to additional revenue are relatively large job and GDP losses.
Jentsch and Lunsford (2018) questioned the validity of the conclusions drawn by Mertens and Ravn (2013) on econometric grounds. They were not convinced that Mertens and Ravn (2013) used the proper statistical tests to generate their 2013 findings (referenced earlier). More specifically, Jentsch and Lunsford were concerned with the 95 percent confidence intervals reported by Mertens and Ravn.[2] They proposed an alternative test for the data of Mertens and Ravn and concluded that “cuts to personal and corporate tax rates have no inferable effect on output, investment, employment, hours worked per worker, or the unemployment rate.”
Mertens and Ravn (2019) reviewed the work of Jentsch and Lunsford (2018) and acknowledged the concern over the choice of statistical test in Mertens and Ravn (2013). However, the authors did not agree with the conclusion of Jentsch and Lunsford (2018) that there is no inferable effect of tax cuts on economic activity once a valid statistical inference method is adopted.
After reanalyzing their earlier work with a variety of statistically valid tests, the authors concluded that their earlier results retained their statistical significance with only a moderate loss of precision.
Nguyen, Onnis, and Rossi (2021) examined the impact of consumption and income (individual and corporate) tax changes on income, private consumption, and investment in the United Kingdom from 1973-2003. The authors conducted a narrative analysis to establish a proxy measure for tax shocks. Like narrative analyses mentioned earlier, this approach helped control for endogenous variables.
Nguyen et al. concluded that, in the short run, changes to income taxes result in “large significant, and persistent [effects] on output, private consumption, and investment.” If the average income tax rate were cut by 1 percentage point, GDP in the immediate aftermath (within one quarter) of the tax change would increase by 0.78 percent. Four quarters after the income tax cut, GDP increased by 1.5 percent. In the first quarter after a 1 percentage point cut in the average income tax rate, private investment increased by 2.7 percent. On average, the maximum effect of tax cuts was realized by the fourth quarter, when private investment had increased by 4.6 percent. The private consumption of households increased by 1.2 percent one quarter after a 1 percentage point decrease in the average income tax rate. Peak change in total private consumption occurred at 1.6 percent four quarters after the income tax cut. Changes to consumption tax rates had a modest but mostly insignificant effect on the same components.
Akcigit et al. (2018) studied the impact of state and federal taxes on innovation, where inventors chose to reside, and with which organizations they chose to affiliate. To accomplish this, the authors employed a dataset that tracked inventors, innovations, inventors’ employers, average weekly earnings, patent values, tax rates, and other variables from 1920 to the turn of the century. The authors’ empirical evidence “provides a sense of how firms and investors respond to the net return to innovation, and not only to tax rates, which are merely a component of that economic calculation.”
The authors found that at the state level, personal and corporate income taxes have pronounced negative effects on how much innovation occurs, as measured by the number of patents filed and the number of inventors living in the state.
Akcigit et al. found that individual income taxes have significant negative effects on the likelihood of holding a patent. Taxes also influenced an inventor’s likelihood of producing a highly cited patent or one that produces substantial value for the firm. Furthermore, inventors are significantly less likely to locate in states with higher taxes. Although corporate inventors tend to only be responsive to the corporate income taxA corporate income tax (CIT) is levied by federal and state governments on business profits. Many companies are not subject to the CIT because they are taxed as pass-through businesses, with income reportable under the individual income tax. , inventors that do not work for a corporation consider both corporate and personal income taxes. Additionally, the individual income tax generates both geographic mobility and innovation output responses.
Conclusion
The aforementioned studies represent the balance of academic studies examining the effects of income tax changes and the progressivity of the income tax system on individual behavior and the broader economy. The studies vary in scope and scale, but broadly conclude that tax changes generate significant behavioral responses from individuals. They also largely indicate that tax increases can generate increased revenue for government but often at the expense of economic growth and mobility for taxpayers. Conversely, tax cuts tend to produce short-lived revenue decreases while promoting long-term economic growth.
It should be noted that many of the results of the studies outlined above were interpreted in the context of an income tax decrease. However, due to the structure of the statistical models in the studies, the coefficients of interest could also be interpreted in terms of a tax increase. In that case, the interpretation would take on the opposite sign. Just as income tax reductions tend to increase certain economic activity, commensurate tax increases have the effect of reducing that activity.
For example, Gentry and Hubbard (2002) could be restated to say that a 5 percentage point increase in the marginal tax rate decreases the probability of moving to a better job by 0.79 percentage points from a baseline of 9.87 percent. Thus, a 5 percentage point increase in the marginal tax rate would decrease the propensity to move by 8 percent.
These conclusions are applicable to the contemporary debate surrounding the graduated income tax amendment to Massachusetts’ constitution, which is on the ballot this November. The surtax may generate the government more revenue, but the studies reviewed throughout this paper suggest the effect may be relatively short-lived and come with a cost. As voters consider their position on the income tax amendment, they would do well not to gloss over the policy’s potential for negative economic feedback. As these studies highlight, trade-offs abound. The effects of tax increases impact the larger economy and cannot be constrained simply to those subject to the higher tax rate.
| Reference | Variable(s) of Interest | Relationship | GDP Impact | Other Economic Impact |
|---|---|---|---|---|
| Gentry and Hubbard (2002) | Likelihood of moving to a better job under higher tax rates and increased tax rate progressivity | Negative | *A 1 percentage point reduction in marginal tax rate increased probability of employed head of household moving to better job by 0.158 percentage points. *Each percentage point decrease in measure of tax structure progressivity increased probability of moving to a better job by 0.277 percentage points. |
|
| Feldstein and Wrobel (1998) | Adjustment to pretax wages due to progressive taxation-induced mobility | Negative | Mobility led to a reversal of intended progressive effects and offsetting adjustments to pretax income. | |
| Romer and Romer (2010) | U.S. federal income tax changes between 1947 and 2006 | Negative | *A 1% of GDP tax increase resulted in an estimated 3% decline in GDP after 3 years. *9 quarters after tax increase of 1% of GDP PCE fell by 2.6%. *10 quarters after tax increase of 1% of GDP private domestic investment fell by 12.6%. |
|
| Rhee (2012) | Average tax rate and progressivity of PIT in each U.S. state 1979-2004 | Negative | *A 0.01 increase in progressivity index reduced gross state product by 0.5 percentage point. | |
| Cloyne (2013) | UK national tax changes between 1955 and 2009 | Negative | *A 1 percentage point cut in taxes as a proportion of GDP yields a 0.6% increase in GDP within 1 quarter (increase in GDP grows to 2.5% after 3 years). *A 1 percentage point cut in taxes as a proportion of GDP yields a 1.3% increase in consumption within 1 quarter (maximum impact to consumption is a 2.9% change 2 years after the tax shock). *A 1 percentage point cut in taxes as a proportion of GDP, on average, increased investment by 1.2% within 1 quarter (2 years after the tax change investment increased by 4.6%, on average). |
|
| Mertens and Olea (2013, 2017) | U.S. federal marginal PIT rates between 1946 and 2012 | Negative | *A 1% cut in the average marginal tax rate (AMTR) of the top 1% yields a 1.5% increase in incomes within 1 quarter and 1.57% increase in 1 year. *A 1% cut in the AMTR leads to average incomes of bottom 99% increasing by 0.23% within 1 quarter and 0.44% within the following year. |
|
| Mertens and Ravn (2013) | Changes to U.S. federal average personal income tax rate (APITR) and changes to federal average corporate income tax rate | Negative | *A 1 percentage point cut in the APITR resulted in an increase in real GDP per capita of 1.4% within 1 quarter and up to 1.8% after 3 quarters. *A change in personal income tax rates that yields a 1% of GDP reduction in tax revenue leads to a 2.5 % increase in GDP after three quarters. |
*A 1 percentage point decrease in the APITR is associated with a 0.3 percent increase in employment per capita within 1 quarter. The increase to employment peaked 5 quarters after the tax cut at 0.8 percent. *A 1 percentage point cut in the APITR leads to a 3.6% increase in durable goods consumption within 1 quarter, 5% within 2 quarters. *A 1 percentage point cut in APITR resulted in a 2.1% increase in private nonresidential investment within 1 quarter. The increase grew to 4% within one year. |
| Jentsch and Lunsford (2018) | *Response to Mertens and Ravn (2013): Changes to federal average personal income tax rate (APITR) and changes to federal average corporate income tax rate | No significant relationship | *Cuts to personal and corporate tax rates have no inferable effect on output, investment, employment, hours worked per worker, or the unemployment rate. | |
| Nguyen, Onnis, and Rossi (2021) | UK consumption and income tax changes from 1973-2003 | Negative | *A 1 percentage point cut in average income tax rate leads to 0.78% increase in GDP within 1 quarter (4 quarters after the income tax cut, GDP increased by 1.5%). | *A 1 percentage point cut in the average income tax rate leads to a 2.7% increase in private investment (the maximum effect of the tax cut was realized by the fourth quarter, when private investment had increased by 4.6%). *A 1 percentage point decrease in the average income tax rate leads to a 1.2% increase in the private consumption of households within 1 quarter (change in total private consumption peaked at 1.6% after 4 quarters). |
| Akcigit et al. | Patent formation and value | Negative | Reduced likelihood of receiving a patent, and significantly lower likelihood of inventors locating in states with higher taxes. | |
|
Source: Tax Foundation compilation of authors’ findings. |
||||
Studies Reviewed
Akcigit, Ufuk, John R. Grigsby, Tom Nicholas, and Stefanie Stantcheva, 2018. “Taxation and Innovation in the 20th Century.” NBER Working Paper 24982.
Cloyne, James, 2013. “Discretionary Tax Changes and the Macroeconomy: New Narrative Evidence from the United Kingdom.” American Economic Review 103 (4): 1507-28.
Feldstein, Martin, and Marian V. Wrobel, 1998. “Can State Taxes Redistribute Income?” Journal of Public Economics 68 (3): 369–96.
Gentry, William M. and R. Glenn Hubbard, 2002. “The Effects Of Progressive Income Taxation On Job Turnover,” Journal of Public Economics 88 (9): 2301-2322.
Jentsch, Carsten and Kurt Lunsford, 2018. “The Dynamic Effects of Personal and Corporate Income Tax Changes in the United States: Comment,” American Economic Review 108 (5).
Mertens, Karel and Jose L. Montiel Olea, 2018. “Marginal Tax Rates and Income: New Time Series Evidence,” Quarterly Journal of Economics 133 (4), 1803–1884.
Mertens, Karel, and Morten O. Ravn, 2013. “The Dynamic Effects of Personal and Corporate Income Tax Changes in the United States,” American Economic Review 103 (4): 1212-47.
Mertens, Karel, and Morten O. Ravn, 2019. “The Dynamic Effects of Personal and Corporate Income Tax Changes in the United States: Reply,” American Economic Review 109 (7): 2679-91.
Nguyen, Anh D. M., Luisanna Onnis, and Raffaele Rossi, 2021. “The Macroeconomic Effects of Income and Consumption TaxA consumption tax is typically levied on the purchase of goods or services and is paid directly or indirectly by the consumer in the form of retail sales taxes, excise taxes, tariffs, value-added taxes (VAT), or an income tax where all savings is tax-deductible. Changes,” American Economic Journal: Economic Policy 13 (2): 439-66.
Romer, Christina D., and David H. Romer, 2010. “The Macroeconomic Effects of Tax Changes: Estimates Based on a New Measure of Fiscal Shocks,” American Economic Review 100 (3): 763-801.
Rhee, Tae-hwan, 2012. “Macroeconomic Effects of Progressive Taxation,” https://www.aeaweb.org/conference/2013/retrieve.php?pdfid=394.
[1] AMTR = Average Marginal Individual Income Tax Rate (AMIITR) + Average Marginal Payroll Tax Rate (AMPTR).
[2] Confidence intervals provide a range of values within which the true value of a parameter is expected to be. Statistical analysis attempts to determine the relationship between a set of variables for an entire population (the true relationship). Due to resource constraints, this is often done based on access to data collected from only a sample of the whole population. Statistical tests are constructed and performed with the goal of generating an estimated average relationship for a given set of variables that is as close as possible to the true relationship. However, since data for the entire population is unknown there is always a chance that the true relationship between a set of variables is something other than the estimated value. Thus, confidence intervals help interpret the validity and certainty of statistical estimates.
Share this article