Much of the attention in recent policy discussions has been on how to raise taxes on the highest-income Americans. America’s taxA tax is a mandatory payment or charge collected by local, state, and national governments from individuals or businesses to cover the costs of general government services, goods, and activities. system is already progressive, with the richest Americans paying the greatest share of federal taxes. However, to understand and improve the tax system, policymakers should look not only at those paying the highest tax rates, but also at those on the opposite end of the spectrum.
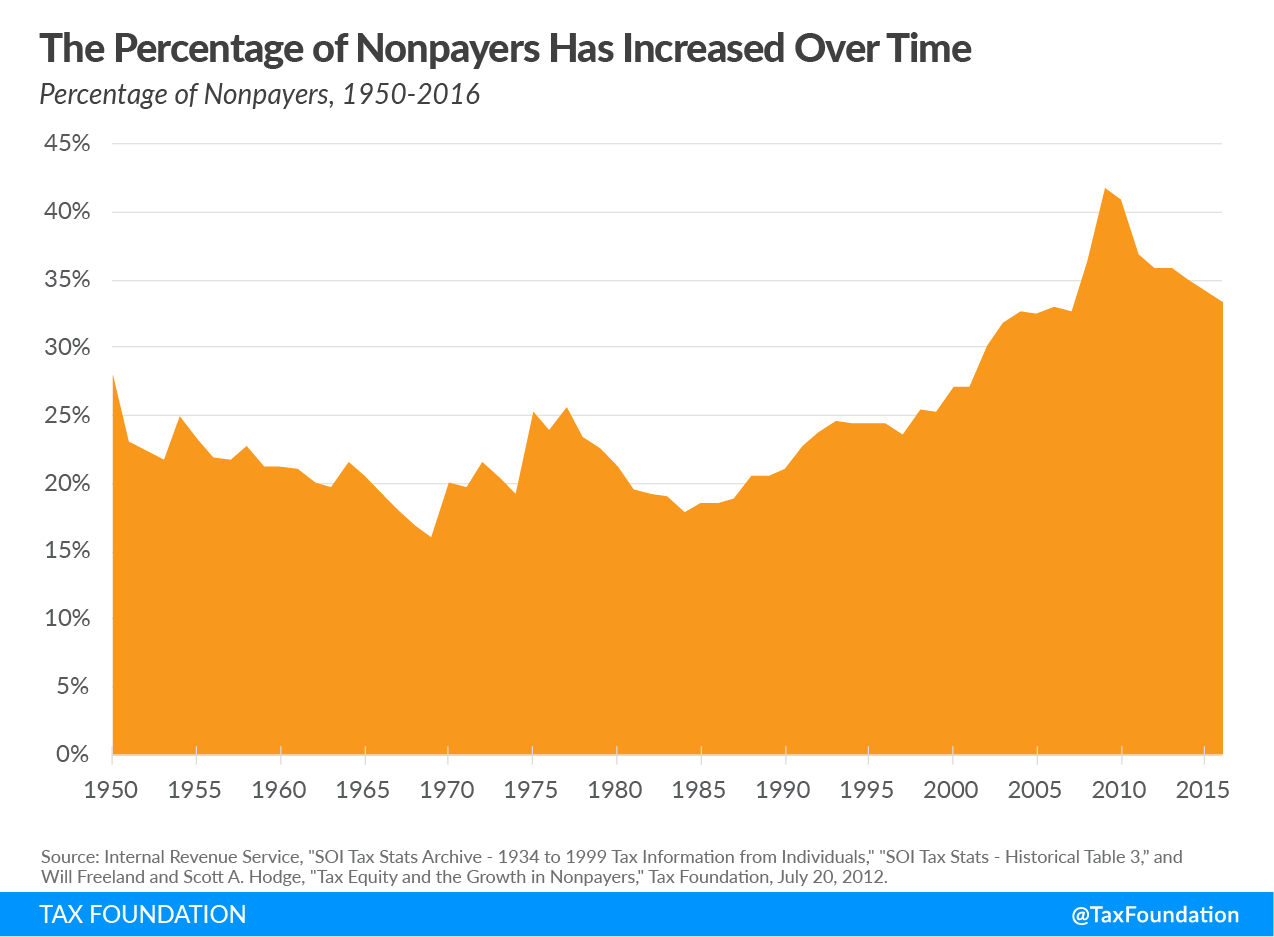
The following chart uses data from the Internal Revenue Service to show the percentage of nonpayers (taxpayers who owe zero income taxes after taking their credits and deductions) from 1950 to 2016. Despite occasional dips, the trend has been an increase in the percentage of nonpayers, from 28 percent in 1950 to 33.4 percent in 2016. During this period, the minimum percentage of nonpayers was 16 percent in 1969, and the maximum was 41.7 percent in 2009.
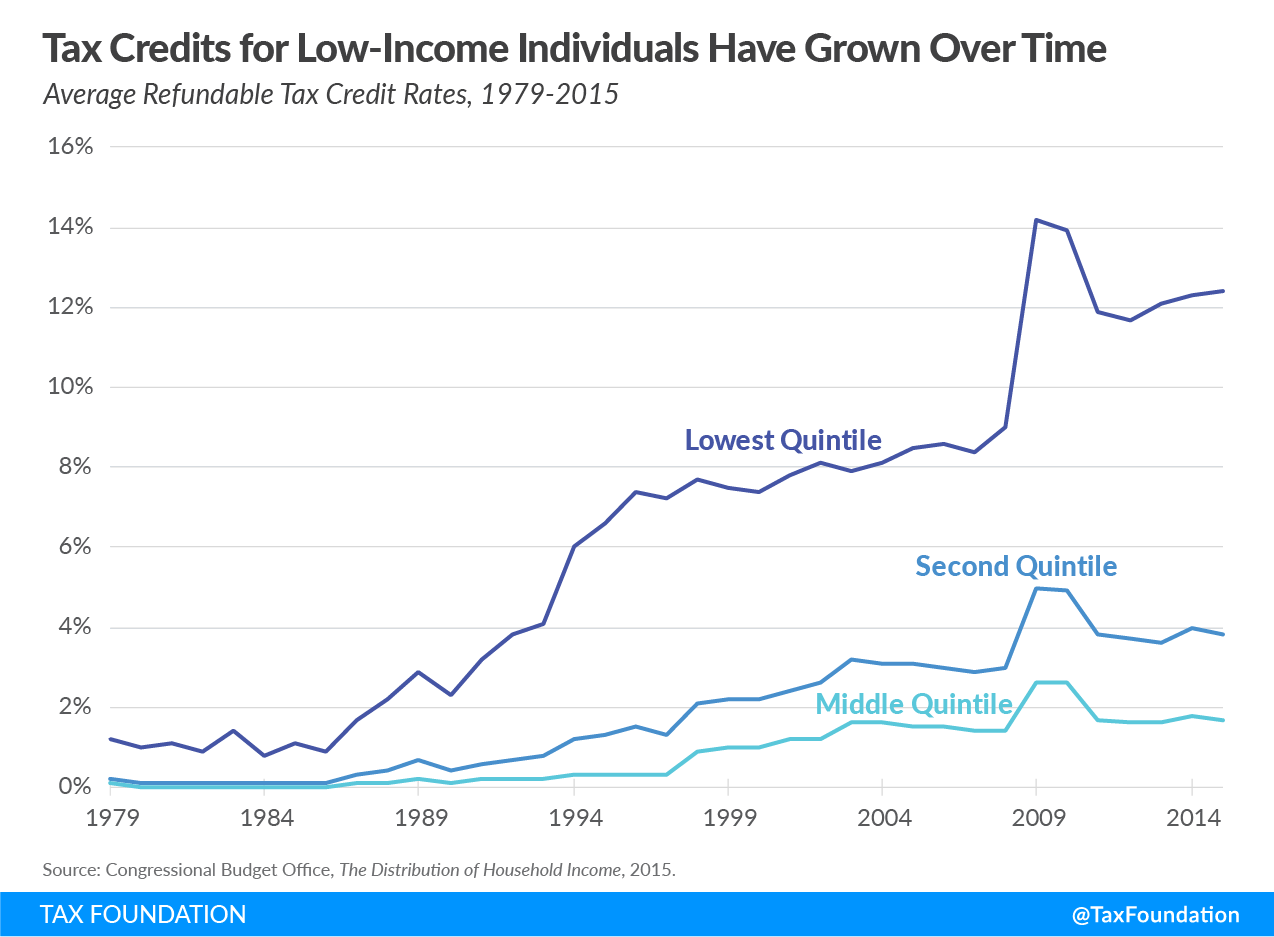
The growth of refundable tax credits is driving this increase in nonpayers. As the value of refundable tax credits increases, more people find themselves paying no income taxes. The following chart uses data from the Congressional Budget Office to show the average refundable tax creditA refundable tax credit can be used to generate a federal tax refund larger than the amount of tax paid throughout the year. In other words, a refundable tax credit creates the possibility of a negative federal tax liability. An example of a refundable tax credit is the Earned Income Tax Credit (EITC). rate for the lowest, second, and middle quintiles from 1979 to 2015. The average refundable tax creditA tax credit is a provision that reduces a taxpayer’s final tax bill, dollar-for-dollar. A tax credit differs from deductions and exemptions, which reduce taxable income rather than the taxpayer’s tax bill directly. rate has increased more than tenfold for the lowest quintile, from 1.2 percent in 1979 to 12.4 in 2015. The second and middle quintiles have seen increases as well.
Average refundable tax credit rates, and therefore the percentage of nonpayers, began to climb dramatically after the Tax Reform Act of 1986, which increased the value of the standard deductionThe standard deduction reduces a taxpayer’s taxable income by a set amount determined by the government. Taxpayers who take the standard deduction cannot also itemize their deductions; it serves as an alternative. and almost doubled the size of the personal exemption. The creation and expansion of credits such as the Earned Income Tax Credit, the Child Credit, and various energy and education credits in later decades further contributed to the increase in the percentage of nonpayers. The percentage of nonpayers also spiked during the Great RecessionA recession is a significant and sustained decline in the economy. Typically, a recession lasts longer than six months, but recovery from a recession can take a few years. . The so-called Stimulus package included the Making Work Pay tax credit, which reduced taxes for low- and middle-income households. Today, tax credits provide a negative income tax rate to the bottom two quintiles, causing their income to increase.
While the percentage of nonpayers has decreased slightly over the last decade, it may increase again as a result of the Tax Cuts and Jobs Act. With the expansion of the standard deduction and the child tax credit, more households are expected to have their tax liabilities eliminated.
As fewer Americans pay income taxes, the remaining taxpayers shoulder a greater share of the burden. As a result, the income tax burden has grown more progressive over time. From 1986 to 2016, for example, the top 1 percent’s share of income taxes rose from 25.8 percent to 37.3 percent, while the bottom 90 percent’s share fell from 45.3 percent to 30.5 percent.[1]
As policymakers debate narrow taxes on small groups of individuals, they should keep in mind that the income tax baseThe tax base is the total amount of income, property, assets, consumption, transactions, or other economic activity subject to taxation by a tax authority. A narrow tax base is non-neutral and inefficient. A broad tax base reduces tax administration costs and allows more revenue to be raised at lower rates. itself has been narrowing for decades, as more and more people pay no income taxes. Tax credits continue to shrink the tax base and raise the percentage of nonpayers. If policymakers want to increase revenue significantly, they will have to look to broad-based taxes that fall on everyone, rather than targeted taxes on select groups.
Note: This is part of our “Putting a Face on America’s Tax Returns” blog series
- America Already Has a Progressive Tax System
- The Composition of Federal Revenue Has Changed Over Time
- The Top 1 Percent’s Tax Rates Over Time
- Who Benefits from Itemized Deductions?
- Income Taxes on the Top 0.1 Percent Weren’t Much Higher in the 1950s
- How Do Transfers and Progressive Taxes Affect the Distribution of Income?
[1] Those paying no federal income taxes may still owe other taxes. The Tax Policy Center has estimated that about 65 percent of those who pay no federal income taxes still owe payroll taxes, and that refundable tax credits completely offset the payroll taxA payroll tax is a tax paid on the wages and salaries of employees to finance social insurance programs like Social Security, Medicare, and unemployment insurance. Payroll taxes are social insurance taxes that comprise 24.8 percent of combined federal, state, and local government revenue, the second largest source of that combined tax revenue. for only approximately 9 percent of households. See Philip Stallworth and Daniel Berger, “The TCJA Is Increasing the Share of Households Paying No Federal Income Tax,” Tax Policy Center, Sept. 5, 2018, https://www.taxpolicycenter.org/taxvox/tcja-increasing-share-households-paying-no-federal-income-tax.
Share this article
