Leading members of the House and Senate taxA tax is a mandatory payment or charge collected by local, state, and national governments from individuals or businesses to cover the costs of general government services, goods, and activities. writing committees are examining the possibility of trading a broader tax baseThe tax base is the total amount of income, property, assets, consumption, transactions, or other economic activity subject to taxation by a tax authority. A narrow tax base is non-neutral and inefficient. A broad tax base reduces tax administration costs and allows more revenue to be raised at lower rates. for dramatically lower rates. Representative Dave Camp (R-MI), the chairman of the House Ways and Means CommitteeThe Committee on Ways and Means, more commonly referred to as the House Ways and Means Committee, is the chief tax-writing committee in the US. The House Ways and Means Committee has jurisdiction over all bills relating to taxes and other revenue generation, as well as spending programs like Social Security, Medicare, and unemployment insurance, among others. , is believed to be seeking enough revenue enhancers to lower the top corporate and individual income taxAn individual income tax (or personal income tax) is levied on the wages, salaries, investments, or other forms of income an individual or household earns. The U.S. imposes a progressive income tax where rates increase with income. The Federal Income Tax was established in 1913 with the ratification of the 16th Amendment. Though barely 100 years old, individual income taxes are the largest source of tax revenue in the U.S. rates to 25 percent while maintaining revenue neutrality. Senators Max Baucus (D-MT) and Orrin Hatch (R-UT), the chairman and ranking member of the Senate Finance Committee, respectively, have proposed a "blank slate" approach, in which most "tax expenditures"—income tax exclusions, deductions, and credits, and other provisions that the Joint Committee on Taxation (JCT) classifies as preferences—would be abolished, except for those that could be convincingly defended, with the money dedicated to rate cuts and perhaps deficit reduction.
One of the primary motivations for tax reform is a recognition that the U.S. income tax system is a serious drag on economic growth. Its anti-growth effects, which are inadvertent but powerful, hurt Americans' productivity and incomes, reduce their ability to compete in an increasingly global marketplace, and diminish their future opportunities. Many believe that these ill effects could be moderated through tax reform. In the words of Representative Camp and Senator Baucus, “Tax reform provides an opportunity to spark economic growth, create jobs, and make U.S. businesses more competitive, both here at home and in the global marketplace. It can provide America a real shot in the arm.”[1] Of course, as the congressman and senators have also noted, while growth is extremely important, it is not the only criterion by which to judge proposed tax changes.
In response to the "blank slate" proposal, and in order better to understand which trade-offs of tax expenditures for lower rates would be most conducive to growth, we used our Taxes and Growth Model (TAG Model), which accounts for the impact taxes have on our economy, to examine eleven large tax provisions in the individual income tax that the JCT regards as tax expenditures.[2] The eleven provisions equal over half the total dollar amount of all tax expenditures. In each case, the TAG Model estimated the impact of abolishing the tax provision on gross domestic product (GDP), investment, and employment, as well as the static and dynamic revenue effects.[3] The model also estimated the outcome if the static revenue gain were used to finance an across-the-board rate cut.
A key advantage of our TAG Model’s dynamic revenue estimates is that they consider the growth effects that occur when tax changes alter marginal incentives to work, save, and invest. Conventional revenue estimates, such as those usually provided by the JCT and others, make the simplifying assumption that tax changes exert no impact on overall aggregates like total employment, investment, income, and production in the economy. (The JCT would describe its estimates as “micro-dynamic” because they permit shifts within the economy, such as fewer sales of heavily taxed products, provided those are precisely offset by more sales of other products so that total sales remain constant.) The conventional, static assumption is reasonable when estimating the consequences of tax changes that do not substantially alter marginal incentives, but misleading when trying to understand tax proposals that would have large incentive effects.
Because Senators Baucus and Hatch focused on the individual income tax in their "blank slate" proposal, our case studies did likewise. The JCT does consider some provisions in the corporate income taxA corporate income tax (CIT) is levied by federal and state governments on business profits. Many companies are not subject to the CIT because they are taxed as pass-through businesses, with income reportable under the individual income tax. to be tax expenditures, but they are much smaller in dollar terms than those on the individual side—about one-tenth the size. Notwithstanding popular rhetoric, the Tax Reform Act of 1986 removed most genuine corporate tax loopholes, and only a few have crept back in. In contrast, the dollar amount of tax expenditures on the individual side has grown enormously in recent years.[4]
While the separate case studies were needed to distinguish between trade-offs that would speed growth and some that would actually slow the U.S. economy, a natural question is what would be the impact if the eleven tax expenditures were eliminated en masse. The revenue from that base broadening could finance dramatically lower income tax rates. Would the trade-off also lead to dramatically faster growth?
Conventional Revenue Estimates
Our eleven previous case studies considered the following tax deductions, exclusions, and credits:
- the mortgage interest deductionThe mortgage interest deduction is an itemized deduction for interest paid on home mortgages. It reduces households’ taxable incomes and, consequently, their total taxes paid. The Tax Cuts and Jobs Act (TCJA) reduced the amount of principal and limited the types of loans that qualify for the deduction. ,
- the property tax deductionA tax deduction allows taxpayers to subtract certain deductible expenses and other items to reduce how much of their income is taxed, which reduces how much tax they owe. For individuals, some deductions are available to all taxpayers, while others are reserved only for taxpayers who itemize. For businesses, most business expenses are fully and immediately deductible in the year they occur, but others, particularly for capital investment and research and development (R&D), must be deducted over time. ,
- reduced tax rates on long-term capital gains and qualified dividends,
- the state and local income tax deduction,
- accelerated depreciationDepreciation is a measurement of the “useful life” of a business asset, such as machinery or a factory, to determine the multiyear period over which the cost of that asset can be deducted from taxable income. Instead of allowing businesses to deduct the cost of investments immediately (i.e., full expensing), depreciation requires deductions to be taken over time, reducing their value and discouraging investment. ,
- the exclusion from taxable incomeTaxable income is the amount of income subject to tax, after deductions and exemptions. Taxable income differs from—and is less than—gross income. of employer provided health care,
- the earned income tax creditA tax credit is a provision that reduces a taxpayer’s final tax bill, dollar-for-dollar. A tax credit differs from deductions and exemptions, which reduce taxable income rather than the taxpayer’s tax bill directly. ,
- education credits,
- the child tax credit,
- the partial exclusion from taxable income of social security benefits, and
- the charitable deduction.

In estimating for this study the combined effects of ending all eleven tax provisions, we first used the TAG Model to generate a conventional, static revenue estimate by artificially constraining growth effects to be zero. Our static estimate is that eliminating these eleven provisions would boost annual individual income tax collections by $574 billion.[5] Chart 1 shows this amount and the static revenue estimates for each of the eleven provisions. The three largest, in order, are the exclusion for employer-provided health care, the rate cap on capital gains and dividends, and the mortgage interest deduction.
Growth Effects and Dynamic Revenue Estimates
In the next step, we dropped the artificial static assumption and reran the model. The separate case studies had previously revealed that tax expenditures can be grouped into three broad categories based on their growth effects:
- Some provisions, such as the rate cap on the taxation of capital gains and dividends, partially offset income tax biases against saving and investing. (If measured against a saving-consumption neutral tax system, they would not be considered tax expenditures at all.) Eliminating them would intensify income tax biases against capital formation and, because people’s saving and investment decisions are extremely sensitive to the expected after-tax rate of return, lead to major drops in the capital stock, productivity, and the size of the economy.
- The repeal of some provisions, such as the tax exclusion for employer-provided health care and the deduction for state and local income taxes, would have a mild negative growth effect if used solely as tax increases because they would bump some taxpayers into higher marginal tax bracketsA tax bracket is the range of incomes taxed at given rates, which typically differ depending on filing status. In a progressive individual or corporate income tax system, rates rise as income increases. There are seven federal individual income tax brackets; the federal corporate income tax system is flat. .
- Some provisions, such as the Earned Income Credit (EIC), create positive work incentives at very low incomes but discourage additional work effort over a range of higher incomes because the benefits are clawed back as income rises. It is an empirical question which effect dominates. With the Earned Income Credit (EIC) and the Child Tax Credit, the TAG Model estimates that the negative effect is stronger, which implies that more labor would be supplied and growth would be slightly higher if the provisions and their clawbacks were repealed.

Box 1. Estimated Effects if the Following Eleven "Tax Expenditures" were Eliminated from the Individual Income Tax |
|
|
The Eleven Provisions
|
|
|
Economic And Budget Changes Versus 2013 Law |
|
|
GDP, percent change |
-10.13% |
|
GDP, dollar change |
-$1,581.7 |
|
Private business GDP, percent change |
-10.56% |
|
Private business stocks, percent change |
-22.70% |
|
Wage rate, percent change |
-8.16% |
|
Private business hours of work, percent change |
-2.62% |
|
Full time equivalent jobs |
-2,680,000 |
|
Static federal revenue estimate, dollar change |
$574.2 |
|
Dynamic federal revenue estimate, dollar change |
$178.6 |
|
% Revenue reflow vs. static |
-68.9% |
|
Dollars of lost GDP per dollar of added federal revenue |
-$8.86 |
|
Weighted average service price (percent change) |
|
|
Corporate |
20.85% |
|
Noncorporate |
3.68% |
|
All business |
15.70% |
| Source: Tax Foundation calculations |

Scenario No. 1: Eliminating “Tax Expenditures” Without Rate Reductions
Taking all eleven provisions together, the TAG Model predicts that abolishing them without any offsetting rate reductions would result in serious economic damage. Faced with a harsher tax climate at the margin, people would respond by supplying less labor and capital. The model estimates that private capital stocks would plummet almost 23 percent, wages would fall more than 8 percent, and work hours would decline 2.6 percent—the equivalent of roughly 2.7 million full time jobs.
The tax-induced drop in production inputs, in turn, would cause production and incomes across the economy to fall. The model estimates that GDP would plunge by nearly $1.6 trillion—over 10 percent—if all the tax increases were enacted without offsets. Chart 2 depicts this finding, as well as the previously estimated GDP changes from removing each of the eleven provisions separately.
Further, since the size and health of the economy are key determinants of tax receipts, the smaller economy would exert a negative feedback on tax collections. The model predicts that eliminating the eleven provisions would still lift federal revenue, but the dynamic revenue estimate of $179 billion is less than one-third of the conventional, static estimate. Chart 3 shows this amount and the dynamic revenue estimates for each of the eleven provisions separately. Box 1 summarizes the findings for Scenario 1.
It should be noted that the model is looking at the results after people have fully adjusted to the new tax rules. The model is not estimating the year-by-year changes during the transition. The adjustment requires time, particularly for modifications to the capital stock, but experience suggests that most of the adjustments in the stock of equipment will be completed within five years and most of the adjustments to structures within ten years.
Of course, growth is not the only relevant criterion to use when evaluating a tax provision. Simplicity, predictability, fairness, transparency, and other factors should also be considered. That said, growth is extremely important and should not be ignored. Even if growth was not valued for its own sake, it matters when gauging the revenue consequences of tax changes. As the results here suggest, tax increases usually bring in fewer tax dollars than static revenue estimates predict, sometimes far fewer, while tax cuts are often less costly than foreseen by models that assume away growth.

Scenario No. 2: Trading a Broader Income Tax Base for Lower Rates
According to a conventional, static revenue estimate, repealing the eleven provisions we evaluated could pay for a huge, revenue-neutral, across-the-board cut in individual income tax rates. In static mode, our TAG Model estimates the across-the-board cut would be 36.5 percent. For example, the 10 percent rate would drop to 6.4 percent, the 25 percent rate to 15.9 percent, and the 39.6 percent rate to 25.1 percent. These are spectacular rate reductions, and they would be highly favorable to growth. However, the model's dynamic tax simulation estimates show that these reductions would not be sufficient to outweigh the harm done to growth by the base broadeningBase broadening is the expansion of the amount of economic activity subject to tax, usually by eliminating exemptions, exclusions, deductions, credits, and other preferences. Narrow tax bases are non-neutral, favoring one product or industry over another, and can undermine revenue stability. .
The explanation is that many of the revenue raisers, in dollar terms, would hit capital income, which is very responsive to after-tax rewards, producing a strong negative effect, while the majority of the rate cuts would apply to labor income, which is not as responsive to after-tax rewards, producing a smaller offsetting benefit. As illustrated in Chart 4, the TAG Model estimates that after people have adjusted to the new tax incentives, GDP would be $299 billion lower than otherwise and because of the smaller economic pie, federal revenue would be $59 billion lower. The model also estimates that, on net, private capital stocks would decline 5.4 percent, wages would fall 3.4 percent, and private-sector work hours would decline almost 1.7 percent (the equivalent of 1.7 million full time jobs.)
Box 2. Estimated Effects If The Following Ten "Tax Expenditures" Were Eliminated From The Individual Income Tax |
|
|
The Ten Provisions
|
|
| Economic And Budget Changes Versus 2013 Law (Dollar amounts in billions of 2012 dollars unless indicated otherwise) |
|
|
GDP, percent change |
-3.51% |
|
GDP, dollar change |
-$548.77 |
|
Private business GDP, percent change |
-3.70% |
|
Private business stocks, percent change |
-5.49% |
|
Wage rate, percent change |
-2.54% |
|
Private business hours of work, percent change |
-1.18% |
|
Full time equivalent jobs |
-1,210,000 |
|
Static federal revenue estimate, dollar change |
$452.89 |
|
Dynamic federal revenue estimate, dollar change |
$315.49 |
|
% Revenue reflow vs. static |
-30.34% |
|
Dollars of lost GDP per dollar of added federal revenue |
-$1.74 |
|
Weighted average service price (percent change) |
|
|
Corporate |
1.04% |
|
Noncorporate |
3.89% |
|
All business |
1.89% |
| Source: Tax Foundation calculations |

Scenario No. 3: Eliminating Ten “Tax Expenditures” Without Rate Reductions; Less Harmful Results If the Current-Law Rate Cap On Capital Gains and Dividends Is Retained
About 60 percent, by dollar amount, of the provisions on the tax expenditureTax expenditures are departures from a “normal” tax code that lower the tax burden of individuals or businesses through an exemption, deduction, credit, or preferential rate. However, defining which tax expenditures grant special benefits to certain groups of people or types of economic activity is not always straightforward. list soften the income tax’s anti-saving bias.[6] One of the largest and most crucial is the tax rate limitation on long-term capital gains and qualified dividends. We repeated the simulations and left these rates unchanged, as in current law. As seen in Chart 5, the elimination of the ten other tax expenditures being modeled produces a static revenue gain of $453 billion, which is $121 billion less than with the elimination of all eleven. However, the drop in GDP, at $549 billion, is only about one-third as severe as in Scenario 1, where the tax rates on capital gains and dividends rose sharply. Because output still declines, the dynamic revenue estimate falls short of the static estimate. However, the economic damage is not as extreme as in Scenario 1, with the result that the dynamic revenue estimate for eliminating the ten other tax expenditures, $315 billion, is 75 percent larger than if the rate cap on capital gains and dividends were also abolished. Box 2 presents the main findings for Scenario 3.
Scenario No. 4: Trading Ten Large Tax Expenditures for Lower Rates

If the rate cap on capital gains and dividends is retained and the static revenue gain from the ten other provisions that were modeled is used for an across-the-board rate cut, individual income taxes could be reduced by 33.3 percent. For example, the 10 percent rate would drop to 6.7 percent, the 25 percent rate to 16.7 percent, and the 39.6 percent rate to 26.4 percent. Although this offset is not quite as large as the earlier one in Scenario 2, the economic results are much better. Instead of an estimated GDP loss about $300 billion, there would be an estimated gain of $10 billion, as shown in Chart 6. And instead of an estimated dynamic revenue loss of about $60 billion, this more modest trade-off of a broader base for lower rates would be approximately revenue neutral on a dynamic basis.
The TAG model only looks at one of the avenues through which higher tax rates on capital gains and dividends cause damage: the higher rates strongly discourage saving and investment, which hurts production and has an adverse feedback on tax collections. The model does not consider two other important channels. One is the realizations, or lock-in, effect: higher capital gains tax rates persuade investors to sell capital assets less frequently, which means fewer asset sales on which to assess capital gains taxA capital gains tax is levied on the profit made from selling an asset and is often in addition to corporate income taxes, frequently resulting in double taxation. These taxes create a bias against saving, leading to a lower level of national income by encouraging present consumption over investment. and less flexibility in the allocation of capital. A corollary with dividends is smaller dividend payouts, with analogous damage to the economy and tax revenue. The other channel is the asset value effect. Because asset values are based on expected after-tax returns, a higher tax rate on capital gains and dividends depresses asset prices, causing future capital gains to be smaller than otherwise. If the model included these two additional pathways, Scenarios 1 and 2 would look even worse than they do now and the improvement from moving to Scenarios 3 and 4 would be greater still.

Box 3. Estimated Effects if the Following Seven "Tax Expenditures" were Eliminated from the Individual Income Tax |
|
|
The Seven Provisions
|
|
| Economic And Budget Changes Versus 2013 Law (Dollar amounts in billions of 2012 dollars unless indicated otherwise) |
|
|
GDP, percent change |
-0.72% |
|
GDP, dollar change |
-$111.8 |
|
Private business GDP, percent change |
-0.77% |
|
Private business stocks, percent change |
-1.54% |
|
Wage rate, percent change |
-0.41% |
|
Private business hours of work, percent change |
-0.36% |
|
Full time equivalent jobs |
-364,000 |
|
Static federal revenue estimate, dollar change |
$347.4 |
|
Dynamic federal revenue estimate, dollar change |
$320.3 |
|
% Revenue reflow vs. static |
-7.8% |
|
Dollars of lost GDP per dollar of added federal revenue |
-$0.35 |
|
Weighted average service price (percent change) |
|
|
Corporate |
0.75% |
|
Noncorporate |
0.88% |
|
All business |
0.79% |
| Source: Tax Foundation calculations |
Scenario No. 5: Eliminating Seven “Tax Expenditures” Without Rate Reductions; Harm Further Reduced by Retaining All Provisions Focused on Saving and Investing
In addition to the tax rate cap on long-term capital gains and qualified dividends, three of the other provisions modeled in this study also affect capital. One is accelerated depreciation. The other two are the mortgage interest deduction and the property tax deduction, where the type of capital is residential housing. We repeated the simulations leaving these four capital-related provisions as they are under current law. As seen in Chart 7, the elimination of the seven other tax expenditures produces a static revenue gain of $347 billion, which is 40 percent lower than in Scenario 1, where all eleven were ended. However, the drop in GDP, at $112 billion, is only 7 percent as severe as in Scenario 1. Because output suffers much less, the negative feedback on tax revenue is milder, with the result that the dynamic revenue estimate for eliminating the seven tax expenditures, $320 billion, is 75 percent larger than if all eleven were ended. Box 3 summarizes the findings for Scenario 5.
Scenario No. 6: Trading Seven Large Tax Expenditures for Lower Rates
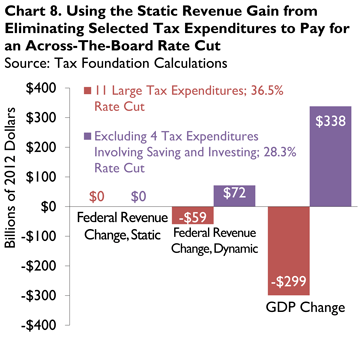
If the estimated static revenue gain from eliminating the seven provisions is used for an across-the-board rate cut, individual income tax rates could be reduced 28.3 percent, a bit less than in the earlier cases. The 10 percent rate would drop to 7.2 percent, the 25 percent rate to 17.9 percent, and the 39.6 percent rate to 28.4 percent. Although this offset is not as breathtaking as the earlier ones, the economic results are much better. Instead of an estimated GDP loss of nearly $300 billion (Scenario 2, with eleven provisions ended) or essentially no change in GDP (Scenario 4, with ten provisions ended), there would be an estimated gain of $338 billion. (See Chart 8.) Instead of an estimated dynamic revenue drop of $59 billion like in Scenario 2 or revenue neutrality like in Scenario 4, this more limited trade-off of a broader base for lower rates would add $72 billion to federal coffers on a dynamic basis. The dynamic simulation also estimates that before-tax wages would be essentially unchanged but after-tax wages would rise and that hours worked in the private sector would climb 2.2 percent (equivalent to 2.3 million full time jobs).
Conclusion
Pruning back tax expenditures could—if done wisely—pay for spectacular reductions in income tax rates and fuel economic growth. Care must be taken, though, to assess the merits of each provision individually rather than assuming that an item must be bad just because it is on the tax expenditure list.
Exchanging some provisions for lower rates would be pro-growth and would be a move that pays for itself. However, with a number of other tax features—notably those that affect the cost of capital—dropping the items in return for lower rates would slow growth and collect much less revenue than a conventional revenue estimate would predict. Many so-called tax expenditures are not special favors to privileged groups but provisions that probably belong in the tax code because they soften tax biases that slow economic growth.
In a conventional, or static, revenue estimate, which disregards growth effects, it appears that taking a machete to tax expenditures would produce a huge revenue gain and that the newly found money could readily finance radically lower income tax rates on a revenue neutral basis. A dynamic analysis that accounts for growth effects, however, tells a different story. This paper’s look at repealing a collection of eleven large tax expenditures, as well as eleven earlier case studies that examined the provisions separately, highlights the value of the dynamic approach and the inadequacies of the conventional, static analysis.
The Tax Foundation’s Taxes and Growth Model predicts that the real-world consequences of indiscriminately slashing away at the tax expenditure list in return for lower rates would be less capital, less employment, lower incomes, reduced GDP, and less federal revenue. The rate cuts, even though enormous, do not guarantee a more prosperous economy.
The most damaging provisions to eliminate, according to the model, would be those that partially counteract income tax system penalties against saving and investment relative to immediate consumption. On the other hand, if one is careful which provisions are eliminated, the dynamic model predicts that base broadening could be traded successfully for lower rates and faster growth.
[1] Press Release, House Committee on Ways and Means, Camp, Baucus Highlight How Tax Reform Can Spark Innovation at Stop in Silicon Valley (Aug. 20, 2013), http://waysandmeans.house.gov/news/documentsingle.aspx?DocumentID=346344.
[2] The U.S. Treasury also compiles a list of tax expenditures. The two government lists are similar, but they are far from identical because deciding what items constitute tax expenditures is a subjective process that requires many value judgments.
[3] For links to the earlier papers in the series, see Michael Schuyler & Stephen Entin, The Economics of the Blank Slate: Estimating the Effects of Eliminating Major Tax Expenditures and Cutting Tax Rates, Tax Foundation Fiscal Fact No. 378 (July 26, 2013), /article/economics-blank-slate-estimating-effects-eliminating-major-tax-expenditures-and-cutting-tax-rates.
[4] For an overview of the relative sizes of tax expenditures in the individual and corporate income taxes, and their changes over time, see William McBride, A Brief History of Tax Expenditures, Tax Foundation Fiscal Fact No. 391 (Aug. 22, 2013), /article/briefhistory-tax-expenditures.
[5] The dollar amounts in the model are based on 2008 data, aged to 2012 dollars. The tax data come from a representative sample of 140,000 tax returns (the 2008 IRS Public Use File). The economic data in the baseline are from the National Income and Products Accounts (NIPA) prepared by the U.S. Bureau of Economic Analysis.
[6] See McBride, supra note 4.
Share this article