Key Findings
- The question of who benefits from government spending is just as important as the question of who pays taxes. In other words, how do taxA tax is a mandatory payment or charge collected by local, state, and national governments from individuals or businesses to cover the costs of general government services, goods, and activities. and spending policies redistribute income?
- American’s lowest-income families receive $5.28 worth of government spending (federal, state, and local) for every $1 they pay in total taxes. Middle-income families receive $1.48 in total spending per tax dollar, while America’s highest-income families receive $0.25 cents in spending for every dollar of taxes paid.
- As a group, the bottom 60 percent of American families receive more back in total government spending than they pay in total taxes.
- Government tax and spending policies combine to redistribute more than $2 trillion from the top 40 percent of families to the bottom 60 percent.
- The total amount of redistribution has increased slightly over the past 12 years. Middle-income and working lower-income families were the biggest beneficiaries.
- Lawmakers can remove equity as an issue in tax reform by matching any loss in progressivity on the tax side with an equal increase in progressivity on the spending side.
Introduction and Overview
Governments at all levels throughout the United States impose taxes in order to finance spending programs intended to benefit their citizens. A common question posed about these fiscal policies is how their costs and benefits are distributed across different subgroups of the population, most notably by income group. In other words, how much do people pay in taxes versus how much do they receive in government spending?
While the distribution of the tax burden is a frequent topic of debate—especially in Washington, DC—there is little attention given to the distribution of spending programs. And rarely has there been any attempt to analyze the totality of tax and spending programs across all levels of government. This study seeks to fill this void by analyzing the distribution of both taxes and government spending at both the federal and state and local levels.[2]
The goal is to compare how much families at various income levels pay in all taxes—from state and local motor vehicle licenses to the federal individual income taxAn individual income tax (or personal income tax) is levied on the wages, salaries, investments, or other forms of income an individual or household earns. The U.S. imposes a progressive income tax where rates increase with income. The Federal Income Tax was established in 1913 with the ratification of the 16th Amendment. Though barely 100 years old, individual income taxes are the largest source of tax revenue in the U.S. —to how much they receive from government spending programs—from cash and in-kind transfer payments like Social Security and Medicaid to public goods like national defense. Once we understand the difference between how much families pay in taxes and how much governments spend on them, we can measure how much tax and spending policies combine to redistribute income between different groups of Americans.
We find that the combined effect of government tax and spending policies is to redistribute more than $2 trillion annually from families in the top 40 percent of the income distribution to those in the bottom 60 percent. Federal tax and spending policies comprise more than two-thirds of the total amount of redistribution and contributed to a slight increase in the total amount of redistribution over the past decade.
Interestingly, we find that the biggest net beneficiaries of this increase in redistribution from 2000-2012 are middle-income families and working lower-income families (those in the second quintile). These were the families most targeted by economic stimulus programs and more generous tax creditA tax credit is a provision that reduces a taxpayer’s final tax bill, dollar-for-dollar. A tax credit differs from deductions and exemptions, which reduce taxable income, rather than the taxpayer’s tax bill directly. s. Of the $2 trillion in income that was redistributed in 2012, nearly half was paid for by families in the top 1 percent.
These findings have particular relevance to the current tax reform debate because distributional issues are one of the key sticking points to reform proposals that would cut marginal tax rates while broadening the tax baseThe tax base is the total amount of income, property, assets, consumption, transactions, or other economic activity subject to taxation by a tax authority. A narrow tax base is non-neutral and inefficient. A broad tax base reduces tax administration costs and allows more revenue to be raised at lower rates. . But tax progressivity is only half the picture, because progressivity can be achieved through both taxes and spending. Thus, if moving to a flatter, more economically neutral tax code reduces progressivity in the tax code, overall progressivity of the fiscal system can be maintained with slight adjustments to federal spending.
Note to readers: It is important to note that the results featured in this paper assume a “cost of services” methodological approach. This means, among other things, that most public goods like national defense are assumed to be distributed evenly throughout the population. In the interest of full transparency, the appendix of this paper presents results under an alternative “benefit principle” approach, which distributes many public goods like national defense based on income, under the assumption that high-income families benefit more from public goods than low-income families. Under this approach, the aggregate amount of redistribution from the top 40 percent to the bottom 60 percent is $1.2 trillion, approximately 40 percent less than the $2 trillion estimated under the cost of services approach. For more information about the differences between the cost of services approach and the benefit principle approach, see this paper’s methodology section and the appendix.
Top Line Results for Total Government Taxes and Spending in 2012
In 2012, governments at all levels collected $4.2 trillion in taxes and other receipts and spent $5.5 trillion on government programs, thereby running a combined deficit of $1.3 trillion. Table 1 presents an estimate of the distribution of these fiscal policies, broken down by income cohort and by level of government.[3]
As one can see in Chart 1, high-income families paid far more in taxes than lower-and-middle-income families. For example, the average amount of taxes paid by families in the top quintile (i.e. the top 20 percent) was $122,217, nearly twenty times greater than the average of $6,331 paid by families in the bottom quintile. This should come as no surprise given that governments in the United States do not impose flat-rate head taxA head tax, also known as a poll tax or capitation, is a flat or uniform tax levied equally on every taxpayer. Unlike an income tax, it is a fixed amount and not based on how much one earns, nor does it change based on any taxpayer circumstance or action. es but instead raise revenue largely from taxing economic activity (e.g., income, consumption, profits), often at progressive rates. In fact, on net, the U.S. tax system overall is progressive in terms of both rates and burdens. Not only do high-income families pay more in taxes in pure dollar amounts than low-income families, but they also pay a greater amount in taxes as a percentage of their income than low-and-middle income families.

Chart 1 shows that spending is much more evenly distributed across income quintiles than taxes. The typical family in the lowest quintile receives $33,402 in total spending from all levels of government, while the typical family in the top quintile receives $35,141 in total spending. (This is due in large part from the figures in Table 1 being based on the cost of services approach to distributing government spending. This is explained in more detail in the methodology section.)

The average redistribution amount shown in Table 1 is derived by subtracting the average spending received by each income group from the average tax amount paid by that income group. For some groups, the net amount will be positive because they receive more in government spending than they pay in taxes. For others, the net amount will be negative because they pay more in taxes than they receive in spending.
As Chart 1 illustrates, the typical family in the lowest 20 percent in 2012 (with market incomes[4] between $0 and $17,104) pays an average of $6,331 in total taxes and receives $33,402 in spending from all levels of government. Thus, the average amount of redistribution to a typical family in the bottom quintile is estimated to be $27,071. The vast majority of this net benefit, a total of $21,158, comes as a result of federal policies.
Looking next at families in the second quintile (with market incomes between $17,104 and $37,065), we can see that they pay an average of $11,913 in taxes to all levels of government and receive $30,052 in total spending. As a result, these families receive $18,139 more in spending overall than they pay in taxes. Again, the majority of these net benefits are from federal policies.
Interestingly, middle-income families (with incomes between $37,065 and $67,456) are also recipients of a considerable amount of redistribution. These families pay an average of $20,429 in taxes to all levels of government but receive $30,144 in spending in return. Thus, these families receive $9,715 more in spending than they pay in taxes.
At the other end of the income scale, the top quintile (with incomes above $119,695) pays $87,076 more in taxes per family than it receives in government spending. These families pay an average of $122,217 in taxes to all levels of government and get $35,141 worth of spending in return. The difference is even larger at the very top of the income scale. The average family in the top 1 percent pays $812,395 more in taxes than they receive in spending from all sources. These families pay an average of $867,473 in taxes to all levels of government and get in return $55,078 in spending.

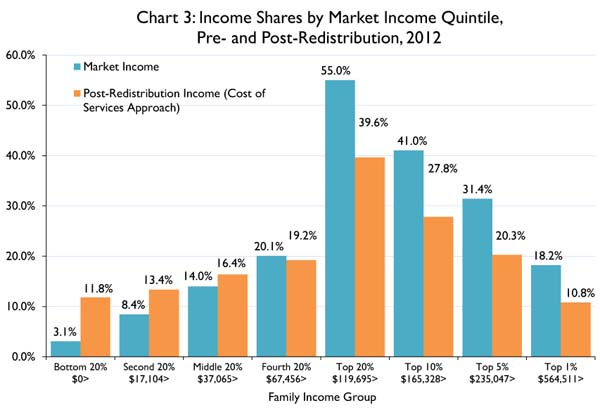
Chart 2 presents the tax and spending relationships as a ratio to give us another way of understanding how much families receive in spending for every dollar that they pay in total taxes. The Chart shows that the ratio for each of the bottom three quintiles is above 1. This means that (as a group), those quintiles are the recipients of more spending than they pay in total taxes.
For the bottom quintile, the ratio of overall spending to overall taxes is 5.28, meaning these families receive $5.28 worth of spending for every $1 that they pay in total taxes. The federal ratio is much larger than the state and local ratio for these families. They receive $8.13 in federal spending for every $1 that they pay in federal taxes.
The overall ratio for families in the middle quintile is 1.48. They receive $1.31 in state and local spending for every $1 of state and local taxes they pay, however they receive $1.57 in federal spending for every $1 they pay in federal taxes.
For families in the top quintile, the overall ratio of spending to taxes is 0.29. They receive $0.25 cents in federal spending for every $1 they pay in federal taxes, but they receive $0.39 cents in state and local spending for every $1 they pay in state and local taxes.
Table 2 and Chart 3 show how the redistribution from tax and spending policies affects the overall distribution of income. Prior to redistribution by government, the top 20 percent of families earned more than half (55 percent) of the nation’s market income. After accounting for the effects of government tax and spending policies, we find that the share of the nation’s income earned by these families fell to 39.6 percent, which represents a 28 percent reduction of their pre-redistribution income.
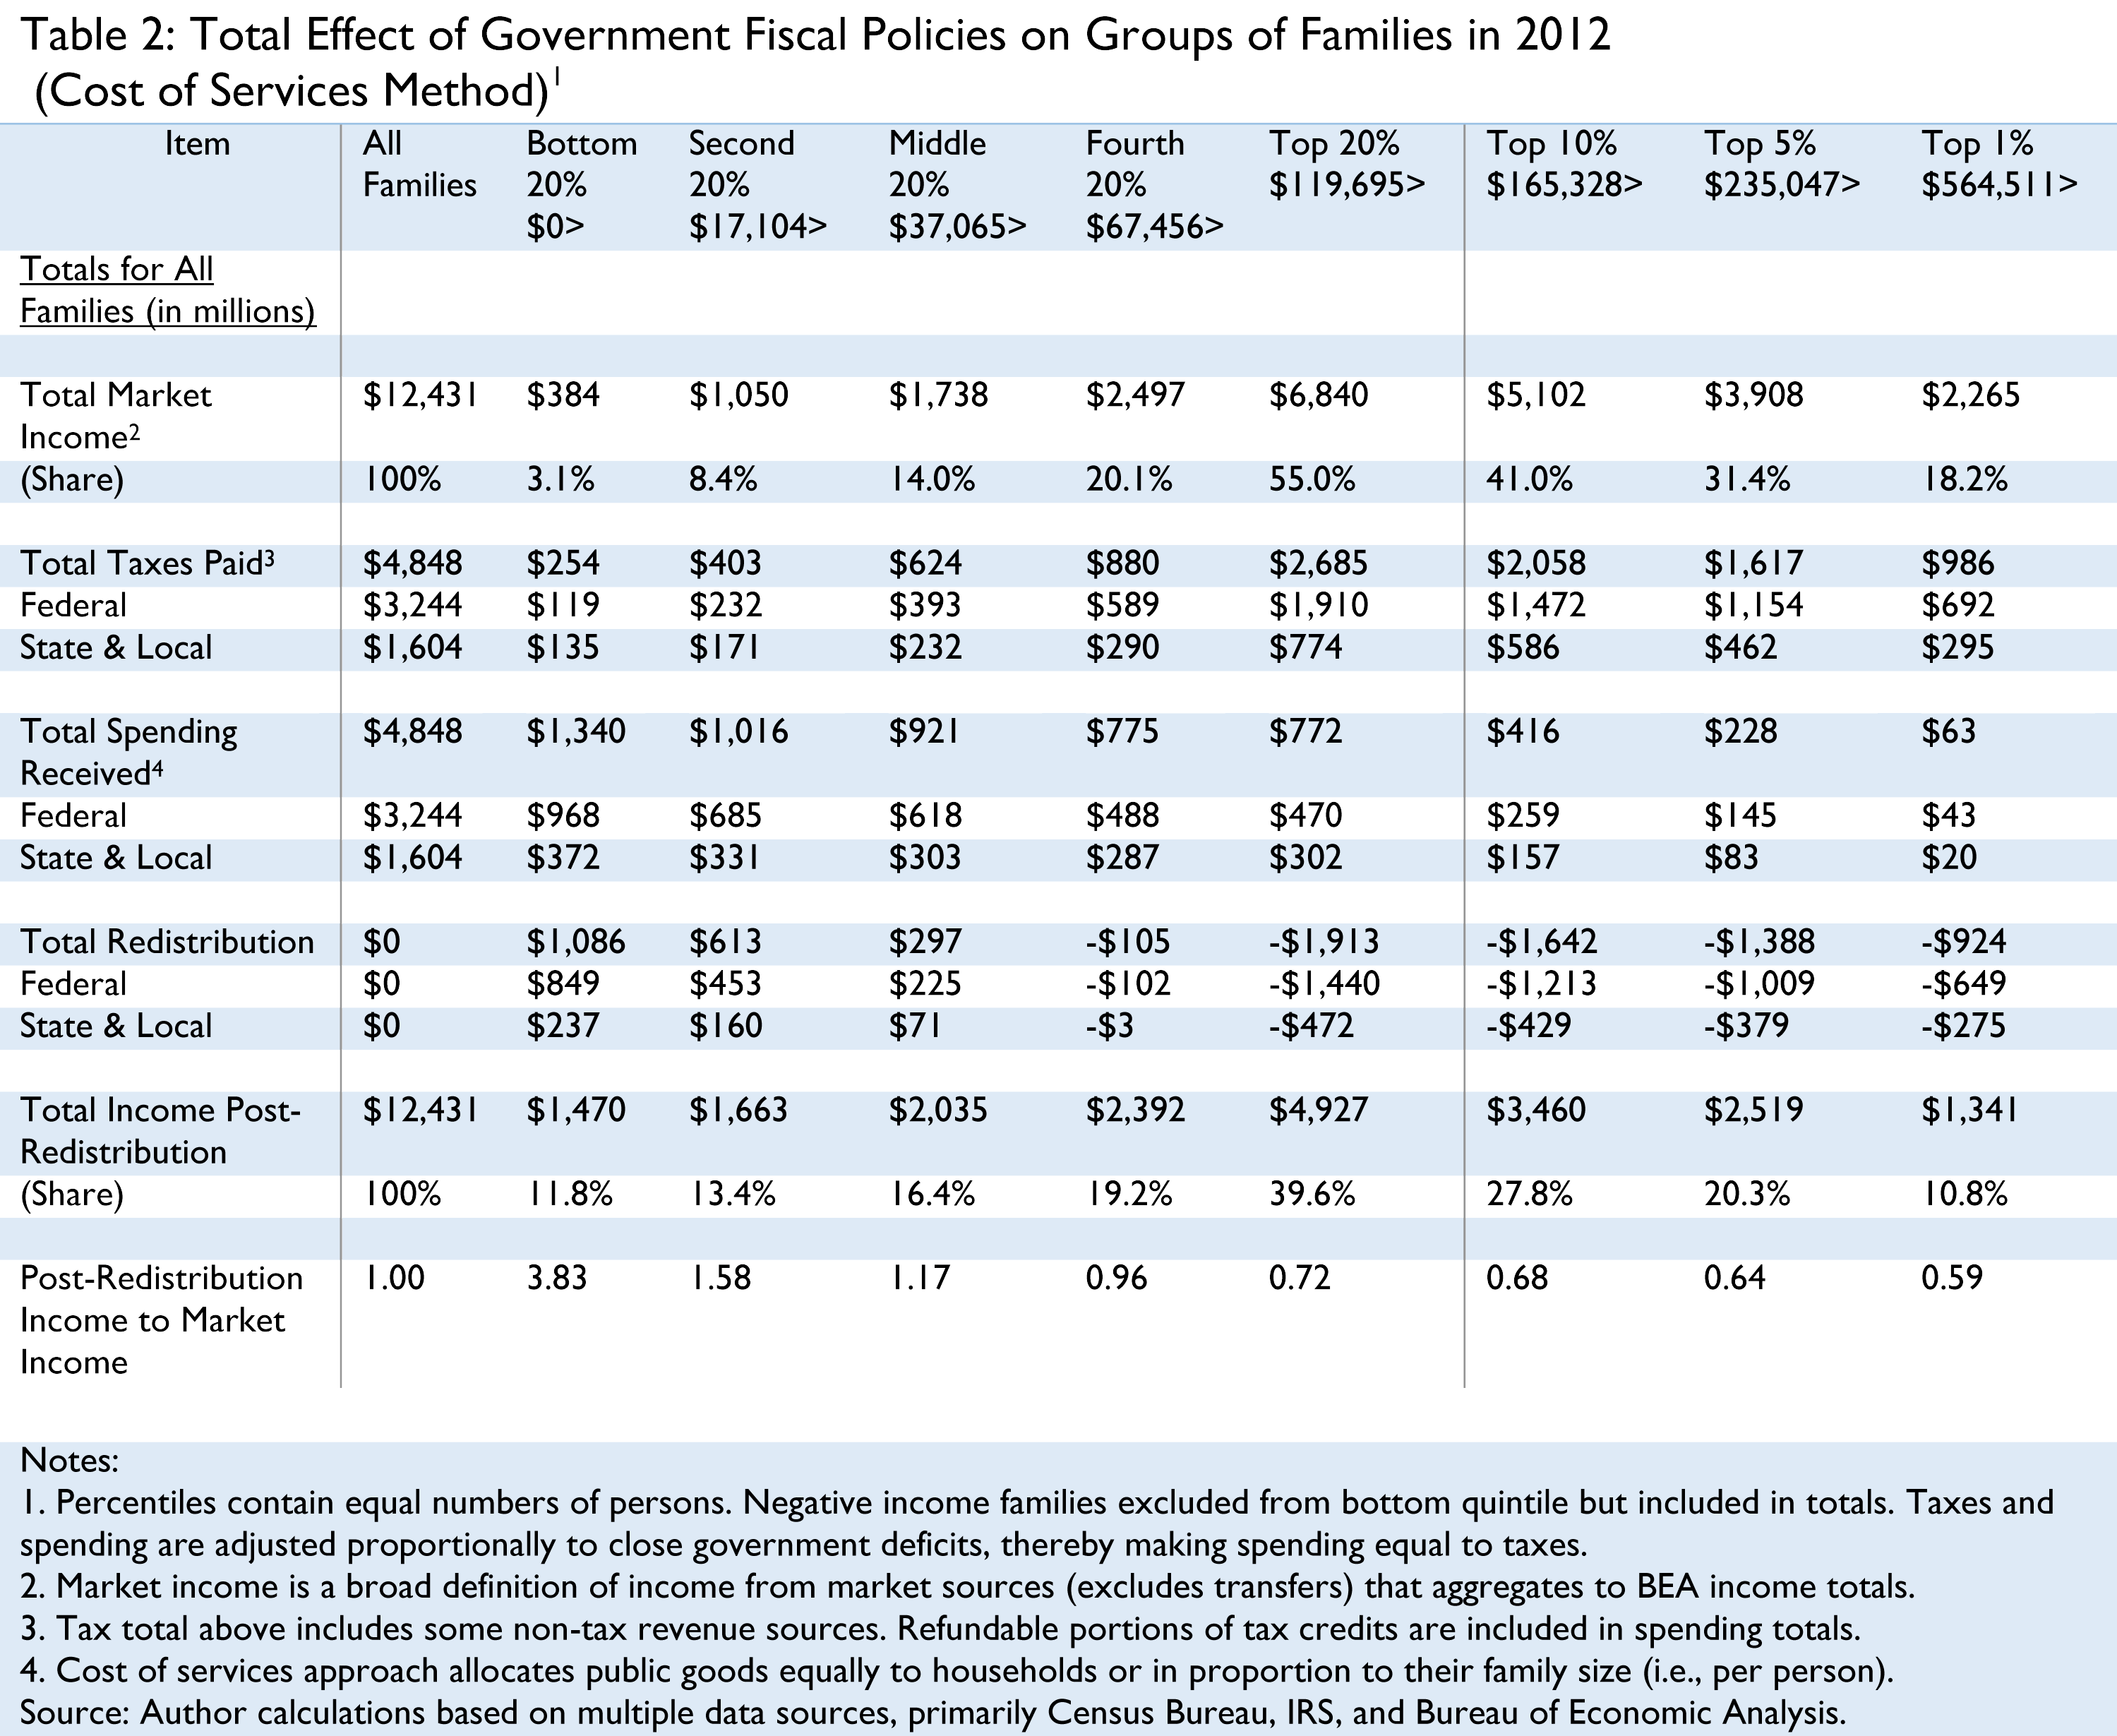
Not surprisingly, redistribution policies take a greater share of the income of families in the top 1 percent. In 2012, these families earned 18.2 percent of the nation’s income, or nearly $2.3 trillion. Government tax and spending policies redistribute $924 million from these families, a 40 percent reduction from their market income. As a result, the top 1 percent’s share of the nation’s income dropped to 10.8 percent.
For the bottom quintile, the opposite occurs. The bottom 20 percent of the population earned 3.1 percent of total market income in 2012, but redistribution increased their incomes by $1.1 trillion, or nearly 74 percent. Thus, redistribution increased their share of the nation’s market income to 11.8 percent. Families in the middle quintile also gained income from redistribution. Initially, these middle-income families earned 14 percent of the nation’s income, but redistribution added $297 billion to their incomes, an increase of 14.6 percent. Thus, their post-redistribution income share rose to 16.4 percent.
Individual Results Add Up To Total Redistribution
When aggregated, these results for average families tier up into a national measure of how much total income is redistributed by tax and spending policies from some groups of Americans to other groups. In total, as Chart 4 illustrates, the aggregate amount of income redistribution from the top two quintiles (the top 40 percent) to the bottom 60 percent in 2012 is estimated to be $2.02 trillion. Federal tax and spending policies account for more than $1.5 trillion of the total amount of government redistribution while state and local governments redistributed $475 billion.

Table 2 shows these results in more detail. Approximately half of the $2 trillion in total income redistribution flows to families in the bottom quintile, while the other half flows to the second and third (middle) quintiles. Within the top 40 percent, nearly half of the income redistributed from that group comes from families in the top 1 percent. Only a small fraction of the redistributed income comes from the fourth quintile.
Distribution of Federal vs. State and Local Fiscal Policies
There are many reasons why the federal government’s fiscal policies are more redistributive than the fiscal policies of state and local governments. First and most obvious, the federal government simply spends more and taxes more than state and local governments. In 2012, the federal government spent twice as much as state and local governments.[5]
Second, the federal tax system is more progressive, especially the income tax. Because state and local governments tend to rely more on sales taxA sales tax is levied on retail sales of goods and services and, ideally, should apply to all final consumption with few exemptions. Many governments exempt goods like groceries; base broadening, such as including groceries, could keep rates lower. A sales tax should exempt business-to-business transactions which, when taxed, cause tax pyramiding. es and property taxA property tax is primarily levied on immovable property like land and buildings, as well as on tangible personal property that is movable, like vehicles and equipment. Property taxes are the single largest source of state and local revenue in the U.S. and help fund schools, roads, police, and other services. es rather than progressive income taxes, these systems impose a greater tax burden on low-income families than the federal government.
Third, the spending done by state and local governments is less focused on transfer programs. State and local governments tend to be engaged more primarily in providing core government services to citizens such as education and public safety. Finally, those state and local government programs that are transfer programs are typically financed in large part via aid from the federal government. In order to avoid double-counting, this study classifies state and local spending that is financed via federal government aid as federal government spending.[6]
Trends from 2000 to 2012
This section addresses the question of how much government redistribution via fiscal policy has changed since the turn of the century. In other words, have fiscal policies overall in the United States become more or less progressive since 2000?
Fiscal policy in the United States has undergone many significant changes since 2000, especially at the federal level. From 2001 through 2006, President Bush and the Republican Congress enacted many income tax cuts, most of which are still in effect today. These tax cuts were primarily across-the-board tax cuts that cut taxes for all income taxpayers. In 2009, President Obama and the Democratic Congress enacted even more tax cuts, primarily targeted at low-and-middle income taxpayers. That portion of the Bush tax cuts that went to high-income taxpayers was eventually scaled back in 2013. This study’s final year, however, is 2012, a year in which the Bush income tax cuts for high-income earners were still fully in place.[7]
While the federal government was cutting income taxes over the past twelve years, it was also increasing spending. Spending for defense and homeland security was increased considerably following the September 11 terrorist attacks and for the wars in Iraq and Afghanistan. Spending on Medicare has increased since 2000 due to the continuing rise in health care costs as well as the new Medicare Part D prescription drug law that was passed in 2004. Finally, spending was increased over the past few years as the government implemented many new programs in response to the 2008 financial crisis and the subsequent recessionA recession is a significant and sustained decline in the economy. Typically, a recession lasts longer than six months, but recovery from a recession can take a few years. . Most notable of these programs were the Troubled Asset Relief Program (TARP) and the 2009 American Recovery and Reinvestment Act (ARRA), also known as the stimulus bill, which cut taxes and increased government spending. Overall, due to the lower revenues and higher spending, federal budget deficits increased dramatically from the small budget surpluses that existed at the turn of the century, with the sharpest uptick in the deficit occurring from 2008 onward.
At the state and local level, states faced fiscal pressures following the recessions of 2001 and 2008, prompting some to raise taxes, cut spending, or both. Overall, however, state and local taxes increased at roughly the same rate as incomes over the twelve-year period. Generally, property tax collections grew faster than other major tax sources, although they slowed down considerably following the bursting of the housing bubble. Individual income taxes, which are a major, progressive state and local tax source, grew slower than incomes. The third major state and local tax category, sales taxes, grew at roughly the same rate as incomes.
On the state and local expenditures side, health care expenditures increased faster than incomes, while expenditures on education increased at roughly the same rate as incomes. In totality, state and local spending increased faster than both incomes and taxes over the twelve-year period. Overall though, the changes in fiscal policy made by state and local governments pale in comparison to the changes made at the federal level.
Changes in the Distribution of Taxes and Spending from 2000-2012
These changes in fiscal policies and economic conditions over the past twelve years have had a measureable impact on the distribution of government taxes and spending. That being said, estimating how the distribution has changed in that time period is difficult due to the historically large federal budget deficits that have been in place since 2008. Specifically, because the federal budget deficits over the past five years have been so large, estimates of how the distribution of taxes and spending has changed in that time period depend largely on the methodological treatment of budget deficits (outlined in the methodology section below).
The baseline results for this paper find that income redistribution has increased slightly since 2000. These results are based on the assumption that today’s deficits are essentially borne by, or paid for, in some way by today’s taxpayers. The way we account for this assumption is to “close” the deficit by proportionally increasing taxes and lowering spending on today’s households. (The methodology section explains this in more detail.)[8]
However, another approach is to assume that today’s deficits are a transfer of income from future generations to today’s taxpayers. The purpose of this section of the study is to give readers a better understanding of how these two approaches affect the question of how much redistribution has changed over time.

Table 3 shows the amount of income redistribution as a percentage of market income for each of the five quintiles from 2000 to 2012. Positive figures indicate that the typical family in that group saw an increase in their overall income as a result of redistribution, while negative figures indicate that the typical family in that group saw a reduction in their overall income as a result of redistribution.
The results are presented under both approaches: (1) changes in the amount of income redistribution assuming the deficit is closed on current taxpayers, and (2) changes in redistribution assuming the deficit is redistribution from future taxpayers.
Changes in the Amount of Income Redistribution Assuming Deficit Is Closed on Current Taxpayers
Starting first with the base scenario that current deficits are borne by current taxpayers, we can see that there has been a shift in the amount of redistribution to lower-income groups over the past dozen years. For example, in 2000, typical families in the bottom quintile saw their incomes rise by 340 percent as a result of redistribution. The amount of redistribution benefiting these families hit its lowest point in 2007 (during the peak of the economy’s growth), boosting their incomes by about 274 percent.
After 2008, the amount of redistribution to these low-income families began to grow again as a result of a combination of new government programs put in place following the onset of the Great Recession (including the 2009 stimulus bill) and of greater claims for unemployment benefits. By 2012, however, the amount of redistribution to this group had climbed back to 283 percent of their incomes, still short of the level in 2000.
The apparent decline in redistribution to the bottom quintile over the past dozen years is not necessarily due to a reduction in spending on them. Instead, it is largely due to the fact that the market income of these families grew fairly quickly from 2000 to 2012 and their resulting share of total taxes increased during that time period. Thus, the amount of spending they receive is smaller relative to their higher incomes and tax payments.
By contrast, the amount of redistribution to the second and middle quintiles did increase over the past dozen years. In 2000, redistribution meant a 50 percent increase in overall income for families in the second quintile and a 15 percent increase in income for middle-income families. By 2012, redistribution delivered a nearly 60 percent increase in overall income for typical families in the second quintile and a 17 percent increase in income for middle-income families.
The increase in redistribution to these two income groups is largely the result of the growth of federal income tax credits, especially refundable credits, targeted at helping working families. Families in the bottom quintile generally do not benefit from tax credits. Most either do not file federal income tax returns because they do not work, or they may be ordinarily “well-off” families who simply had a bad year in business or investments. However, the second and middle quintiles are home to many working families who benefit from tax credits such as the Earned Income Tax Credit (EITC) and the Child Credit, both of which were expanded in the 2000 to 2012 time period.
Not surprisingly, the increased redistribution to low- and middle-income working families has come at the expense of high-income working families and the wealthy. Again, Table 3 shows the increase in the amount of income lost to redistribution by high-income families. For example, in 2000, families in the fourth quintile (with incomes between $67,456 and $199,695) lost 3.3 percent of their income to redistribution. By 2012, that share had increased to 4.2 percent.
Families in the top quintile (those earning over roughly $120,000) saw an even greater share of their income lost to redistribution over the past dozen years. In 2000, their incomes dropped by about 25 percent due to redistribution. By 2012, that share had increased to 28 percent.
The top 1 percent of families also lost more of their income to redistribution over the past twelve years. In 2000, redistribution reduced their incomes by 37 percent. But by 2012, that share had increased to nearly 41 percent.
We should note that the methodological assumptions of our base scenario plays a part in these results, most evidently at the top of the income scale. As was mentioned above, in our base scenario we assume that deficits are not redistribution from the future. Thus, half of these high deficits are closed by proportionally higher federal taxes, and because high-income families pay a disproportionate share of the federal taxes (see Table 1), these deficit-induced tax increases cause the amount of redistribution from the top income groups to increase.
Changes in Redistribution Assuming the Deficit Is Redistribution from Future Taxpayers
By contrast, if we consider deficits as redistribution from future generations, then the net level of redistribution from the top quintile has actually decreased over the past twelve years, while the amount of redistribution has increased to all other quintiles. In essence, today’s families are all winners if deficits are assumed to be redistribution from future generations. That is because under this scenario, these households bear none of the costs of current deficits either through higher taxes or reduced spending.
Nowhere is this more evident than in the results for the fourth quintile. Table 3 shows that in 2000, families in the fourth quintile lost 5.5 percent of their income to redistribution. By 2007, as a result of rising incomes, the amount of income lost to redistribution by these families fell to just 0.3 percent. However, in 2008, when the economy went into recession and deficits began to soar, these families became net beneficiaries of redistribution from the future. When the deficit topped 10 percent of GDP in 2009, the redistribution from future taxpayers boosted the overall income of these families by 6.8 percent. Lower deficits today have reduced this share to 4.7 percent.
Table 3 shows that the amount of redistribution received by both the second and middle quintiles increased even more under this assumption than under the base scenario assumption that deficits are borne by today’s taxpayers. The amount of redistribution to the second quintile jumped from about 46 percent of income in 2000 for these families to more than 76 percent today. The amount of redistribution enjoyed by middle-income families grew from over 12 percent in 2000 to more than 29 percent today at the expense of future taxpayers.
Conclusion
When analyzed in the aggregate, governments at all levels in the United States redistribute a significant amount of money via tax and spending policies, although the magnitude depends on the methodological assumptions made with regard to the distribution of major public goods like national defense and the budget deficit. Overall, this report shows that when one assumes a cost of services approach to government spending—which allocates the government’s cost of providing public goods evenly across families—governments at all levels redistributed approximately $2 trillion from the top 40 percent of the income spectrum to the bottom 60 percent in 2012.[9]
Federal tax and spending policies drive most of the redistribution in America today. The lowest-income families receive $8.13 in federal spending for every $1 dollar they pay in federal taxes. Middle-income families receive $1.57 in federal spending for every $1 they pay in federal taxes. However, high-income families receive $0.25 cents in federal spending for every $1 they pay in federal taxes.
Comparing redistribution since 2000, one can see that the amount of income redistribution from the top quintile, when measured as a percentage of the group’s market income, has increased over the past twelve years when one assumes that today’s large budget deficits are borne by today’s taxpayers, although income redistribution to the bottom quintile has fallen when using that same metric. However, it will surprise many to learn that over the past twelve years, redistribution to middle- and lower-income families has increased measurably.
The ultimate lesson of this study is that taxes and spending both have distributional effects. When lawmakers focus solely on tax distribution and ignore spending distribution they get a highly distorted picture of how the nation’s fiscal system treats Americans in different income groups. Lawmakers can remove equity as an issue in tax reform by matching any loss in progressivity on the tax side with an equal increase in progressivity on the spending side.
Study Methodology
At its most basic level, this study allocates hundreds of tax and spending categories to each family using Bureau of Economic Analysis (BEA) aggregate data and a microsimulation model. The microsimulation model is based on a microdata set that represents the entire population and simulates participation in government spending programs and taxes. The aggregate values for the tax and spending categories for each year come from various tables produced by BEA.
Many methodological decisions must be made when conducting a study such as this. For example, how should spending on public goods such as national defense be distributed across income groups—on an equal basis, according to income, or some other variable like wealth? How should in-kind (non-cash) transfer payments like Medicaid be allocated? Who bears the burden, and how much, of interest on the national debt?
The thorniest of these issues is the treatment of public goods like national defense. There are generally two schools of thought regarding how government spending should be treated: the “cost of services” approach and the “benefit principle” approach.
The cost of services approach distributes government spending based on each family's share of the total cost to government from providing the government service. The cost of services approach makes no assumptions about how people benefit from public goods, it simply divides the spending equally across families based on the government’s cost of providing the service.
For example, under the cost of services approach, national defense is distributed to each family based on the average cost of provision, where the average cost is based on each household and the number of persons. Specifically, 50 percent of national defense is distributed evenly to each household, while 50 percent of national defense is distributed evenly to each person.
By contrast, the benefit principle approach distributes the spending on public goods to people based on their share of the nation’s income; in other words, high-income people are assumed to derive more benefits from national defense than low-income people. Here we distribute government spending based on each family's share of the benefit from each government program. The benefit of a spending program for a family is how much the family would (hypothetically) be willing to pay to keep that program in existence.[10] For example, under the benefit principle approach, national defense is distributed to each family based on each family's share of the nation's income, as it is assumed that high-income families would be willing to pay more for national defense than low-income families.
For simplicity, this report presents the results solely in the context of the cost of services approach. However, the results under the benefit principle approach are presented in the appendix of this special report, below. The comprehensive study upon which this report is based discusses the results thoroughly under both approaches. That study is available at https://taxfoundation.org/article/distributional-analysis-fiscal-policies-united-states-2000-2012.
Because the income-based benefit principle approach assumes that more public goods spending flows to wealthier households than under the more uniform cost of services approach, we find that this measure shows less redistribution overall, but that amount is still significant. For example, the income-based benefit principle approach shows that in 2012 governments at all levels redistributed approximately $1.2 trillion from the top 40 percent of the income spectrum to the bottom 60 percent.
On the other hand, if we assume that the benefits of public goods are more evenly distributed across all families (cost of services approach), we find that the total amount of redistribution is $2 trillion. Using either method, federal tax and spending policies are responsible for the vast majority of redistribution—nearly $1 trillion worth using the income-based (benefit principle) method and nearly $1.5 trillion using the cost of services approach.
In addition to transfers and consumption items, governments in the United States also spend a large amount each year financing debt. In this study, this spending is distributed to each family based upon the family's share of all other government spending.
Another critical issue is how to account for large federal deficits. For the purposes of this study, we assume that the burden of current deficits falls on current taxpayers.[11] In order to account for this, government deficits are closed by decreasing spending proportionally and increasing taxes proportionally. The split is half and half. For example, if government ran deficits of $200 billion, this study would increase taxes by $100 billion and decrease spending by $100 billion.[12] Overall, this methodological adjustment allows for a better estimate of redistribution in a given year and is consistent with the research question laid out in the comprehensive study.[13]
For most major federal taxes, this study's method of allocation follows those of existing respected distributional analyses such as those done by the Congressional Budget Office, the Joint Committee on Taxation, and the Urban-Brookings Tax Policy Center. For the individual income tax, the aggregate tax amount is allocated based on family income tax liabilities simulated using a tax calculator. In economic terms, this means that the economic incidence is assumed to be the same as the legal tax liability.
Federal payroll taxes are assumed to be borne entirely by the wage earner, including both the employee and employer portions. For federal consumption taxA consumption tax is typically levied on the purchase of goods or services and is paid directly or indirectly by the consumer in the form of retail sales taxes, excise taxes, tariffs, value-added taxes (VAT), or an income tax where all savings is tax-deductible. es (such as tariffTariffs are taxes imposed by one country on goods or services imported from another country. Tariffs are trade barriers that raise prices and reduce available quantities of goods and services for U.S. businesses and consumers. s, excise taxAn excise tax is a tax imposed on a specific good or activity. Excise taxes are commonly levied on cigarettes, alcoholic beverages, soda, gasoline, insurance premiums, amusement activities, and betting, and typically make up a relatively small and volatile portion of state and local and, to a lesser extent, federal tax collections. es on tobacco, alcohol, gasoline, etc.), the burden is assumed to be borne by end-use consumers. Finally, for the federal corporate income taxA corporate income tax (CIT) is levied by federal and state governments on business profits. Many companies are not subject to the CIT because they are taxed as pass-through businesses, with income reportable under the individual income tax. , half of the amount is distributed to each family based on its share of overall labor compensation (such as income from wages and supplements to wages such as employer-provided health insurance), while the other half is distributed to each family based on its share of capital income (e.g., income from capital gains, interest, dividends, etc.).
At the state and local level, individual income taxes, sales taxes and property taxes make up the bulk of tax collections. For sales taxes, it is assumed that the taxes are passed forward to the end user of all consumer goods, whether the taxable sale occurs directly to the consumer or via a business-to-business transaction. For each family in the microsimulation model, direct sales taxes are estimated using Consumer Expenditures Survey data on consumption by product. (This takes into account the fact that items like medicine and groceries are typically taxed at preferential rates, as well as the fact that consumption using Supplemental Nutrition Assistance Program benefits is not subject to sales taxation.) The business-to-business portion of sales taxes is allocated to families based on overall total consumption.
The issue of how to allocate state and local property taxes is important and has been somewhat controversial among tax experts. This study sought to use the new view of the property tax.[14] The new view assumes that each asset's property tax is composed of a general tax on capital component (based on the national average rate) and an excise tax (or subsidy) component equal to the difference between the specific asset's rate and the overall national average rate. However, because finding specific asset tax rates for every jurisdiction across the nation is virtually impossible, a simplified method for allocating the property tax is used.
Specifically, national property tax collections (excluding personal property) are divided into four categories and then allocated based on individual allocators: property taxes paid by non-residential corporate business (allocated via corporate capital income), property taxes paid by non-residential non-corporate business (allocated via non-corporate business income), property taxes paid on owner-occupied housing (allocated via real estate taxAn estate tax is imposed on the net value of an individual’s taxable estate, after any exclusions or credits, at the time of death. The tax is paid by the estate itself before assets are distributed to heirs. es paid), and property taxes paid on rental housing (allocated via rent consumption, adjusted for state property tax differentials). Under these assumptions, the property tax is regressive at the low end of the income spectrum but progressive at the top end of the income spectrum.
Finally, it should be noted that this study simply distributes the aggregate amounts from the Bureau of Economic Analysis and therefore accounts neither for any economic surplus from government spending programs nor for any excess burdens or distortions from taxation. (The comprehensive study discusses this issue further.) This study also ignores the distributional effects of the costs and benefits of regulatory policies, except to the extent that taxes finance regulatory agencies.
Appendix: Benefit Principle Approach
The tables and figures in this appendix present the results under the benefit principle approach as opposed to the cost of services approach presented in the main body of this report. The benefit principle approach shows a smaller level of redistribution from high-income families to low-income families than the cost of services approach. Because the benefit principle approach distributes most public goods according to cash income shares, spending is significantly skewed to high-income taxpayers under the benefit principle approach, unlike the cost of services approach where spending is distributed fairly equally across the population.
A summary table showing the difference in key results under the cost of services approach and the benefit principle approach is presented in Table A-0. The comprehensive study upon which this special report is based discusses in more detail the differences between the two approaches.


References
Andrew Chamberlain & Gerald Prante, Who Pays Taxes and Who Receives Government Spending? An Analysis of Federal, State and Local Tax and Spending Distributions, 1991-2004, Tax Foundation Working Paper No. 1, https://files.taxfoundation.org/docs/wp1.pdf.
Congressional Budget Office, The Distribution of Household Income and Federal Taxes, 2008 and 2009 (July 2012), http://www.cbo.gov/publication/43373.
Bureau of the Census, Current Population Survey, http://www.census.gov/cps/.
Bureau of the Census, Statistics of U.S. Businesses, http://www.census.gov/econ/susb/.
Bureau of the Census, Nonemployer Statistics, https://www.census.gov/econ/nonemployer/.
Bureau of the Census, State and Local Government Finances, http://www.census.gov/govs/local/.
Bureau of Economic Analysis, NIPA Tables, http://www.bea.gov/national/index.htm.
Bureau of Economic Analysis, Regional Accounts Tables, http://www.bea.gov/regional/index.htm.
Bureau of Labor Statistics, Consumer Expenditures Survey, http://www.bls.gov/cex/.
Daniel Richard Feenberg & Elizabeth Coutts, An Introduction to the TAXSIM Model, 12 Journal of Policy Analysis and Management 189-194 (1993), available at http://users.nber.org/~taxsim/feenberg-coutts.pdf.
Ernst & Young LLP, Total State and Local Business Taxes, http://www.cost.org/WorkArea/DownloadAsset.aspx?id=84767.
Federal Reserve Board of Governors, Survey of Consumer Finances (multiple years), http://www.federalreserve.gov/econresdata/scf/scfindex.htm.
Gerald Prante & Patrick Fleenor, How Much Does President Obama’s Budget Redistribute Income?, Tax Foundation Special Report No. 172 (Sept. 21, 2009), https://files.taxfoundation.org/docs/sr172.pdf.Internal Revenue Service, SOI Tax Stats—Individual Income Tax Return (Form 1040) Statistics (various years), http://www.irs.gov/uac/SOI-Tax-Stats-Individual-Income-Tax-Return-Form-1040-Statistics.
National Bureau of Economic Research, Internet TAXSIM Version 9.2 With ATRA, http://nber.org/~taxsim/taxsim-calc9/index.html.
Jeff Rohaly, Adam Carasso, & Mohammed Adeel Saleem, The Urban-Brookings Tax Policy Center Microsimulation Model, Jan. 10, 2005, http://www.taxpolicycenter.org/publications/url.cfm?ID=411136.
Tax Foundation, State Sales, Gasoline, Cigarette, and Alcohol Tax Rates by State, 2000-2010, Apr. 1, 2010, https://taxfoundation.org/article/state-sales-gasoline-cigarette-and-alcohol-tax-rates-state-2000-2010.
Tax Foundation, State and Local Sales Tax Rates, 2011-2013, Mar. 14, 2013, https://taxfoundation.org/article/state-and-local-sales-tax-rates-2011-2013.
Tax Foundation, Allocating Tax Burdens and Government Benefits by Income Class, Tax Foundation Government Finance Brief No. 8 (1967), https://taxfoundation.org/article/allocating-tax-burdens-and-government-benefits-income-class.
Tax Foundation, Allocating Tax Burdens and Government Benefits by Income Class, 1972-73 and 1977, Tax Foundation Government Finance Brief No. 31(Feb. 1, 1981), https://taxfoundation.org/article/allocating-tax-burdens-and-government-benefits-income-class-1972-73-and-1977.
[1] Gerald Prante Ph.D. is adjunct fellow at the Tax Foundation. Scott Hodge is president of the Tax Foundation.
[2] Detailed information about the study and its methodology may be found in its accompanying white paper. See Gerald Prante, A Distributional Analysis of Fiscal Policies in the United States, 2000-2012, Tax Foundation Working Paper No. 9 (Nov. 5, 2013), https://taxfoundation.org/article/distributional-analysis-fiscal-policies-united-states-2000-2012. For previous Tax Foundation studies on the measurement of redistribution include: George A. Bishop, Tax Burdens and Benefits of Government Expenditures by Income Class, 1961 and 1965, Tax Foundation Research Publication No. 9 (Jan. 1967), https://taxfoundation.org/article/tax-burdens-and-benefits-government-expenditures-income-class-1961-and-1965; Andrew Chamberlain & Gerald Prante, Who Pays Taxes and Who Receives Government Spending? An Analysis of Federal, State and Local Tax and Spending Distribution, 1991-2004, Tax Foundation Working Paper No.1 (Mar. 22, 2007), https://taxfoundation.org/article/who-pays-taxes-and-who-receives-government-spending-analysis-federal-state-and-local-tax-and; Gerald Prante & Patrick Fleenor, How Much Does President Obama's Budget Redistribute Income?, Tax Foundation Special Report No. 172 (Sept. 21, 2009), https://taxfoundation.org/article/how-much-does-president-obamas-budget-redistribute-income-0.
[3] Family is the unit of analysis, which is narrower than households. Income percentiles contain an equal number of persons and an unequal number of families. Because high-income families tend to have a larger number of persons per family, percentiles at the top of income spectrum contain fewer units than those at the bottom.
[4] Market income is income derived from the returns to labor and capital—wages and salaries, supplements to wages such as health and retirement benefits, and capital income sources such as capital gains, dividends, interest, rental income, etc. Market income excludes government transfers such as Social Security, unemployment benefits, etc.
[5] This ignores state and local spending that is financed via aid from the federal government, as described elsewhere in the paragraph.
[6] This is done in order to match up the spending to the ultimate taxes financing the spending. Programs that are jointly financed by federal and state/local governments, such as Medicaid, are included partially as federal government spending and partially as state/local government spending.
[7] Also in 2013, new taxes to finance the Affordable Care Act went into effect; and in 2014, the bulk of the spending for ACA begins. Therefore, income redistribution will likely increase further when this type of analysis is done again in the future. For an analysis of the distributional effects of the Affordable Care Act, see Gerald Prante & Patrick Fleenor, Health Care Reform: How Much Does It Redistribute Income?, Tax Foundation Fiscal Fact No. 222 (Apr. 15, 2010), https://taxfoundation.org/article/health-care-reform-how-much-does-it-redistribute-income.
[8] The fundamental question posed in this study is, “What would a family’s taxes paid equal if its share of the tax burden was equal to its share of government spending?” One could also ask, “What would a family’s government spending equal if its share of government spending was equal to its share of taxes paid?” In a balanced budget world, these two approaches provide equivalent answers to estimating the amount of redistribution.
[9] When one assumes a benefit principle approach, there is much less redistribution ($1.2 trillion). Results under the benefit principle approach are presented in the appendix.
[10] Technically, the hypothetical question is, “How much would this family be willing to pay for this program assuming the benefits were fully excludable?”
[11] Since the purpose of this study is to measure redistribution, we are essentially assuming that deficits are not redistribution from the future. Milton Friedman famously argued that spending is taxation.
[12] Taxes are increased for each family proportional to its total taxes paid, and spending is decreased for each family proportion to its total spending.
[13] As noted previously, the fundamental question posed in this study is, “What would a family’s taxes paid equal if its share of the tax burden was equal to its share of government spending?” One could also ask, “What would a family’s government spending equal if its share of government spending was equal to its share of taxes paid?” In a balanced budget world, these two approaches provide equivalent answers to estimating the amount of redistribution.
[14] For a layman’s overview of the debate over the incidence of the property tax, see lecture notes from Prof. John Yinger’s (Syracuse) public finance course, available at http://faculty.maxwell.syr.edu/jyinger/classes/PAI735/readings/notes_on.htm.