At the end of June, the Internal Revenue Service released the first set of tax return data from 2018. These are the first numbers on the effects of the Tax Cuts and Jobs Act (TCJA), which was passed in December of 2017. The preliminary data provides aggregate information by income group on a range of topics, including sources of income as well as deductions and credits taken by taxpayers.
It is important to note that this new information does not contain data from those who requested a filing extension. For this reason, it includes only about 80 percent of total income taxA tax is a mandatory payment or charge collected by local, state, and national governments from individuals or businesses to cover the costs of general government services, goods, and activities. liability for the year 2018.
Overall, the data seems to match expectations about changes. Let’s look at the highlights.
Tax Liability
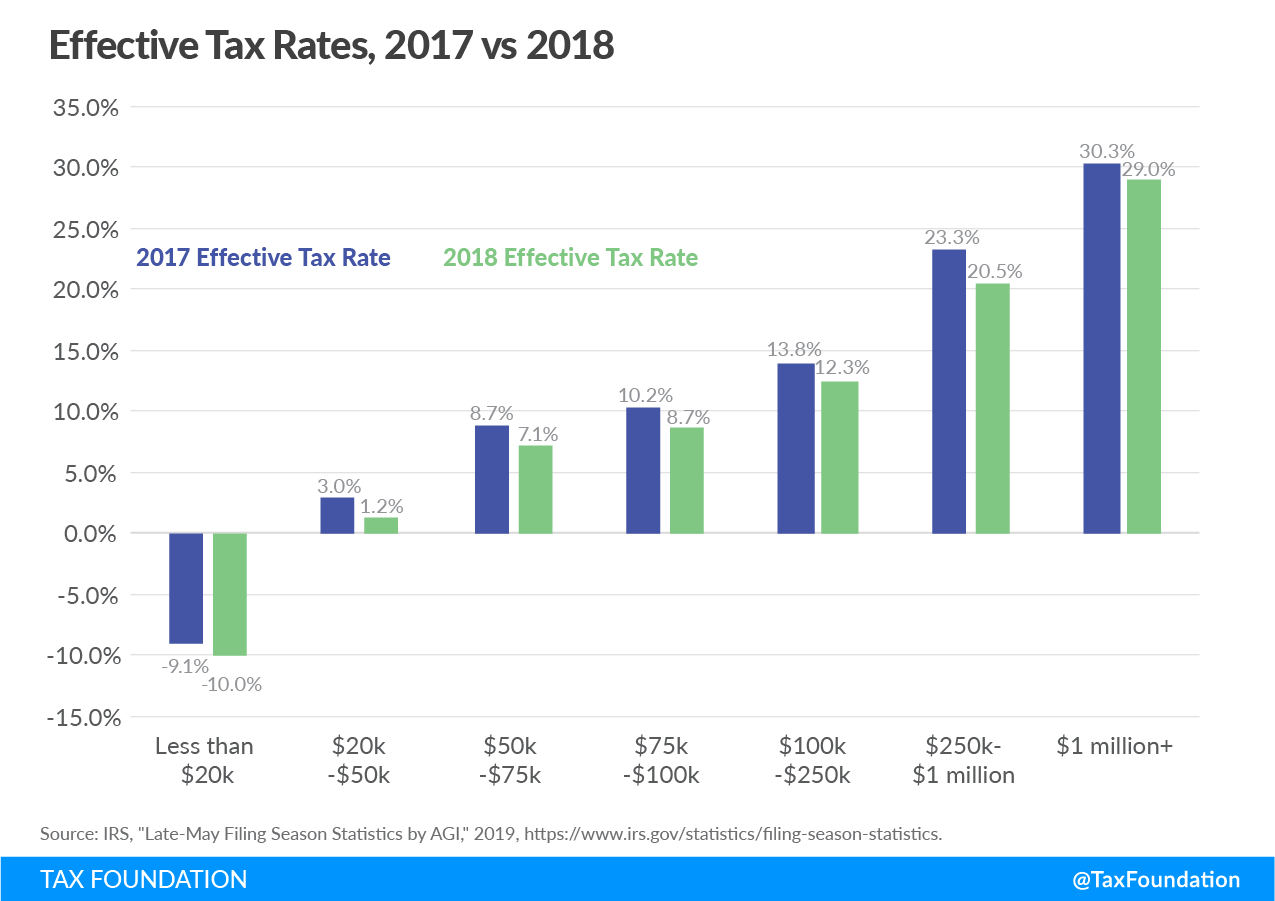
The visual below shows that the TCJA reduced effective tax rates, or total tax liability divided by an income group’s total adjusted gross incomeFor individuals, gross income is the total pre-tax earnings from wages, tips, investments, interest, and other forms of income and is also referred to as “gross pay.” For businesses, gross income is total revenue minus cost of goods sold and is also known as “gross profit” or “gross margin.” , for all income groups in 2018 compared to 2017. Importantly, even though taxpayers throughout income groups saw a tax cut on average, individual circumstances vary.
Taxpayers making less than $20,000 experienced negative effective tax rates because of refundable tax credits, including the Additional Child Tax Credit (ACTC) and Earned Income Tax Credit (EITC). Refundable tax credits allow taxpayers to receive a refund from the government when the amount of credit they are owed surpasses their tax liability.
Filing Methods
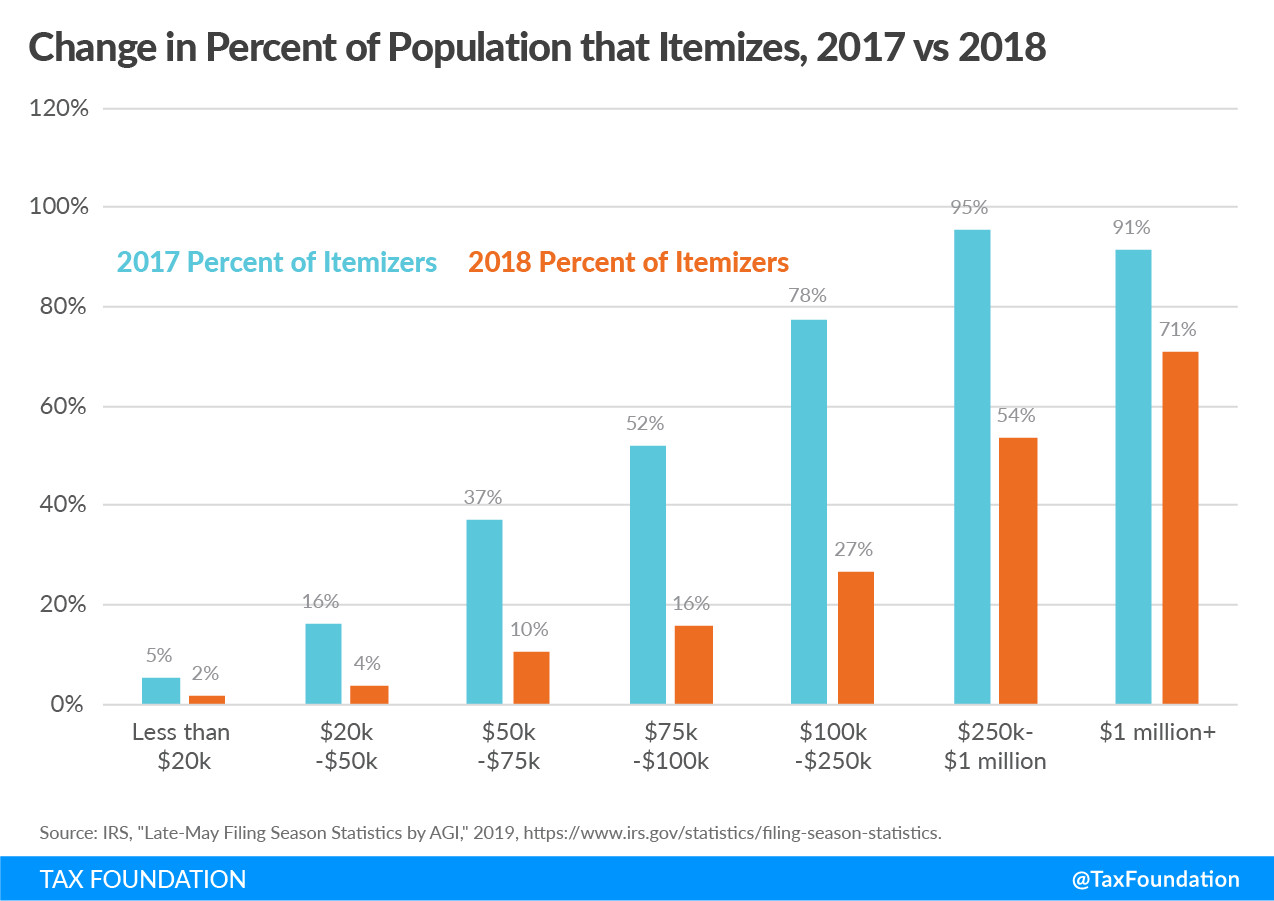
One of the most significant changes introduced by the TCJA was the expansion of the standard deduction. The standard deduction in 2018 increased from $6,500 to $12,000 for single filers, and from $13,000 to $24,000 for those married filing jointly. As shown below, the percent of taxpayers who itemized went down at all income levels. Overall, the percentage of the population that itemizes decreased from 30 percent to 10 percent.
Tax Returns and Withholding
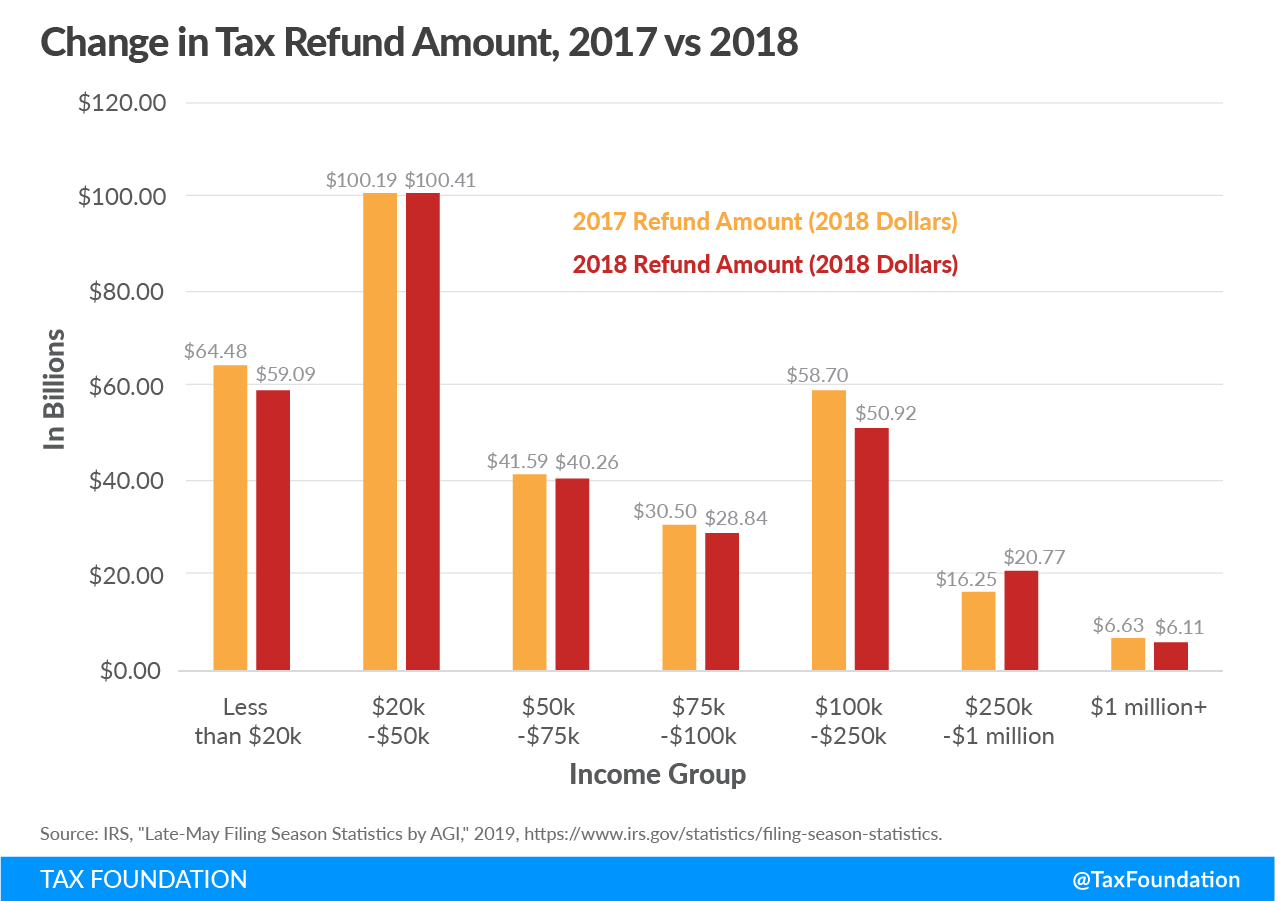
There was some friction during the 2019 filing season as changes to income tax withholdingWithholding is the income an employer takes out of an employee’s paycheck and remits to the federal, state, and/or local government. It is calculated based on the amount of income earned, the taxpayer’s filing status, the number of allowances claimed, and any additional amount of the employee requests. tables resulted in lower-than-expected tax refunds. Decreased tax returns, however, do not necessarily translate to increased tax liabilities.
Since individual-level data was not released on this topic, the graph below compares the aggregate refund returned to taxpayers in each income category before and after the TCJA. While refunds went down for some, recall that effective tax rates dropped across all income levels except the highest.
Child Tax CreditA tax credit is a provision that reduces a taxpayer’s final tax bill, dollar-for-dollar. A tax credit differs from deductions and exemptions, which reduce taxable income rather than the taxpayer’s tax bill directly.
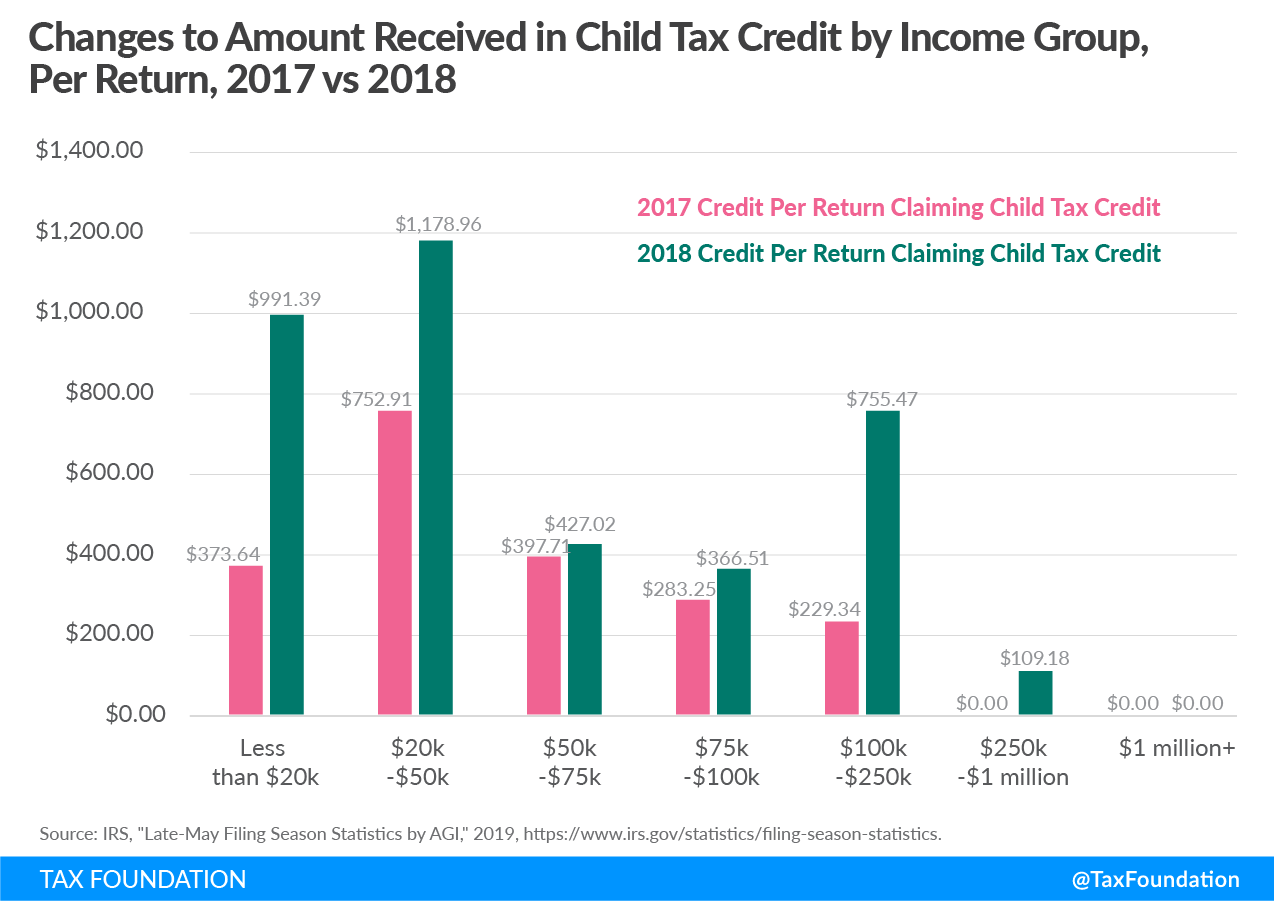
The TCJA increased the amount parents receive from the Child Tax Credit (CTC). The maximum credit amount increased from $1,000 to $2,000 per child in 2018. Additionally, the income level where the CTC begins to phase out increased from $110,000 to $400,000 for married taxpayers ($75,000 to $200,000 for single taxpayers). Overall, these changes broadened the scope and increased the cost of the program.
As seen in the graph below, the expansion benefited taxpayers across the income spectrum, except for the highest levels. Due to the higher phaseout threshold, parents in higher income levels were able to claim the credit for the first time.
Qualified Business Income
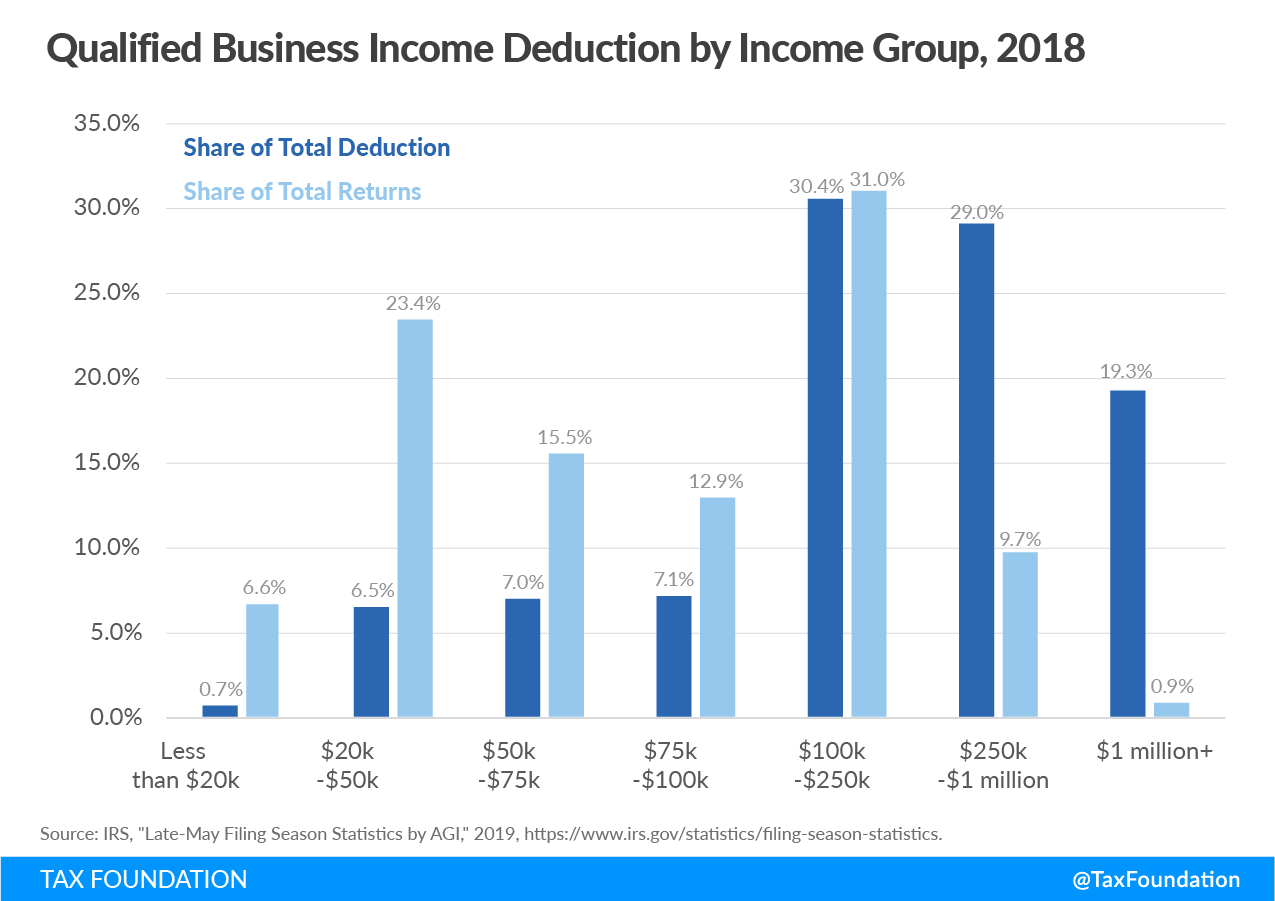
In 2018, certain taxpayers were able to claim the qualified business income (QBI) deduction, frequently referred to as “Section 199A” or the “pass-through deduction,” for the first time. Under this provision, taxpayers could deduct up to 20 percent of pass-through business income from their taxable income.
This data is the first look at the real cost of the pass-through deduction but remains incomplete; taxpayers who qualify for this deduction tend to be wealthy business owners with complex finances and are therefore more likely to request a filing extension.
Thus far, the benefits of the deduction are skewed towards those earning high income. This is especially true when you compare the number of people claiming QBI (or “Share of Total Returns”) to the amount they receive (or “Share of Total Deduction”) across income levels, as visualized in the graph below.
Conclusions
The TCJA was historic, but not perfect. The initial data shows that the TCJA expanded the use of several credits and deductions, made the standard deductionThe standard deduction reduces a taxpayer’s taxable income by a set amount determined by the government. It was nearly doubled for all classes of filers by the 2017 Tax Cuts and Jobs Act (TCJA) as an incentive for taxpayers not to itemize deductions when filing their federal income taxes. more favorable than itemizing, reduced tax refunds, and lowered taxes for most Americans. As data on the changes continues to roll in, it will remind us that federal tax reform is far from complete.
Erratum: Data used in an earlier version of this blog did not account for the refundable portions of the Earned Income Tax and Child Tax Credits. This data is now included.
