Key Findings
- Average wage earners in the United States face two major taxes: the individual income taxAn individual income tax (or personal income tax) is levied on the wages, salaries, investments, or other forms of income an individual or household earns. The U.S. imposes a progressive income tax where rates increase with income. The Federal Income Tax was established in 1913 with the ratification of the 16th Amendment. Though barely 100 years old, individual income taxes are the largest source and the payroll taxA payroll tax is a tax paid on the wages and salaries of employees to finance social insurance programs like Social Security, Medicare, and unemployment insurance. Payroll taxes are social insurance taxes that comprise 24.8 percent of combined federal, state, and local government revenue, the second largest source of that combined tax revenue. (levied on both the employee and the employer).
- Although a little more than half of a U.S. worker’s payroll tax burden is paid by his employer, the worker ultimately pays this taxA tax is a mandatory payment or charge collected by local, state, and national governments from individuals or businesses to cover the costs of general government services, goods, and activities. through lower take-home pay.
- The total tax burden faced by average wage earners in the United States is 31.7 percent of their pretax earnings, paying $17,558 in taxes in 2015, with $9,167 in individual income taxes and $8,391 in payroll taxes.
- The total tax burden faced by average U.S. workers is the 24th highest in the OECD, below the 34-country average of 35.9 percent.
- Many OECD countries have high payroll taxes, such as France, which places the highest payroll tax burden of 37.7 percent on average workers.
- In some countries, over 50 percent of workers’ total tax burden is paid by their employers.
- The tax burden for families in OECD countries is 25.3 percent lower on average than the tax burden on single, childless workers
Introduction
A significant source of tax revenue for most countries comes from taxes on wage income through individual income taxes and payroll taxes.[1] Most industrialized countries have progressive taxes on income, which means higher-income individuals are taxed at higher rates than lower-income individuals. However, many countries still place a substantial tax burden on average-income earners. While these taxes, especially payroll taxes, pay for major government programs, it is important to know what the cost of these programs is from the perspective of the average worker.
Currently, single workers earning an average wage in the United States with no children face a tax burden of 31.7 percent. This is lower than the average across the 34 OECD countries of 35.9 percent. The average tax burden on labor in the OECD is higher due mainly to higher payroll taxes. In the United States and most other OECD countries, the tax burden on workers with children is lower than it is for single, childless workers with the same pretax income.
Taxation of Wage Income in the United States
There are two major types of taxes that wage earners in the United States pay. First, individual income taxes are levied by federal, state, and sometimes, local governments to fund the general operations of government. Second, governments levy payroll taxes on both employees and the employers, though the economic burden of both ultimately falls on wage earners. Payroll taxes are dedicated to funding programs such as Social Security, Medicare, and Unemployment Insurance funds.
The Individual Income Tax
The most familiar component of wage taxation in the United States is the federal individual income tax. The federal income tax has a progressive rate structure with marginal rates on single filers that range from 10 percent on the first $9,275 of taxable incomeTaxable income is the amount of income subject to tax, after deductions and exemptions. Taxable income differs from—and is less than—gross income. to as high as 39.6 percent on income over $415,050. In 2013, 77 percent of taxpayers fell in the first two brackets, while less than 1 percent of taxpayers paid the top rate.[2]
| Table 1. 2016 Taxable Income Brackets and Rates | |||
| Rate | Single Filers | Married Joint Filers | Head of Household Filers |
| 10% | $0 to $9,275 | $0 to $18,550 | $0 to $13,250 |
| 15% | $9,275 to $37,650 | $18,550 to $75,300 | $13,250 to $50,400 |
| 25% | $37,650 to $91,150 | $75,300 to $151,900 | $50,400 to $130,150 |
| 28% | $91,150 to $190,150 | $151,900 to $231,450 | $130,150 to $210,800 |
| 33% | $190,150 to $413,350 | $231,450 to $413,350 | $210,800 to $413,350 |
| 35% | $413,350 to $415,050 | $413,350 to $466,950 | $413,350 to $441,000 |
| 39.60% | $415,050+ | $466,950+ | $441,000+ |
| Source: Tax Foundation |
On top of the federal income tax, 43 states and the District of Columbia tax individual income.[3] Local governments in 17 states also levy an individual income tax.[4]
Payroll Taxes
The United States levies two major payroll taxes on wages and salaries. The first tax is a 12.4 percent tax which is used to fund Social Security (Table 2). This tax is levied beginning on the first dollar an individual earns in wages and self-employment income up to a cap of $118,500 in 2016. This cap is adjusted to wage changes each year. On paper, the tax is paid half by employers and half by employees.
The second tax is a 2.9 percent payroll tax to fund Medicare. This tax is also levied beginning on the first dollar of income but has no cap. As with the Social Security payroll tax, this tax is split evenly between employers and employees. An additional 0.9 percent Medicare payroll tax applies to wage income over $200,000 (this cap is not adjusted for inflationInflation is when the general price of goods and services increases across the economy, reducing the purchasing power of a currency and the value of certain assets. The same paycheck covers less goods, services, and bills. It is sometimes referred to as a “hidden tax,” as it leaves taxpayers less well-off due to higher costs and “bracket creep,” while increasing the government’s spendin).[5]
| Table 2. Payroll Taxes, 2016 | |||||
| Taxable Earnings | Social Security | Medicare | Total | ||
| Employee | Employer | Employee | Employer | ||
| $0 – $118,500 | 0.062 | 0.062 | 0.0145 | 0.0145 | 0.153 |
| $118500 – $199,000 | 0 | 0 | 0.0145 | 0.0145 | 0.029 |
| $200,000 and over | 0 | 0 | 0.0235 | 0.0145 | 0.038 |
| Source: Social Security Administration (2016). |
Unemployment Insurance Taxes
Unemployment Insurance is a joint federal-state social insurance program that insures workers against an unexpected loss of income due to losing one’s job. The tax that funds this program is a payroll tax levied on the employer.
The federal unemployment tax is 6 percent on the first $7,000 of payroll. However, states also set UI tax rates to fund their portion of the program. State UI tax rates and bases can vary substantially. The variation is based on how frequently an individual employer’s workers receive unemployment benefits. If an employer is likely to hire and fire her employees at a higher than normal rate, the employer will face a higher tax rate. For example, Kentucky taxes employers for the first $8,000 of a worker’s wages at rates between 1 and 10 percent. In contrast, Alaska taxes the first $34,000 in wages at rates between 1 and 5.4 percent.
The federal and state tax rates are not additive, however. Employers can credit 90 percent of their state tax against the federal tax, reducing the federal rate to as low as 0.6 percent.[6]
The Economic Incidence of Payroll Taxes
Although payroll taxes in the United States are split between workers and their employers, economists generally agree that both sides of the payroll tax ultimately fall on workers.
In tax policy, there is an important distinction between the “legal” and the “economic” incidence of a tax. The legal incidence of a tax falls on the party that is legally required to write the check to the tax collector.
However, the party that legally pays a tax is not always the one that ultimately bears the burden of the tax. The “economic” incidence of a tax can fall on any number of people and is determined by the relative elasticities of supply and demand of a taxed good, or how people and businesses respond to a tax.
A classic example of the difference between the legal and economic incidence of taxation is the cigarette excise tax. Legally, producers of cigarettes pay this tax. However, it is generally accepted that smokers ultimately bear the burden of this tax. This is because producers, faced with this excise taxAn excise tax is a tax imposed on a specific good or activity. Excise taxes are commonly levied on cigarettes, alcoholic beverages, soda, gasoline, insurance premiums, amusement activities, and betting, and typically make up a relatively small and volatile portion of state and local and, to a lesser extent, federal tax collections., will increase the price they charge for cigarettes. Since most smokers do not significantly respond to higher prices, they will purchase about the same amount of cigarettes at the new price. Thus, producers are able to shift most of the economic burden of the tax onto their customers.
The distinction between the legal and economic incidence of a tax also applies to the payroll tax. Legally, more than half of the payroll tax is paid by employers. However, most economists agree that the employer-side payroll tax ultimately falls on workers in the form of lower wages.[7] This reflects the general consensus that employers are more sensitive to taxation than workers.[8] Empirical work on the incidence of payroll taxes also finds that all or most of the employer-side payroll tax is borne by workers in the form of lower wages.[9]
Single Workers with no Children in the U.S. Faced a Tax Burden of 31.7 percent in 2015
Every year, the OECD surveys all 34 member nations on their labor tax burdens. The OECD calculates these burdens by adding together the income tax payment, employee payroll tax payment, and the employer-side payroll tax payment of a worker making the average wage in each country. [10] The OECD then divides this figure by the total labor cost of this average worker, or what the worker would have earned in the absence of these three taxes. This is called the average tax wedge on labor income.
In 2015, the OECD found that the average worker in the United States faced a tax wedgeBroadly speaking, a tax wedge is the difference between the pre-tax price or return and after-tax price or return. For labor income, it is the difference between the total labor costs to the employer and the corresponding net take-home pay of the employee. of 31.7 percent, which includes income and payroll taxes.[11] The OECD estimated that in 2015 the average U.S. worker paid an effective individual income tax rate of 16.5 percent and an additional 15.1 percent effective payroll tax rate (7 percent on the employee side and 8.1 percent on the employer side).[12] The average worker in this case is a single worker without children who earned an annual income of $50,964. [13]

The 31.7 percent tax wedge for a U.S. worker represents a $9,167 average individual income tax bill and an $8,391 average payroll tax bill for a total average tax bill of about $17,558. The result is an after-tax income of $37,899.
In the absence of these three taxes, the average worker would have taken home $55,457.
Workers Earning an Average Wage Face a Higher Tax Burden in the Other Industrialized Nations Compared to Workers in the United States
Compared to the United States, other countries in the OECD place a relatively high tax burden on average wage earners. The OECD has an average tax wedge on average income earners of 36 percent. This is about 4.3 percentage points higher than the U.S. tax wedge of 31.7 percent, which ranks as the 26th highest in the OECD.

The highest total tax burden on wage income is in Belgium at 55.3 percent, followed by Austria (49.5 percent) and Germany (49.4 percent). The country with the lowest total tax rate on its labor is Chile at 7 percent. New Zealand had the second lowest effective rate at 17.6 percent, followed by Mexico at 19.7 percent.
Payroll Tax Burdens Tend to Be High in the OECD and Make Up a Significant Portion of a Worker’s Tax Bill
As in the United States, payroll taxes in other OECD countries go toward funding social insurance programs. These programs, especially in Europe, tend to cost a significant amount.[14] As a result, most OECD countries’ high average tax burdens on labor are due to high payroll taxes.
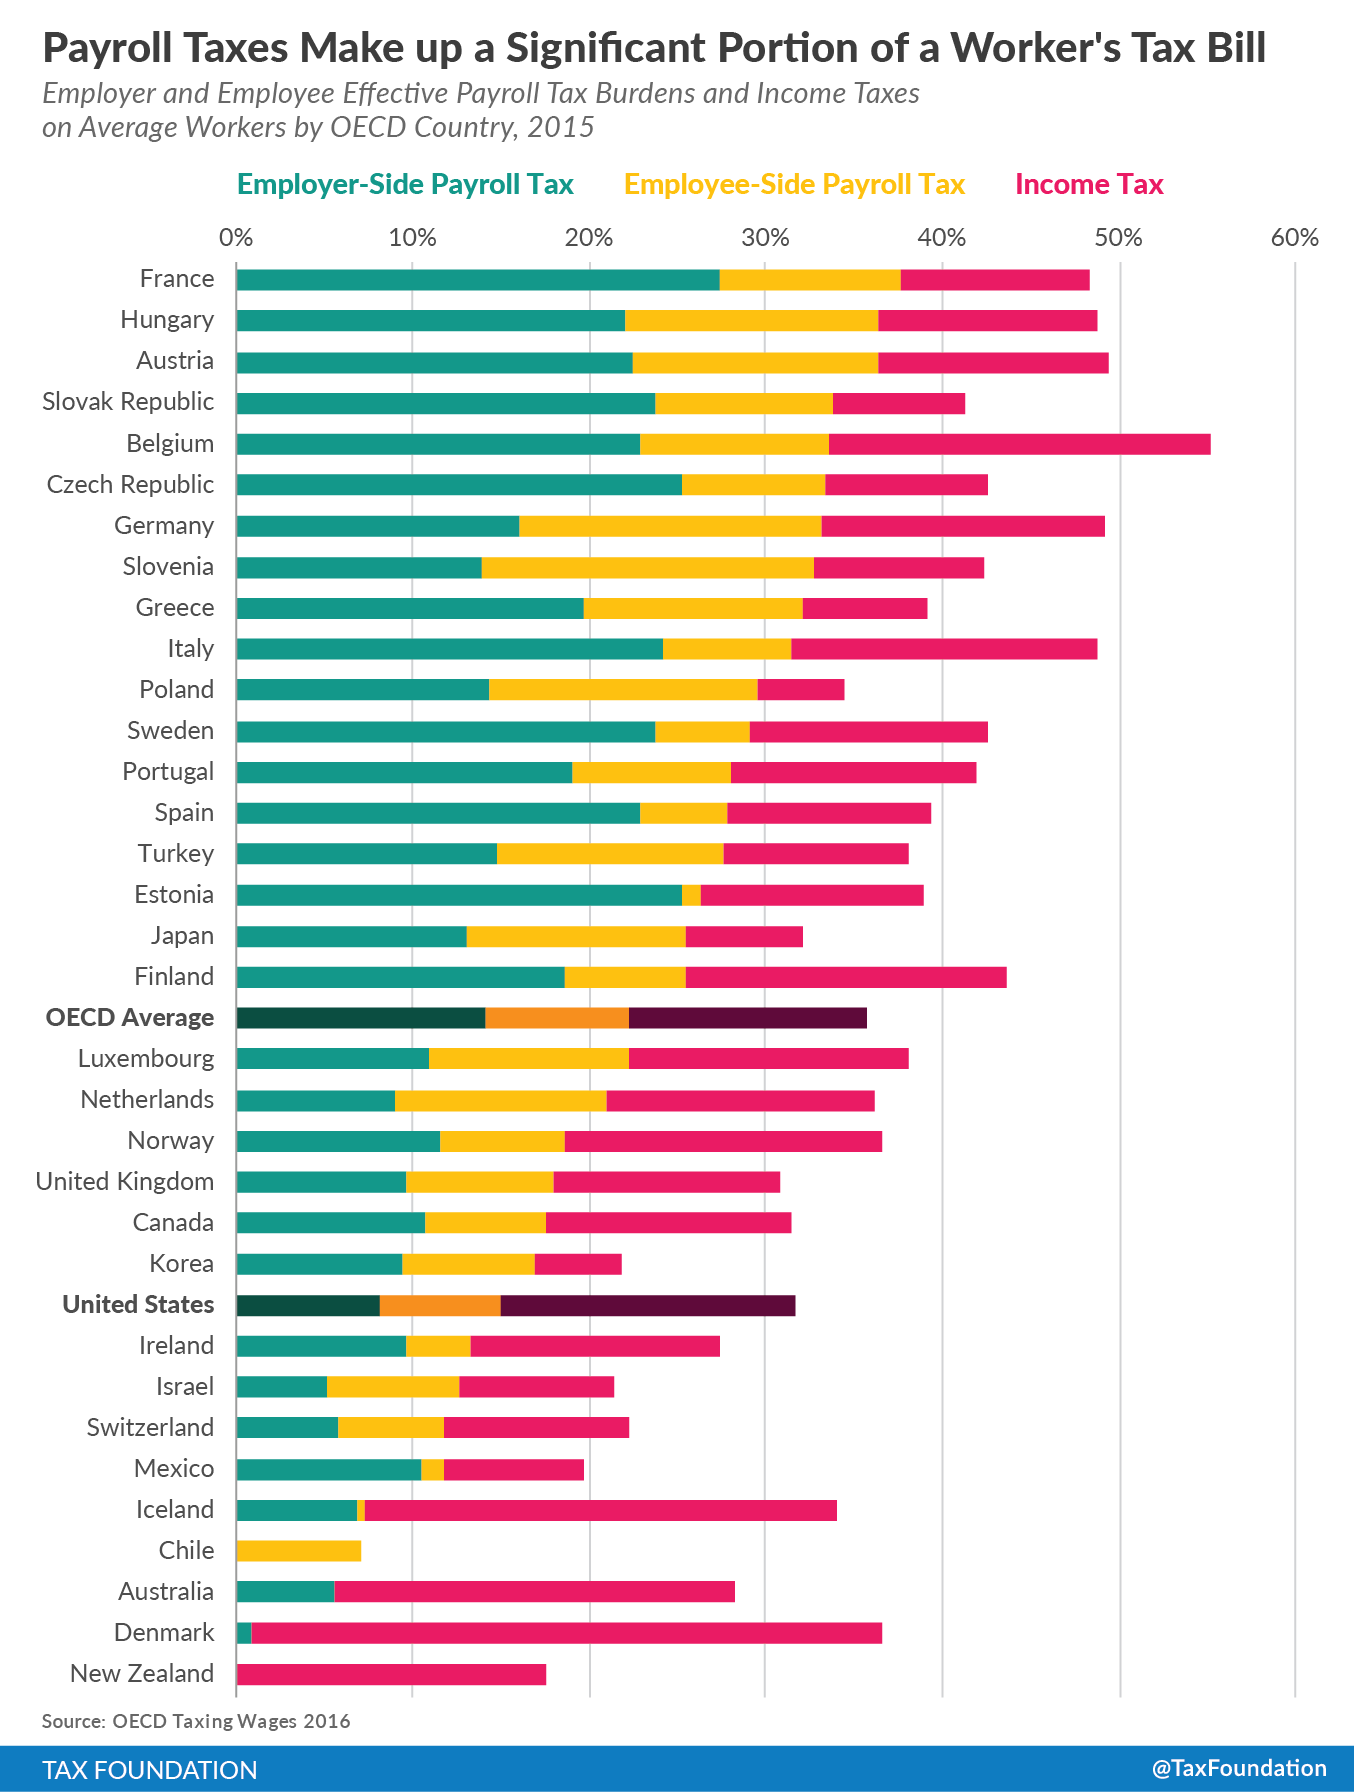
The average combined (employee and employer) payroll tax rate in the OECD was 22.7 percent in 2015, which was 7.6 points higher than the U.S.’s combined rate of 15.1 percent. France had the highest combined payroll tax burden of 37.8 percent. This is followed by Hungary with a payroll tax burden of 36.6 percent, and Austria with a payroll tax burden of 36.4 percent. These three countries’ payroll tax burdens alone are greater than the total tax burden on laborers in the United States.
The countries with the lowest combined payroll tax burdens were Australia (5.6 percent), Denmark (.8 percent), and New Zealand (0 percent). New Zealand is the only country that does not levy a payroll tax on the average worker.
It is also interesting to note that even though Denmark has low payroll taxes, its government still places a relatively high tax burden on average workers through higher individual income taxes (an effective rate of 35.8 percent).
In 28 of 34 OECD countries, payroll taxes made up half or more of an average single worker’s total tax burden in 2015.
Employer-Side Payroll Taxes Tend to Be Higher than Employee-Side Payroll Taxes in OECD Member Countries
All countries with payroll taxes, except for Australia, Chile, and Denmark, split their payroll tax burdens between employees and employers. On average, employer-side taxes tend to be higher across the OECD.
The average OECD employee-side payroll tax burden in 2015 was 8.2 percent. Slovenia had the highest employee-side payroll taxes in the OECD at 19 percent, followed by Germany (17.1 percent) and Poland (15.2 percent). Average workers in the United States faced an effective rate of 7 percent.
The average employer-side payroll tax burden in the OECD is higher at 14.3 percent. France, which has the highest overall payroll tax rate (37.6 percent), also has the highest total effective employer-side payroll tax rate at 27.4 percent. Estonia had the second highest with an effective rate of 25.3 percent, followed by Czech Republic with a 25.2 percent rate.
Employer-side payroll taxes are less transparent than employee-side payroll taxes, as employers remit the check to the government, but employees pay the cost through lower wages.
In Eight OECD Member Countries, Half of the Average Worker’s Tax Burden Is Paid by Employers
For workers in eight OECD countries, half or more of their total tax burdens were paid by their employers. For instance, France had an employer-side payroll tax rate of 27.5 percent, which was the highest in the OECD in 2015. This tax was 56.7 percent of the total tax burden faced by French workers.
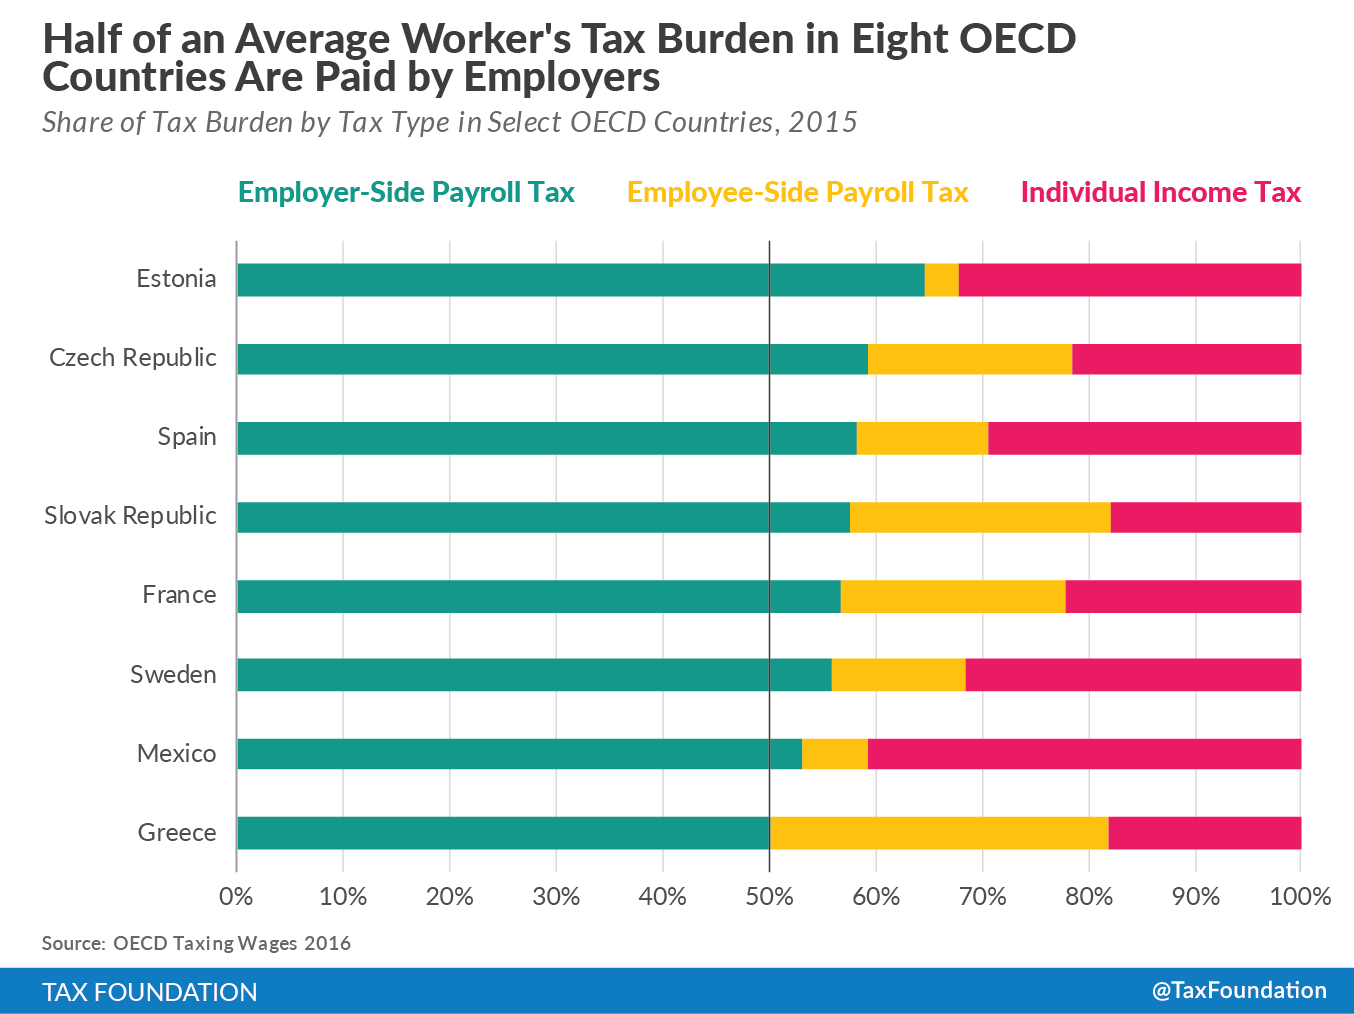
The country whose workers paid the largest proportion of their total tax bill through their employer payroll taxes was Estonia. Their 25.3 percent employer-side payroll tax was 64.7 percent of their total tax burden in 2015.
In contrast, the 8.1 percent payroll tax on the employer side in the United States only makes up a little more than a quarter (25.6 percent) of an average worker’s tax burden.
The Tax Burden of Average Workers in OECD Member Countries Varies Based on Family Composition
It is also important to point out that the tax burden of workers varies based on family composition. Most OECD countries provide some tax relief for families with children.
Comparing single, childless workers and single-earner families with two children earning the same pretax income illustrates how taxes can differ by family composition throughout the OECD. On average, the tax burden for two-child families (an average of 26.8 percent in 2015) in the OECD is 25.3 percent lower than the tax burden on single, childless workers (an average of 35.9 percent).
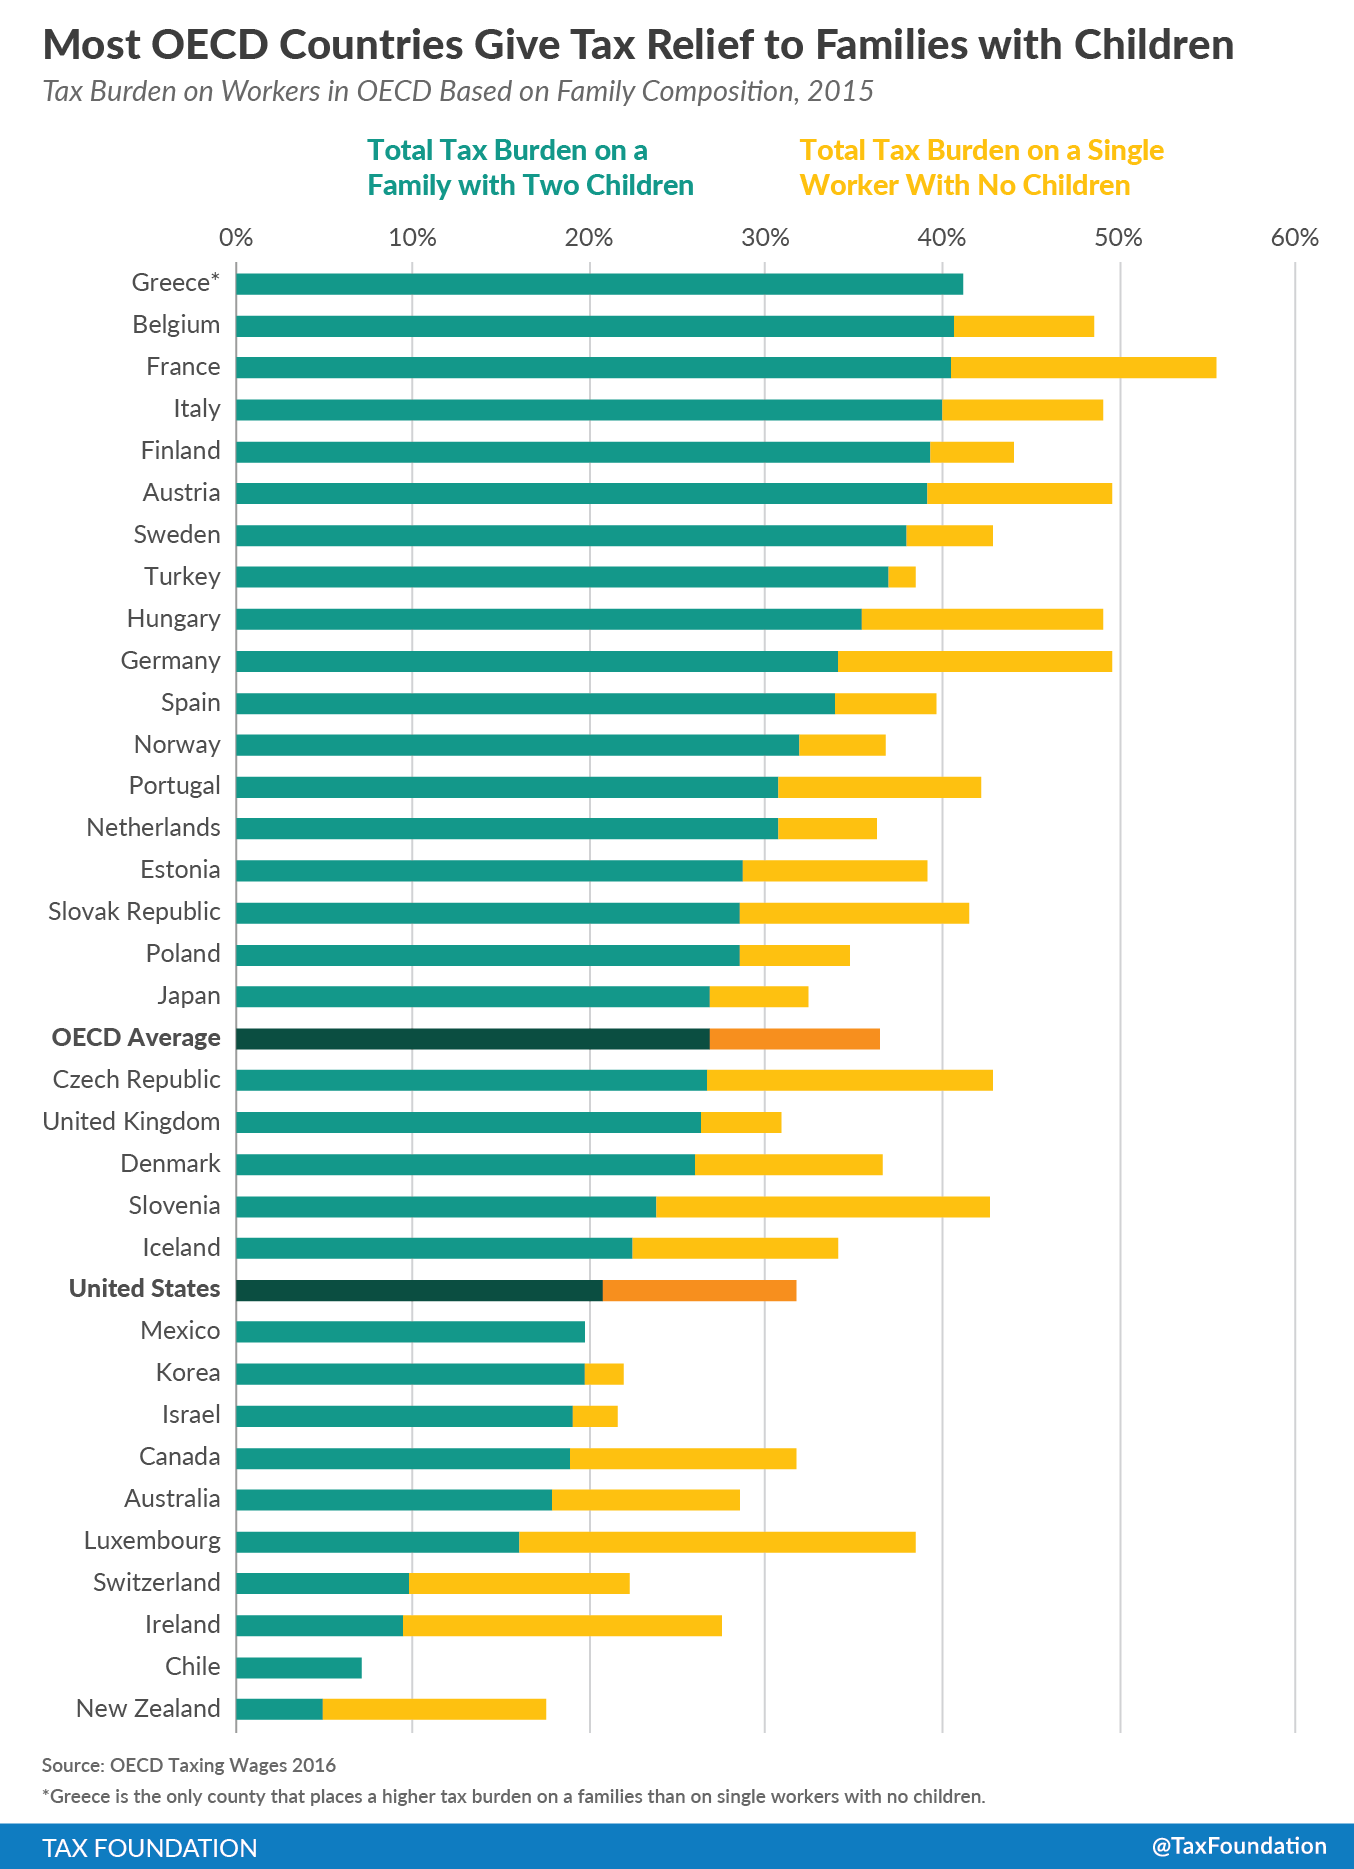
The United States, through the Child Tax Credit, the personal exemption, and other provisions, reduced the tax burden for families with two children (a rate of 20.7 percent) by 34.7 percent compared to the tax burden on a single, childless worker (a rate of 31.7 percent) in 2015. Lower-income workers with children also benefitted more from the Earned Income Tax Credit (EITC) than lower-income workers without children.
New Zealand provided the largest relative reduction of taxes for families with children compared to single, childless workers. The total tax burden of a married couple with two children in New Zealand (4.9 percent) was 72 percent lower than the 17.6 percent total tax burden on a single, childless worker in 2015.
Mexico and Chile were neutral between families with children and without children. Greece was the only country that levied a higher total tax burden on families compared to single, childless workers.
Conclusion
Although the United States and most OECD countries are known for having progressive tax systems that tax high-income earners more than low- or moderate-income earners, a large portion of the tax burden still falls on the average worker. Even here in the United States, which has a lower tax burden than most other OECD countries, average workers end up paying nearly one-third of their incomes in taxes. It is true that governments in the OECD, especially European countries, provide more government programs. However, their workers end up paying a much higher price for them.
| Tax Wedge of Average Single, Childless Income Earner by OECD Country, 2015 | ||||||
| Social Security Contributions | ||||||
| Country | Rank | Total Tax Wedge | Income Tax | Employee | Employer | Average Labor Costs |
| Belgium | 1 | 55.3% | 21.6% | 10.8% | 22.9% | $ 74,137 |
| Austria | 2 | 49.5% | 13.1% | 14.0% | 22.4% | $ 69,060 |
| Germany | 3 | 49.4% | 16.1% | 17.2% | 16.2% | $ 71,579 |
| Hungary | 4 | 49.0% | 12.5% | 14.4% | 22.2% | $ 31,236 |
| Italy | 5 | 49.0% | 17.5% | 7.2% | 24.3% | $ 54,484 |
| France | 6 | 48.5% | 10.7% | 10.3% | 27.5% | $ 63,562 |
| Finland | 7 | 43.9% | 18.4% | 6.7% | 18.7% | $ 58,458 |
| Czech Republic | 8 | 42.8% | 9.2% | 8.2% | 25.4% | $ 32,805 |
| Sweden | 9 | 42.7% | 13.5% | 5.3% | 23.9% | $ 61,345 |
| Slovenia | 10 | 42.6% | 9.7% | 19.0% | 13.9% | $ 35,596 |
| Portugal | 11 | 42.1% | 14.0% | 8.9% | 19.2% | $ 36,744 |
| Slovak Republic | 12 | 41.3% | 7.4% | 10.2% | 23.8% | $ 28,555 |
| Spain | 13 | 39.6% | 11.6% | 4.9% | 23.0% | $ 51,348 |
| Greece | 14 | 39.3% | 7.1% | 12.4% | 19.7% | $ 42,681 |
| Estonia | 15 | 39.0% | 12.6 | 1.2% | 25.3% | $ 32,125 |
| Turkey | 16 | 38.3% | 10.6% | 12.8% | 14.9% | $ 30,463 |
| Luxembourg | 17 | 38.3% | 16.0% | 11.4% | 10.9% | $ 68,267 |
| Denmark | 18 | 36.7% | 35.8% | 0.0% | 0.8% | $ 54,473 |
| Norway | 19 | 36.6% | 17.9% | 7.3% | 11.5% | $68,030 |
| Netherlands | 20 | 36.2% | 15.2% | 12.1% | 8.9% | $ 66,838 |
| Poland | 21 | 34.7% | 5.0% | 15.3% | 14.4% | $ 29,939 |
| Iceland | 22 | 34.0% | 26.7% | 0.3% | 7.0% | $ 55,015 |
| Japan | 23 | 32.2% | 6.7% | 12.4% | 13.1% | $ 54,308 |
| United States | 24 | 31.7% | 16.5% | 7.0% | 8.1% | $ 55,457 |
| Canada | 25 | 31.6% | 14.1% | 6.8% | 10.8% | $ 46,759 |
| United Kingdom | 26 | 30.8% | 12.8% | 8.4% | 9.7% | $ 56,929 |
| Australia | 27 | 28.4% | 22.7% | 0.0% | 5.6% | $ 59,258 |
| Ireland | 28 | 27.5% | 14.2% | 3.6% | 9.7% | $ 45,467 |
| Switzerland | 29 | 22.2% | 10.5% | 5.9% | 5.9% | $ 74,255 |
| Korea | 30 | 21.9% | 4.9% | 7.6% | 9.4% | $ 52,173 |
| Israel | 31 | 21.6% | 8.9% | 7.5% | 5.1% | $ 36,094 |
| Mexico | 32 | 19.7% | 8.0% | 1.2% | 10.5% | $ 14,375 |
| New Zealand | 33 | 17.6% | 17.6% | 0.0% | 0.0% | $ 39,493 |
| Chile | 34 | 7.0% | 0.0% | 7.0% | 0.0% | $ 19,338 |
| OECD Average | N/A | 35.9% | 13.5% | 8.2% | 14.3% | $ 49,137 |
| Source: OECD Taxing Wages (2016). |
[1] Kyle Pomerleau and Kevin Adams, “Sources of Government Revenue in the OECD, 2016,” Tax Foundation Fiscal Fact 517. https://taxfoundation.org/article/sources-government-revenue-oecd-2016
[2] Scott Greenberg, “How Many Taxpayers Fall Into Each Income Tax Bracket?” Tax Policy Blog. https://taxfoundation.org/blog/how-many-taxpayers-fall-each-income-tax-bracket
[3] Tax Foundation, Facts and Figures 2016: How Does Your State Compare? https://taxfoundation.org/article/facts-figures-2016-how-does-your-state-compare.
[4] Ibid
[5] Social Security Administration, 2016 Social Security Changes, http://www.ssa.gov/news/press/factsheets/colafacts2016.pdf.
[6] Joseph Henchman, Unemployment Insurance Taxes: Options for Program Design and Insolvent Trust Funds, Tax Foundation Background Paper No. 61, Oct. 17, 2011, https://taxfoundation.org/article/unemployment-insurance-taxes-options-program-design-and-insolvent-trust-funds.
[7] “The Distribution of Household Income and Federal Taxes, 2013,” Congressional Budget Office. June 2016. https://www.cbo.gov/sites/default/files/114th-congress-2015-2016/reports/51361-HouseholdIncomeFedTaxes.pdf
[8] Elva Bova, Christina Koerus, and Sampawenda J.A. Tapsoba, “A Fiscal Job? An Analysis of Fiscal Policy and the Labor Market.” IMF Working Paper WP/14/216. 2014 https://www.imf.org/external/pubs/ft/wp/2014/wp14216.pdf. Page 7.
[9] Jonathan Gruber, The Incidence of Payroll Taxation: Evidence from Chile, NBER Working Paper No. 5053, Mar. 1995, http://www.nber.org/papers/w5053.
[10] Here, “average wage” refers to total pre-tax wages of full-time workers divided by the number of full-time workers.
[11] OECD, Taxing Wages 2016, 2016, stats.oecd.org .
[12] The total payroll tax burden includes Social Security taxes, Medicare taxes, and Unemployment Insurance taxes. These effective tax rates are expressed as a percentage of total labor costs, rather than nominal wages. Thus, the OECD’s calculation that the U.S. levies employee-side payroll taxes of 7 percent of total labor costs is equivalent to the more familiar 7.65 percent employee-side payroll tax rate on nominal wages. Individual items may not sum to total due to rounding.
[13] This figure represents average income after employer-side payroll taxes. The number is derived by multiplying the OECD measure of the U.S. average labor cost of $55,457 by 91.9 percent (1 minus 8.1 percent).
[14] For instance, Belgium and Austria, the countries with the highest tax burdens on wage earners, spend an equivalent of 30.7 percent and 28.4 percent, respectively, of their GDPs on social welfare. See OECD, OECD StatExtracts, Social Expenditure—Aggregated Data, 2014, http://stats.oecd.org/Index.aspx?DataSetCode=SOCX_AGG.