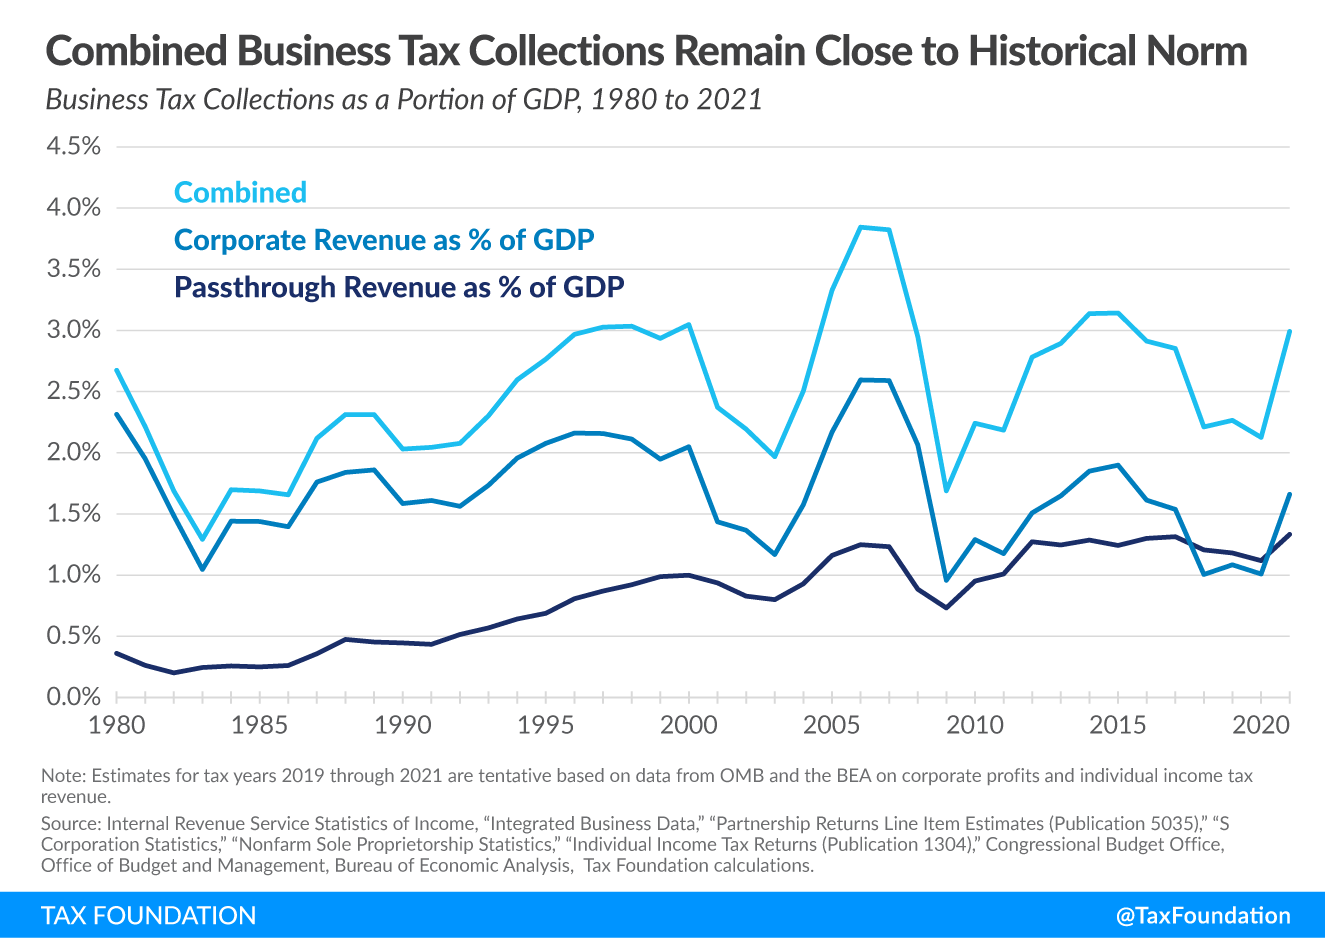
A common argument for increasing corporate taxes is that collections as a share of gross domestic product (GDP) fell after the rate was reduced to 21 percent as part of the Tax Cuts and Jobs Act (TCJA) in 2017. But that argument is incomplete.
We estimate that when accounting for the U.S. pass-through business sector and a recent upturn in corporate taxA tax is a mandatory payment or charge collected by local, state, and national governments from individuals or businesses to cover the costs of general government services, goods, and activities. collections, business tax collections will reach about 3.0 percent of GDP in 2021, which is well within the historical norm for business tax collections and the highest since 2015. As the base broadeners enacted in the TCJA begin to take effect next year and the economic recovery continues, business tax revenue could climb further.
First, corporate tax revenue recovered to a nominal all-time high in 2021 and 1.7 percent of GDP, which is about average for the 20 years prior to TCJA. Second, the U.S. has a large pass-through business sector where taxes are collected through the individual income tax system, and those revenues have also rebounded this year.
Using Internal Revenue Service (IRS) data on income earned by pass-through businesses (i.e., sole proprietorships, partnerships, and S corporations) and the average tax rate on individual income, we can calculate a conservative measure of pass-through businessA pass-through business is a sole proprietorship, partnership, or S corporation that is not subject to the corporate income tax; instead, this business reports its income on the individual income tax returns of the owners and is taxed at individual income tax rates. tax collections and compare it to corporate tax collections over time (see Figure 1).
Pass-through business tax collections have grown substantially over the last 40 years, from about 0.5 percent of GDP or less in the 1980s to 1.3 percent this year and on average over the last 10 years. This reflects the growth in the number of pass-through firms and business income earned by pass-throughs since 1980.
Combining corporate and pass-through business tax collections, total business tax collections as a share of GDP rose from an average of 2.3 percent in the 1980s and 1990s to an average of 2.8 percent from 2000 to 2017. Total business tax collections averaged about 2.5 percent of GDP from 1980 to 2017.
The TCJA reduced business tax revenue from about 2.9 percent of GDP in 2017 to about 2.2 percent in 2018, in part due to the law’s immediate deductions for business investment (which tend to reduce revenue more in the first few years). Tax collections fell further in 2020, as profits dropped during the pandemic. However, as the economy and profits rebounded this year, combined business tax collections rose to nearly 3.0 percent of GDP—nearly reaching the recent highs set in 2014 and 2015 and exceeding the 42-year average of 2.5 percent going back to 1980.
If the economy continues to improve and profits grow, business tax collections may rise further. In addition, the TCJA included several base broadeners and other tax increases that are scheduled to occur over the next few years, including a tighter limitation on net interest expense and amortization of R&D costs that begins next year and the phaseout of bonus depreciationBonus depreciation allows firms to deduct a larger portion of certain “short-lived” investments in new or improved technology, equipment, or buildings in the first year. Allowing businesses to write off more investments partially alleviates a bias in the tax code and incentivizes companies to invest more, which, in the long run, raises worker productivity, boosts wages, and creates more jobs. beginning in 2023. On the other hand, some of this year’s increase in tax revenue may be temporary as businesses time income and expenses ahead of expected tax increases.
Our estimates may understate actual pass-through business tax collections since 1980, and by extension, understate total business tax collections. We calculated the share of individual income taxes paid by pass-through firms by using pass-through net income data from the IRS and applying the average effective income tax rate on individual income in each year to pass-through income. However, the average tax rateThe average tax rate is the total tax paid divided by taxable income. While marginal tax rates show the amount of tax paid on the next dollar earned, average tax rates show the overall share of income paid in taxes. faced by pass-through firms tends to be higher than the overall average individual income taxAn individual income tax (or personal income tax) is levied on the wages, salaries, investments, or other forms of income an individual or household earns. The U.S. imposes a progressive income tax where rates increase with income. The Federal Income Tax was established in 1913 with the ratification of the 16th Amendment. Though barely 100 years old, individual income taxes are the largest source of tax revenue in the U.S. rate. For example, the average individual income tax rate in 2011 was about 12.5 percent, but according to a more detailed analysis, the effective pass-through firm tax rate was 19 percent that year.
When looking at the tax burden on businesses over time, it is important to provide a complete picture by accounting for the different types of businesses in the U.S. and the timing effects of the 2017 tax law. Doing so provides important context on existing tax burdens and for considering the impact of raising taxes on corporations and pass-through firms.
Share this article