Download State-Local Tax Burden Rankings FY 2012 (PDF) State and Local Tax Burdens Historic Data, 1977 – 2012 State-Local Tax Burden Rankings: Methodology
Key Findings
- During the 2012 fiscal year, state-local taxA tax is a mandatory payment or charge collected by local, state, and national governments from individuals or businesses to cover the costs of general government services, goods, and activities. burdens as a share of state incomes decreased on average across the U.S. Average income increased at a faster rate than tax collections, driving down state-local tax burdens on average.
- New Yorkers faced the highest burden, with 12.7 percent of income in the state going to state and local taxes. Connecticut (12.6 percent) and New Jersey (12.2 percent) followed closely behind. On the other end of the spectrum, Alaska (6.5 percent), South Dakota (7.1 percent) and Wyoming (7.1 percent) had the lowest burdens.
- On average, taxpayers pay the most in taxes to their own state and local governments. In 2012, 78 percent of taxes collected were paid within the state of residence, up from 73 percent in 2011.
- State-local tax burdens are very close to one another and slight changes in taxes or income can translate to seemingly dramatic shifts in rank. For example, Delaware (16th) and Colorado (35th) only differ in burden by just over one percentage point. However, while burdens are clustered in the center of the distribution, states at the top and bottom can have substantially different burden percentages—e.g. New York (12.6 percent) and Alaska (6.5 percent).
| State | State-Local Tax Burden as a Percent of State Income | Rank |
|---|---|---|
| U.S. Average | 9.9% | |
| Alabama | 8.7% | 39 |
| Alaska | 6.5% | 50 |
| Arizona | 8.8% | 36 |
| Arkansas | 10.1% | 17 |
| California | 11.0% | 6 |
| Colorado | 8.9% | 35 |
| Connecticut | 12.6% | 2 |
| Delaware | 10.2% | 16 |
| Florida | 8.9% | 34 |
| Georgia | 9.1% | 32 |
| Hawaii | 10.2% | 14 |
| Idaho | 9.3% | 26 |
| Illinois | 11.0% | 5 |
| Indiana | 9.5% | 22 |
| Iowa | 9.2% | 31 |
| Kansas | 9.5% | 23 |
| Kentucky | 9.5% | 24 |
| Louisiana | 7.6% | 45 |
| Maine | 10.2% | 13 |
| Maryland | 10.9% | 7 |
| Massachusetts | 10.3% | 12 |
| Michigan | 9.4% | 25 |
| Minnesota | 10.8% | 8 |
| Mississippi | 8.6% | 41 |
| Missouri | 9.3% | 29 |
| Montana | 8.7% | 38 |
| Nebraska | 9.2% | 30 |
| Nevada | 8.1% | 43 |
| New Hampshire | 7.9% | 44 |
| New Jersey | 12.2% | 3 |
| New Mexico | 8.7% | 37 |
| New York | 12.7% | 1 |
| North Carolina | 9.8% | 20 |
| North Dakota | 9.0% | 33 |
| Ohio | 9.8% | 19 |
| Oklahoma | 8.6% | 40 |
| Oregon | 10.3% | 10 |
| Pennsylvania | 10.2% | 15 |
| Rhode Island | 10.8% | 9 |
| South Carolina | 8.4% | 42 |
| South Dakota | 7.1% | 49 |
| Tennessee | 7.3% | 47 |
| Texas | 7.6% | 46 |
| Utah | 9.6% | 21 |
| Vermont | 10.3% | 11 |
| Virginia | 9.3% | 27 |
| Washington | 9.3% | 28 |
| West Virginia | 9.8% | 18 |
| Wisconsin | 11.0% | 4 |
| Wyoming | 7.1% | 48 |
| DC | 10.6% | (10) |
| Note: As a unique state-local entity, DC’s rank does not affect other states’ rankings, but the figure in parentheses indicates where it would rank if included. The U.S. average is a population-weighted average (weighted by state population). DC is excluded from population-weighted averages. | ||

What Are Tax Burdens?
A state’s tax burden is the portion of total state income that goes to state and local taxes. But it’s important to remember that as taxpayers, we not only pay state and local taxes to our own places of residence, but also to the governments of states and localities in which we do not live.
How is this possible? This tax shifting across state borders arises from several factors, including our movement across state lines during work and leisure time and the interconnectedness of the national economy. What’s really driving this phenomenon, however, is the reality that the ultimate incidence of a tax frequently falls on entities other than those that write the check to the government.
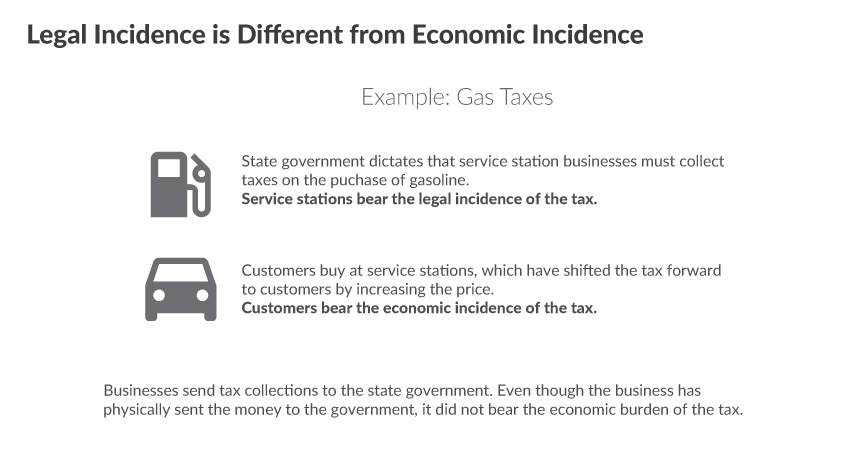
What is Tax Incidence?
Put simply, the incidence of a tax is a measure of which entity pays the tax. But there are two very different types of tax incidenceTax incidence is a measure of who bears the legal or economic burden of a tax. Legal incidence identifies who is responsible for paying a tax while economic incidence identifies who bears the cost of tax—in the form of higher prices for consumers, lower wages for workers, or lower returns for shareholders. : legal incidence and economic incidence.
The legal incidence of taxes is borne by those with the legal obligation to remit tax payments to state and local governments. Legal incidence is established by law, and tells us which individuals or companies must physically send tax payments to state and local treasuries.
The legal incidence of taxes is generally very different from the final economic burden. Because taxes influence the relative prices facing individuals, they lead to changes in individual behavior. These tax-induced changes in behavior cause some portion (or all) of the economic burden of taxes to be shifted from those bearing the legal incidence onto others in society. For example, the legal incidence of corporate income taxes typically falls on companies. But economists agree that some portion of these taxes is shifted forward to others, in the form of higher prices for consumers, lower wages for workers, reduced returns to shareholders, or some combination of the three.
Once these tax-induced changes in behavior throughout the economy are accounted for, the final distribution of the economic burden of taxes is called the economic incidence. This measure is also referred to as the tax burden faced by individuals.
This concept is best illustrated by an example (shown below). When service stations remit motor fuel taxes imposed on the sale of gasoline to state and local governments, it isn’t the businesses that experience reduced income as a result of the tax. In reality, the tax is passed forward to customers in the form of higher prices.[1] Therefore, the entity remitting the tax to the government (the business) is not the entity that bears the ultimate burden of the tax. The ultimate economic incidence of the tax is shifted from one group to another (businesses to customers).
What is Tax Exporting?
This tax shifting occurs to some degree for nearly all types of taxes, and our tax burden estimates account for these shifts. Our study is particularly interested in how this tax shifting occurs as it relates to state borders, or the shifting of tax burdens from state residents to nonresidents, a phenomenon known as tax exporting.
Chart 1.
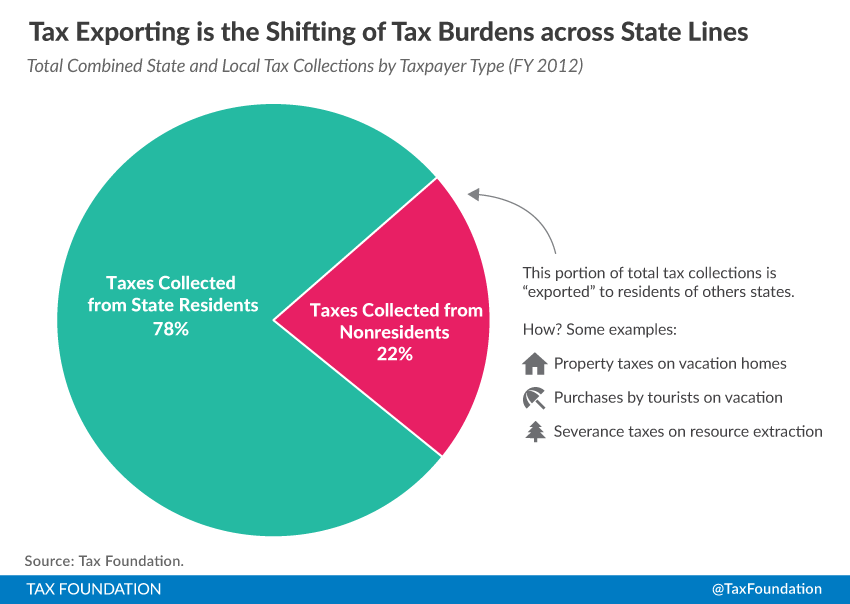
Alaska provides the best example of tax exporting. Alaska is able to collect approximately 80 percent of its total state and local tax collections from residents of other states. The main driver of this is the state’s severance tax on oil extraction. In 2012, 67 percent of Alaska’s total state and local tax collections came from severance taxes.[2] Keep in mind that Alaskans pay no state-level tax on income and face no state-level sales taxA sales tax is levied on retail sales of goods and services and, ideally, should apply to all final consumption with few exemptions. Many governments exempt goods like groceries; base broadening, such as including groceries, could keep rates lower. A sales tax should exempt business-to-business transactions which, when taxed, cause tax pyramiding. (though Alaska does have local option sales taxes).[3]
The burden of Alaskan oil taxes does not fall predominantly on Alaska residents. Ignoring this fact and comparing Alaskan tax collections directly to Alaskan income makes the tax burden of Alaska residents look much higher than it actually is. This study assumes that much of the economic burden of severance taxes falls on consumers of oil and oil-based products across the country in the form of higher prices (rather than directly out of Alaskans’ pockets). To provide an accurate picture of how low Alaska residents’ tax burden is, we allocate Alaska’s severance tax burden to other U.S. states based on oil and gas consumption. Once this allocation is made, Alaska’s aggregate tax burden falls from among the nation’s highest to the lowest.
Resource-rich states, such as Alaska and Wyoming, are only some of the more extreme examples of tax exporting. Major tourist destinations like Nevada and Florida are able to tax tourists, who are most often nonresidents. Some states have large numbers of residents employed out of state who pay individual income taxes to the states in which they work. When a metropolitan area attracts workers from nearby states, a large portion of wage income in a state can be earned by border-crossing commuters. On the other hand, some states have reciprocity agreements in which they tax their own residents, regardless of where they work. This study accounts for these types of agreements.
Every state’s economic activity is different, as is every state’s tax code. As a result, each varies in its ability to export its tax burden. Economists have been studying this phenomenon since at least the 1960s when Charles McLure estimated that states were extracting between 15 and 35 percent of their tax revenue from nonresidents.[4]
Much of this interstate tax collecting occurs through no special effort by state and local legislators or tax collectors. Tourists spend as they travel and many of those transactions are taxed. People who own property out of state pay property taxes in those states. And the burden of business taxes is borne by the employees, shareholders, and customers of those businesses wherever they may live. In many states, however, lawmakers have made a conscious effort to levy taxes specifically on nonresidents. Common examples include tax increases on hotel rooms, rental cars, and restaurant meals, and local sales taxes in resort areas.
What Is the Difference between Tax Burdens and Tax Collections?
The distinction between tax burdens and tax collections is crucial to understanding tax shifting across state lines. Because tax collections represent a tally of tax payments made to state and local governments, they measure legal incidence only. In contrast, our tax burdens estimates use a geographical incidence model to allocate taxes to states that are economically affected by them. As a result, the estimates in this report attempt to measure the economic incidence of taxes, not the legal incidence.
Tax collections are useful for some purposes and cited frequently. However, dividing total taxes collected by governments in a state by the state’s total income is not an accurate measure of the tax burden on a state’s residents as a whole because it does not accurately reflect the taxes that are actually paid out of that state’s income.
The authoritative source for state and local tax collections data is the Census Bureau’s State and Local Government Finance division,[5] which serves as the main input and starting point for our tax burdens model. Here are a few additional examples of the difference between tax collections (tallied by the Census Bureau) and our tax burdens estimates:
- When Connecticut residents work in New York City and pay income tax to both New York State and the city, the Census Bureau will count those amounts as New York tax collections, but we count them as part of the tax burden of Connecticut’s residents.
- When Illinois and Massachusetts residents own second homes in nearby Wisconsin or Maine, respectively, local governments in Wisconsin and Maine will tally those property taxA property tax is primarily levied on immovable property like land and buildings, as well as on tangible personal property that is movable, like vehicles and equipment. Property taxes are the single largest source of state and local revenue in the U.S. and help fund schools, roads, police, and other services. collections, but we shift those payments back to the states of the taxpayers.
- When people all over the country vacation at Disney World or in Las Vegas, tax collectors will tally the receipts from lodging, rental car, restaurant, and general sales taxes in Florida and Nevada, but we will count those payments in the states where the vacationers live.
In addition to allocating the taxes cited above, this study also allocates taxes on corporate income, commercial and residential property, tourism, and nonresident personal income away from the state of collection to the state of the taxpayers’ residences. For a full list of incidence assumptions and methods used to allocate tax collections to other states, see our methodology paper.[6]
Which Taxes Are Included in the Tax Burdens Estimates?
We include all taxes reported by the Census Bureau’s State and Local Government Finance division,[7] the most comprehensive resource on state and local tax collections data and our tax burden model’s starting point. These taxes are:
- Property taxes;
- General sales taxes;
- Excise taxes on alcoholic beverages, amusements, insurance premiums, motor fuels, pari-mutuels, public utilities, tobacco products, and other miscellaneous transactions;
- License taxes on alcoholic beverages, amusements, general corporations, hunting and fishing, motor vehicles, motor vehicle operators, public utilities, occupations and businesses not classified elsewhere, and other miscellaneous licenses;
- Individual income taxes;
- Corporate income taxes;
- Estate, inheritance, and gift taxes;
- Documentary and stock transfer taxes;
- Severance taxes;
- Special assessments for property improvements; and
- Miscellaneous taxes not classified in one of the above categories.
Our time unit of measure is the standard state fiscal year (July 1 through June 30). Data from the few states that use a different fiscal calendar have been adjusted to the standard state fiscal year. The state and local tax burden estimates for fiscal year 2012 presented in this paper are based on the most recent data available from the Census Bureau, the Bureau of Economic Analysis, and all other data sources employed. For a full list of data sources, please see our methodology paper.[8]
How Do We Arrive at These Tax Burden Estimates?
First, data on total state collections (as reported by the Census Bureau) are gathered, which gives us 26 tax categories with which to begin (listed above). Incidence assumptions are then made for these 26 categories. In many cases, the tax category is broad enough that it must be subdivided into further groups. For example, sales taxes collected by a state include taxes paid by state residents, taxes paid by businesses, taxes paid by business travelers, and taxes paid by tourists, with tax incidence differing across each group. Sales tax paid by state residents is borne by residents of the collecting state. Sales taxes paid by businesses and business travelers are likely borne by consumers nationwide, while taxes paid by tourists are borne by those individuals that traveled from another state.
Tax category subdivisions (as needed) and incidence assumptions are made for each of the 26 tax categories based on economic theory and empirical literature. Once an incidence assumption is made, an allocation method must be used to apportion state tax collections between the state of residence and other states throughout the country based on our incidence assumptions.[9] Finally, income within each state is then tallied so that total taxes paid by state residents can be expressed as a share of total state income.[10]
Since updated historical data is periodically released by our data sources, each year we collect any updated historical data and recalculate the tax burdens of all 50 states all the way back to 1977. This ensures that we are always using the most accurate available data as inputs into our model.
Limitations
Tax burden measures are not measures of the size of government in a state, nor are they technically measures of the complete burden of taxation faced by a given state’s residents (this study excludes compliance costs and economic efficiency losses). Furthermore, the tax burden estimates presented here do not take into account the return to that taxation in the form of government spending. These drawbacks, however, are not unique to our tax burden estimates.
It is also worth noting that these tax burden estimates are not those of individual taxpayers. Our tax burden estimates look at the aggregate amount of state and local taxes paid, not the taxes paid by an individual. We collect data on the total income earned in a state (by all residents collectively) and estimate the share of that total that goes toward state and local taxes.
Fiscal Year 2012 Results
State-local tax burdens of each of the 50 states’ residents as a share of income are clustered quite close to one another. This is logical considering state and local governments fund similar activities such as public education, transportation, prison systems, and health programs, often under the same federal mandates. Furthermore, tax competition between states can often make dramatic differences in the level of taxation between similar, nearby states unsustainable in the long run.
| State | State-Local Tax Burden as a Percent of State Income | Rank | State-Local Tax Burden per Capita | Taxes Paid to Own State per Capita | Taxes Paid to Other States per Capita | Income per Capita |
|---|---|---|---|---|---|---|
| U.S. Average | 9.9% | $4,420 | $3,238 | $1,213 | $44,481 | |
| Alabama | 8.7% | 39 | $3,067 | $2,142 | $925 | $35,337 |
| Alaska | 6.5% | 50 | $3,229 | $1,986 | $1,242 | $49,780 |
| Arizona | 8.8% | 36 | $3,276 | $2,283 | $992 | $37,012 |
| Arkansas | 10.1% | 17 | $3,519 | $2,552 | $967 | $34,862 |
| California | 11.0% | 6 | $5,237 | $4,126 | $1,111 | $47,808 |
| Colorado | 8.9% | 35 | $4,304 | $2,968 | $1,336 | $48,313 |
| Connecticut | 12.6% | 2 | $7,869 | $5,516 | $2,354 | $62,374 |
| Delaware | 10.2% | 16 | $4,412 | $2,610 | $1,802 | $43,437 |
| Florida | 8.9% | 34 | $3,738 | $2,499 | $1,240 | $41,848 |
| Georgia | 9.1% | 32 | $3,426 | $2,446 | $980 | $37,478 |
| Hawaii | 10.2% | 14 | $4,576 | $3,480 | $1,096 | $44,920 |
| Idaho | 9.3% | 26 | $3,318 | $2,255 | $1,063 | $35,496 |
| Illinois | 11.0% | 5 | $5,235 | $4,015 | $1,220 | $47,656 |
| Indiana | 9.5% | 22 | $3,585 | $2,592 | $993 | $37,580 |
| Iowa | 9.2% | 31 | $4,037 | $2,877 | $1,161 | $43,878 |
| Kansas | 9.5% | 23 | $4,131 | $2,808 | $1,323 | $43,490 |
| Kentucky | 9.5% | 24 | $3,298 | $2,410 | $888 | $34,782 |
| Louisiana | 7.6% | 45 | $2,950 | $1,953 | $997 | $38,906 |
| Maine | 10.2% | 13 | $3,997 | $2,895 | $1,102 | $39,062 |
| Maryland | 10.9% | 7 | $5,920 | $4,387 | $1,533 | $54,266 |
| Massachusetts | 10.3% | 12 | $5,872 | $4,220 | $1,651 | $57,180 |
| Michigan | 9.4% | 25 | $3,631 | $2,704 | $926 | $38,636 |
| Minnesota | 10.8% | 8 | $5,185 | $3,980 | $1,205 | $47,806 |
| Mississippi | 8.6% | 41 | $2,742 | $1,910 | $832 | $31,847 |
| Missouri | 9.3% | 29 | $3,591 | $2,483 | $1,108 | $38,825 |
| Montana | 8.7% | 38 | $3,389 | $2,172 | $1,216 | $38,980 |
| Nebraska | 9.2% | 30 | $4,197 | $2,930 | $1,267 | $45,485 |
| Nevada | 8.1% | 43 | $3,349 | $2,051 | $1,298 | $41,297 |
| New Hampshire | 7.9% | 44 | $3,961 | $2,173 | $1,789 | $50,288 |
| New Jersey | 12.2% | 3 | $6,926 | $4,876 | $2,050 | $56,731 |
| New Mexico | 8.7% | 37 | $3,141 | $2,170 | $971 | $36,051 |
| New York | 12.7% | 1 | $6,993 | $5,588 | $1,406 | $55,047 |
| North Carolina | 9.8% | 20 | $3,659 | $2,707 | $952 | $37,523 |
| North Dakota | 9.0% | 33 | $4,867 | $3,349 | $1,518 | $53,953 |
| Ohio | 9.8% | 19 | $3,924 | $2,986 | $938 | $40,111 |
| Oklahoma | 8.6% | 40 | $3,515 | $2,420 | $1,095 | $40,762 |
| Oregon | 10.3% | 10 | $4,095 | $3,063 | $1,032 | $39,578 |
| Pennsylvania | 10.2% | 15 | $4,589 | $3,385 | $1,204 | $45,046 |
| Rhode Island | 10.8% | 9 | $4,998 | $3,476 | $1,522 | $46,359 |
| South Carolina | 8.4% | 42 | $2,936 | $1,999 | $937 | $34,821 |
| South Dakota | 7.1% | 49 | $3,318 | $1,911 | $1,407 | $46,781 |
| Tennessee | 7.3% | 47 | $2,805 | $1,861 | $944 | $38,178 |
| Texas | 7.6% | 46 | $3,340 | $2,332 | $1,008 | $44,081 |
| Utah | 9.6% | 21 | $3,556 | $2,505 | $1,051 | $36,989 |
| Vermont | 10.3% | 11 | $4,557 | $3,129 | $1,428 | $44,337 |
| Virginia | 9.3% | 27 | $4,623 | $3,258 | $1,365 | $49,541 |
| Washington | 9.3% | 28 | $4,541 | $3,241 | $1,301 | $48,999 |
| West Virginia | 9.8% | 18 | $3,331 | $2,455 | $876 | $34,016 |
| Wisconsin | 11.0% | 4 | $4,734 | $3,602 | $1,132 | $42,990 |
| Wyoming | 7.1% | 48 | $4,407 | $2,056 | $2,351 | $61,708 |
| DC | 10.6% | (10) | $7,541 | $5,231 | $2,310 | $70,837 |
| Note: As a unique state-local entity, DC’s rank does not affect other states’ rankings, but the figure in parentheses indicates where it would rank if included. The U.S. average is a population-weighted average (weighted by state population). DC is excluded from population-weighted averages. | ||||||
Therefore, it’s not surprising that tax burdens as a share of income are quite close to one another. Since we present tax burdens as a share of income as a relative ranking of the 50 states, slight changes in taxes or income can translate into seemingly dramatic shifts in rank. For example, the 20 mid-ranked states, ranging from Delaware (16th) to Colorado (35th), only differ in burden by just over one percentage point. However, while burdens are clustered in the center of the distribution, states at the top and bottom can have substantially different burden percentages: the state with the highest burden, New York, has a burden percentage of 12.7 percent, while the state with the lowest burden, Alaska, has a burden percentage of 6.5 percent.
Nationwide, 22 percent of all state and local taxes are collected from nonresidents. As a result, the residents of all states pay surprisingly high shares of their total tax burdens to out-of-state governments. Table 2 lists the per capita dollar amounts of total tax burden and income that are divided to compute each state’s burden, as well as the breakdown of in-state and out-of-state payments for the 2012 fiscal year.
The residents of three states stand above the rest, experiencing the highest state-local tax burdens in the country: New York (12.7 percent of state income), Connecticut (12.6 percent), and New Jersey (12.2 percent). These are the only three states where taxpayers forego over 12 percent of their total collective income to state and local taxes. This is over one percentage point higher than the fourth highest burden, in Wisconsin, of 11.0 percent of state income.
New York, Connecticut, and New Jersey have occupied the top three spots on the list, albeit not always in the same order, for several years. This may be partially attributed to high expenditure levels, which must be sustained by high levels of revenue. Furthermore, in the case of Connecticut and New Jersey, relatively high tax payments to out-of-state governments add to already high in-state payments. This is likely related to the fact that these are high-income states whose residents experience high levels of capital gains. High levels of capital gains will result in residents paying an increased share of other states’ business taxes.[11]
The states with the highest state-local tax burdens in fiscal year 2012 were:
- New York (12.7 percent)
- Connecticut (12.6 percent)
- New Jersey (12.2 percent)
- Wisconsin (11.0 percent)
- Illinois (11.0 percent)
- California (11.0 percent)
- Maryland (10.9 percent)
- Minnesota (10.8 percent)
- Rhode Island (10.8 percent)
- Oregon (10.3 percent)
The states with the lowest state-local tax burdens in fiscal year 2012 were:
- Alaska (6.5 percent)
- South Dakota (7.1 percent)
- Wyoming (7.1 percent)
- Tennessee (7.3 percent)
- Texas (7.6 percent)
- Louisiana (7.6 percent)
- New Hampshire (7.9 percent)
- Nevada (8.1 percent)
- South Carolina (8.4 percent)
- Mississippi (8.6 percent)
Generally, there are three reasons why a state’s ranking could change from year to year. First, there could have been a change in total collections by the state, either due to policy changes or economic fluctuations. Second, there may have been a change in the level of state income due to changing economic conditions. And third, other states to which residents pay state and local taxes could have seen changes in tax collections (again due to changing policy or economic conditions).
In 2012, state incomes on average rose in real terms. The average total tax burden also rose, but by a lower amount than the increase in income. This translated to lower tax burdens as a share of state incomes compared to 2011. Average burden decreased from 10.1 percent of income in 2011 to 9.9 percent in 2012.
The most pronounced changes in burden as a share of income between 2011 and 2012 occurred in California (decrease of 0.5 percentage points), Illinois (increase of 0.5 percentage points), and Connecticut (increase of 0.4 percentage points). Most states saw a decrease in burden percentage (35 states), while eight saw an increase. Seven states’ burden percentages remained the same.
Table 3 lists each state’s burden as a share of income, including rankings, for the three most recent fiscal years available.
| Fiscal Year 2012 | Fiscal Year 2011 | Fiscal Year 2010 | ||||
|---|---|---|---|---|---|---|
| State | State-Local Tax Burden as a Percent of State Income | Rank | State-Local Tax Burden as a Percent of State Income | Rank | State-Local Tax Burden as a Percent of State Income | Rank |
| U.S. Average | 9.9% | 10.1% | 10.4% | |||
| Alabama | 8.7% | 39 | 8.9% | 39 | 9.0% | 39 |
| Alaska | 6.5% | 50 | 6.8% | 50 | 7.1% | 50 |
| Arizona | 8.8% | 36 | 8.9% | 36 | 9.0% | 40 |
| Arkansas | 10.1% | 17 | 10.4% | 11 | 10.6% | 13 |
| California | 11.0% | 6 | 11.5% | 4 | 11.7% | 4 |
| Colorado | 8.9% | 35 | 9.0% | 35 | 9.3% | 35 |
| Connecticut | 12.6% | 2 | 12.2% | 2 | 12.6% | 3 |
| Delaware | 10.2% | 16 | 9.7% | 20 | 9.5% | 31 |
| Florida | 8.9% | 34 | 9.2% | 31 | 9.8% | 25 |
| Georgia | 9.1% | 32 | 9.2% | 33 | 9.3% | 33 |
| Hawaii | 10.2% | 14 | 9.8% | 19 | 10.6% | 14 |
| Idaho | 9.3% | 26 | 9.6% | 23 | 9.8% | 27 |
| Illinois | 11.0% | 5 | 10.5% | 10 | 10.7% | 10 |
| Indiana | 9.5% | 22 | 9.5% | 27 | 9.8% | 28 |
| Iowa | 9.2% | 31 | 9.3% | 30 | 9.8% | 26 |
| Kansas | 9.5% | 23 | 9.5% | 28 | 9.9% | 22 |
| Kentucky | 9.5% | 24 | 9.6% | 24 | 9.5% | 30 |
| Louisiana | 7.6% | 45 | 7.8% | 45 | 8.1% | 47 |
| Maine | 10.2% | 13 | 10.3% | 14 | 10.7% | 11 |
| Maryland | 10.9% | 7 | 10.9% | 7 | 10.7% | 9 |
| Massachusetts | 10.3% | 12 | 10.4% | 13 | 10.7% | 8 |
| Michigan | 9.4% | 25 | 9.6% | 25 | 10.0% | 20 |
| Minnesota | 10.8% | 8 | 10.9% | 6 | 11.1% | 7 |
| Mississippi | 8.6% | 41 | 8.7% | 41 | 9.1% | 38 |
| Missouri | 9.3% | 29 | 9.2% | 34 | 9.3% | 34 |
| Montana | 8.7% | 38 | 8.9% | 37 | 9.3% | 36 |
| Nebraska | 9.2% | 30 | 9.6% | 22 | 10.0% | 19 |
| Nevada | 8.1% | 43 | 8.2% | 43 | 8.7% | 42 |
| New Hampshire | 7.9% | 44 | 8.0% | 44 | 8.6% | 44 |
| New Jersey | 12.2% | 3 | 12.1% | 3 | 12.7% | 2 |
| New Mexico | 8.7% | 37 | 8.9% | 38 | 9.0% | 41 |
| New York | 12.7% | 1 | 12.7% | 1 | 13.0% | 1 |
| North Carolina | 9.8% | 20 | 10.1% | 16 | 10.3% | 18 |
| North Dakota | 9.0% | 33 | 9.2% | 32 | 9.3% | 32 |
| Ohio | 9.8% | 19 | 9.9% | 18 | 10.0% | 21 |
| Oklahoma | 8.6% | 40 | 8.7% | 40 | 9.1% | 37 |
| Oregon | 10.3% | 10 | 10.4% | 12 | 10.7% | 12 |
| Pennsylvania | 10.2% | 15 | 10.3% | 15 | 10.4% | 16 |
| Rhode Island | 10.8% | 9 | 10.7% | 8 | 11.2% | 6 |
| South Carolina | 8.4% | 42 | 8.4% | 42 | 8.7% | 43 |
| South Dakota | 7.1% | 49 | 7.2% | 49 | 7.7% | 49 |
| Tennessee | 7.3% | 47 | 7.5% | 47 | 7.8% | 48 |
| Texas | 7.6% | 46 | 7.6% | 46 | 8.2% | 45 |
| Utah | 9.6% | 21 | 9.7% | 21 | 9.8% | 23 |
| Vermont | 10.3% | 11 | 10.5% | 9 | 10.6% | 15 |
| Virginia | 9.3% | 27 | 9.5% | 29 | 9.8% | 24 |
| Washington | 9.3% | 28 | 9.6% | 26 | 9.7% | 29 |
| West Virginia | 9.8% | 18 | 10.1% | 17 | 10.3% | 17 |
| Wisconsin | 11.0% | 4 | 11.1% | 5 | 11.5% | 5 |
| Wyoming | 7.1% | 48 | 7.3% | 48 | 8.2% | 46 |
| DC | 10.6% | (10) | 10.3% | (16) | 9.7% | (30) |
| Note: As a unique state-local entity, DC’s rank does not affect other states’ rankings, but the figure in parentheses indicates where it would rank if included. The U.S. average is a population-weighted average (weighted by state population). DC is excluded from population-weighted averages. | ||||||
An interesting observation is that many of the least-burdened states forego a major tax. For example, Alaska (50th), Nevada (43rd), South Dakota (49th), Texas (46th), and Wyoming (48th) all do without a tax on wage income. Similarly, Nevada[12], South Dakota, and Wyoming lack a corporate tax, and Alaska has no state-level sales tax (though it does allow local governments to levy sales taxes).[13] While this is an interesting correlation, it does not answer the causal question of whether levying fewer types of taxes leads to lower tax burdens or whether a political demand for lower taxes leads to fewer types of taxes being levied. Also worth considering is the possibility that opting to not levy a personal income tax causes a state to rely more on other forms of taxation that might be more exportable.
Not every state with a significant amount of nonresident income uses it to lighten the tax load of its own residents. Maine and Vermont have the largest shares of vacation homes in the country,[14] and they collect a sizeable fraction of their property tax revenue on those properties, mostly from residents of Connecticut, Massachusetts, and other New England states. Despite this, Maine and Vermont still rank 13th and 11th highest, respectively, in this study.
Despite the importance of nonresident collections and the increasing efforts to boost them, the driving force behind a state’s long-term rise or fall in the tax burden rankings is usually internal and most often a result of deliberate policy choices regarding tax and spending levels or changes in state income levels. This study is not an endorsement of policies that attempt to export tax burdens. From the perspectives of the economy and political efficiency, states can create myriad problems when they purposefully shift tax burdens to residents of other jurisdictions. This study only attempts to quantify the amount of shifting that occurs and understand how it affects the distribution of state and local tax burdens across states.
Historical Trends
Nationally, average state-local tax burdens as a share of income have fallen from 10.7 percent in 1977 to 9.9 percent in 2012. Chart 2 shows the movement of U.S. average state-local tax burdens since 1977.
Chart 2.
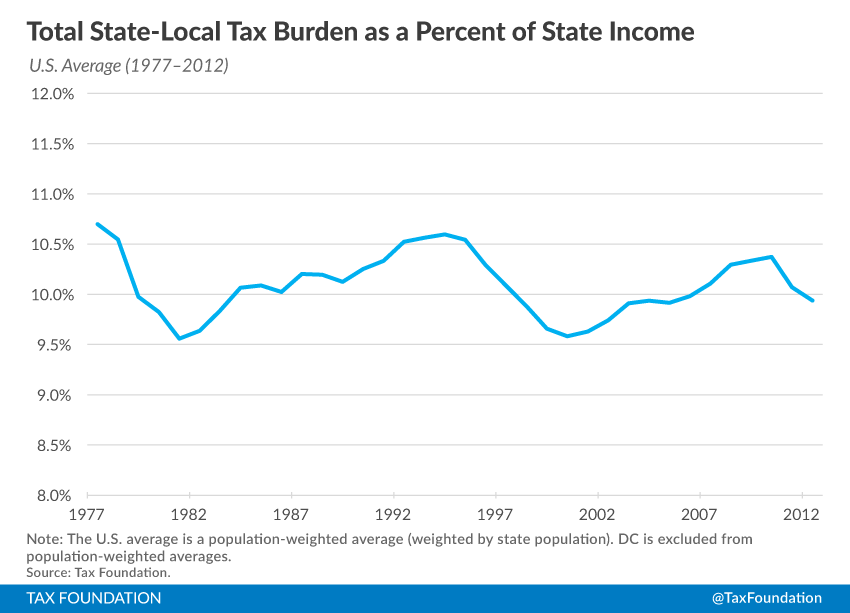
Some states’ residents are paying the same share of their income to taxes now as they were three decades ago, but in other states, tax burdens have changed substantially over time. The tax burden in every state fluctuates as years pass for a variety of reasons, including changes in tax law, state economies, and population. Further, changes outside of a state can impact tax burdens as well. See Table 4 for historical trends in burdens by state (selected years).
| State | 1977 | 1980 | 1985 | 1990 | 1995 | 2000 | 2005 | 2006 | 2007 | 2008 | 2009 | 2010 | 2011 | 2012 |
|---|---|---|---|---|---|---|---|---|---|---|---|---|---|---|
| U.S. Average | 10.7% | 9.8% | 10.1% | 10.3% | 10.5% | 9.6% | 9.9% | 10.0% | 10.1% | 10.3% | 10.3% | 10.4% | 10.1% | 9.9% |
| Alabama | 9.2% | 8.7% | 9.1% | 9.2% | 9.3% | 8.7% | 8.8% | 8.9% | 9.0% | 9.2% | 9.1% | 9.0% | 8.9% | 8.7% |
| Alaska | 11.6% | 8.4% | 6.3% | 5.9% | 5.7% | 5.0% | 5.8% | 5.7% | 6.3% | 6.5% | 7.0% | 7.1% | 6.8% | 6.5% |
| Arizona | 10.7% | 9.6% | 9.8% | 10.3% | 10.1% | 8.7% | 9.1% | 8.9% | 9.5% | 9.3% | 9.0% | 9.0% | 8.9% | 8.8% |
| Arkansas | 8.6% | 8.7% | 8.9% | 9.0% | 9.6% | 9.2% | 10.0% | 10.3% | 10.4% | 10.3% | 10.5% | 10.6% | 10.4% | 10.1% |
| California | 12.2% | 10.8% | 10.6% | 10.8% | 10.9% | 10.5% | 10.5% | 10.8% | 11.3% | 11.6% | 11.4% | 11.7% | 11.5% | 11.0% |
| Colorado | 10.6% | 9.5% | 9.8% | 10.0% | 9.7% | 8.7% | 9.0% | 9.1% | 9.1% | 9.2% | 9.2% | 9.3% | 9.0% | 8.9% |
| Connecticut | 11.1% | 9.9% | 10.3% | 10.7% | 12.3% | 11.1% | 11.7% | 11.6% | 11.6% | 12.2% | 12.5% | 12.6% | 12.2% | 12.6% |
| Delaware | 10.0% | 9.7% | 9.6% | 8.9% | 9.4% | 8.5% | 9.3% | 9.6% | 9.9% | 10.2% | 9.4% | 9.5% | 9.7% | 10.2% |
| Florida | 9.3% | 8.2% | 8.4% | 8.8% | 9.6% | 8.5% | 8.7% | 8.7% | 9.1% | 9.5% | 9.8% | 9.8% | 9.2% | 8.9% |
| Georgia | 9.6% | 9.3% | 9.5% | 10.1% | 10.0% | 9.2% | 9.4% | 9.7% | 9.6% | 9.8% | 9.6% | 9.3% | 9.2% | 9.1% |
| Hawaii | 10.6% | 10.4% | 9.9% | 10.2% | 10.7% | 9.8% | 9.9% | 10.4% | 10.4% | 10.5% | 10.3% | 10.6% | 9.8% | 10.2% |
| Idaho | 10.7% | 9.9% | 10.2% | 10.6% | 10.7% | 10.1% | 9.9% | 9.8% | 9.9% | 10.2% | 10.1% | 9.8% | 9.6% | 9.3% |
| Illinois | 10.6% | 10.0% | 10.1% | 10.2% | 10.2% | 9.3% | 9.8% | 9.9% | 9.9% | 10.2% | 10.6% | 10.7% | 10.5% | 11.0% |
| Indiana | 8.7% | 7.8% | 8.9% | 9.2% | 9.2% | 8.2% | 9.2% | 9.1% | 9.3% | 9.8% | 10.0% | 9.8% | 9.5% | 9.5% |
| Iowa | 10.6% | 10.0% | 10.2% | 10.6% | 10.9% | 9.4% | 9.4% | 9.3% | 9.3% | 9.4% | 9.8% | 9.8% | 9.3% | 9.2% |
| Kansas | 9.7% | 9.1% | 9.4% | 9.9% | 10.3% | 9.4% | 9.6% | 9.8% | 9.7% | 9.8% | 10.0% | 9.9% | 9.5% | 9.5% |
| Kentucky | 9.8% | 9.2% | 9.4% | 9.9% | 10.9% | 9.8% | 10.0% | 9.9% | 10.0% | 10.1% | 9.7% | 9.5% | 9.6% | 9.5% |
| Louisiana | 7.9% | 7.6% | 8.3% | 8.2% | 8.2% | 8.3% | 8.8% | 8.5% | 8.8% | 8.8% | 8.5% | 8.1% | 7.8% | 7.6% |
| Maine | 10.5% | 10.3% | 10.7% | 11.0% | 11.3% | 10.8% | 10.5% | 11.1% | 10.7% | 11.1% | 10.8% | 10.7% | 10.3% | 10.2% |
| Maryland | 11.6% | 11.0% | 10.9% | 11.2% | 11.5% | 10.4% | 10.5% | 10.7% | 11.1% | 11.2% | 10.8% | 10.7% | 10.9% | 10.9% |
| Massachusetts | 12.3% | 11.4% | 10.7% | 10.9% | 11.3% | 9.9% | 10.6% | 10.6% | 10.4% | 10.8% | 10.7% | 10.7% | 10.4% | 10.3% |
| Michigan | 10.7% | 10.0% | 10.8% | 10.2% | 10.2% | 9.5% | 9.8% | 9.8% | 9.7% | 10.0% | 10.3% | 10.0% | 9.6% | 9.4% |
| Minnesota | 11.3% | 10.3% | 11.2% | 11.0% | 11.3% | 10.2% | 10.3% | 10.6% | 10.5% | 10.8% | 11.0% | 11.1% | 10.9% | 10.8% |
| Mississippi | 9.6% | 8.9% | 9.0% | 9.1% | 9.6% | 9.0% | 8.6% | 8.9% | 9.1% | 9.1% | 9.3% | 9.1% | 8.7% | 8.6% |
| Missouri | 9.4% | 8.9% | 9.1% | 9.5% | 10.1% | 9.2% | 9.5% | 9.5% | 9.5% | 9.6% | 9.5% | 9.3% | 9.2% | 9.3% |
| Montana | 9.9% | 9.0% | 9.3% | 9.6% | 9.7% | 8.8% | 9.1% | 9.4% | 9.2% | 9.2% | 9.5% | 9.3% | 8.9% | 8.7% |
| Nebraska | 11.1% | 10.2% | 9.5% | 9.9% | 10.4% | 9.5% | 10.2% | 10.2% | 10.1% | 9.9% | 10.1% | 10.0% | 9.6% | 9.2% |
| Nevada | 8.6% | 7.4% | 7.8% | 7.9% | 8.1% | 7.1% | 7.7% | 7.7% | 7.6% | 7.9% | 8.2% | 8.7% | 8.2% | 8.1% |
| New Hampshire | 9.1% | 8.0% | 8.0% | 8.2% | 9.1% | 7.6% | 7.8% | 7.8% | 7.8% | 8.0% | 8.5% | 8.6% | 8.0% | 7.9% |
| New Jersey | 12.7% | 11.4% | 11.5% | 11.4% | 12.3% | 10.9% | 11.7% | 11.9% | 12.1% | 12.5% | 12.7% | 12.7% | 12.1% | 12.2% |
| New Mexico | 9.2% | 8.8% | 8.8% | 10.4% | 10.3% | 9.8% | 8.4% | 9.3% | 9.5% | 9.6% | 9.2% | 9.0% | 8.9% | 8.7% |
| New York | 13.4% | 12.4% | 12.7% | 12.6% | 13.1% | 11.6% | 12.2% | 12.3% | 12.1% | 12.6% | 12.8% | 13.0% | 12.7% | 12.7% |
| North Carolina | 10.0% | 9.7% | 9.8% | 10.1% | 10.4% | 9.5% | 10.1% | 10.4% | 10.4% | 10.7% | 10.4% | 10.3% | 10.1% | 9.8% |
| North Dakota | 11.9% | 10.1% | 9.5% | 10.0% | 10.3% | 9.3% | 8.8% | 9.3% | 9.6% | 9.0% | 9.8% | 9.3% | 9.2% | 9.0% |
| Ohio | 9.1% | 8.6% | 10.0% | 10.1% | 10.7% | 10.1% | 11.0% | 10.6% | 10.4% | 10.5% | 10.0% | 10.0% | 9.9% | 9.8% |
| Oklahoma | 8.9% | 8.2% | 9.0% | 9.7% | 10.2% | 9.5% | 9.3% | 9.3% | 9.2% | 9.1% | 9.3% | 9.1% | 8.7% | 8.6% |
| Oregon | 11.4% | 10.5% | 11.5% | 11.3% | 11.1% | 9.9% | 10.0% | 10.4% | 10.2% | 10.0% | 10.3% | 10.7% | 10.4% | 10.3% |
| Pennsylvania | 10.6% | 10.1% | 10.5% | 10.2% | 10.8% | 9.8% | 10.5% | 10.5% | 10.5% | 10.8% | 10.4% | 10.4% | 10.3% | 10.2% |
| Rhode Island | 11.6% | 10.9% | 11.0% | 11.0% | 11.9% | 10.9% | 11.1% | 11.1% | 10.8% | 11.1% | 11.3% | 11.2% | 10.7% | 10.8% |
| South Carolina | 9.4% | 9.2% | 9.5% | 9.8% | 9.5% | 9.0% | 8.9% | 8.9% | 9.1% | 9.0% | 8.9% | 8.7% | 8.4% | 8.4% |
| South Dakota | 9.3% | 8.4% | 8.1% | 8.0% | 8.0% | 7.1% | 7.5% | 7.4% | 7.5% | 7.4% | 7.8% | 7.7% | 7.2% | 7.1% |
| Tennessee | 8.3% | 7.5% | 7.8% | 7.8% | 7.7% | 6.9% | 7.5% | 7.6% | 7.7% | 7.8% | 7.8% | 7.8% | 7.5% | 7.3% |
| Texas | 8.1% | 7.2% | 7.7% | 8.4% | 8.6% | 7.3% | 7.8% | 7.7% | 7.9% | 7.8% | 8.2% | 8.2% | 7.6% | 7.6% |
| Utah | 10.7% | 10.5% | 11.0% | 10.8% | 10.8% | 10.2% | 10.3% | 10.4% | 10.2% | 10.3% | 10.0% | 9.8% | 9.7% | 9.6% |
| Vermont | 11.9% | 10.2% | 10.6% | 10.6% | 10.8% | 10.0% | 11.0% | 11.1% | 10.7% | 10.9% | 10.6% | 10.6% | 10.5% | 10.3% |
| Virginia | 10.4% | 9.8% | 9.8% | 10.1% | 10.4% | 9.7% | 9.8% | 9.8% | 10.1% | 10.1% | 9.9% | 9.8% | 9.5% | 9.3% |
| Washington | 9.9% | 9.0% | 9.4% | 9.7% | 10.3% | 8.5% | 9.4% | 9.4% | 9.5% | 9.6% | 9.6% | 9.7% | 9.6% | 9.3% |
| West Virginia | 9.9% | 9.6% | 10.6% | 9.6% | 9.7% | 9.6% | 9.6% | 9.7% | 9.7% | 10.1% | 10.2% | 10.3% | 10.1% | 9.8% |
| Wisconsin | 12.9% | 11.5% | 12.4% | 11.8% | 12.3% | 11.3% | 10.9% | 10.9% | 10.8% | 11.0% | 11.4% | 11.5% | 11.1% | 11.0% |
| Wyoming | 8.3% | 7.4% | 7.6% | 6.6% | 6.7% | 6.6% | 7.1% | 7.2% | 7.2% | 7.5% | 8.1% | 8.2% | 7.3% | 7.1% |
| DC | 12.3% | 13.0% | 12.4% | 12.4% | 11.7% | 11.4% | 11.8% | 11.4% | 11.3% | 11.4% | 9.6% | 9.7% | 10.3% | 10.6% |
| Note: The U.S. average is a population-weighted average (weighted by state population). DC is excluded from population-weighted averages. | ||||||||||||||
States Where the Tax Burden Has Fallen over Time
Once again, Alaska is the extreme example. Before the Trans-Alaska Pipeline system was finished in 1977, taxpayers in Alaska paid 11.6 percent of their income in state and local taxes. By 1980, with oil tax revenue pouring in, Alaska repealed its personal income tax and started sending out checks to residents instead. The tax burden plummeted, and now Alaskans are the least taxed with a burden of only 6.5 percent of income. Other states that have seen significant decreases in burdens are described below.
- North Dakota’s burden has fallen from 11.9 percent in 1977 to 9.0 percent of income in 2012. Its burden was even lower in 2005 at 8.8 percent.
- South Dakota’s burden has fallen 2.2 percentage points since 1977, when it was 9.3 percent. In 2012, it was 7.1 percent.
- Massachusetts has experienced a burden decrease of 2 percentage points since 1977, when its burden was 12.3 percent of income. In 2012, the tax burden dropped to 10.3 percent of state income.
States Where the Tax Burden Has Risen over Time
Although most states have seen a decrease in tax burdens over time, some have experienced increases. Since 1977, Arkansas taxpayers have gone from some of the least taxed at 8.6 percent to some of the more heavily taxed with a burden of 10.1 percent. Other notable increases include:
- Indiana taxpayers have seen their burden rise from 8.7 percent of income to 9.5 percent since 1977.
- Connecticut taxpayers’ burden has risen 1.5 percentage points from 11.1 percent of state income in 1977 to 12.6 percent in 2012.
- Ohio’s burden has risen from 9.1 percent of state income in 1977 to 9.8 percent in 2012.
Conclusion
When measuring the burden imposed on a given state’s residents by all state and local taxes, one cannot look exclusively to collections figures for the governments located within state borders. A significant amount of tax shifting takes place across state lines, and this shifting is not uniform. Further, this shifting should not be ignored when attempting to understand the burden faced by taxpayers within a state.
[1] This is meant to be a simplified, instructive example of the difference between legal and economic incidence. For a description of the incidence assumptions our tax burden model uses for gasoline excise taxes see Liz Malm and Gerald Prante, “State-Local Tax Burden Rankings: Methodology,” Tax Foundation, January 19, 2016.
[2] “State & Local Government Finance.” Census Bureau.
[3] Drenkard, Scott, and Jared Walczak. “State and Local Sales Taxes Rates, Midyear 2015.” Tax Foundation. July 1, 2015.
[4] McClure, Charles E. “The Interstate Exporting of State and Local Taxes: Estimates for 1962.” National Tax Journal 20, no. 1 (1967): 49–75.
[5] “State & Local Government Finance.” Census Bureau.
[6] Malm, Liz, and Gerald Prante. “State-Local Tax Burden Rankings: Methodology.” Tax Foundation. January 19, 2016.
[7] “State & Local Government Finance.” Census Bureau.
[8] Malm, Liz, and Gerald Prante. “State-Local Tax Burden Rankings: Methodology.” Tax Foundation. January 19, 2016.
[9] For all incidence assumptions and a description of each allocation method, see Liz Malm and Gerald Prante, “State-Local Tax Burden Rankings: Methodology,” Tax Foundation, January 19, 2016.
[10] An explanation of the income portion of the model begins on page 17.
[11] Business taxes collected by states are allocated nationwide based on each state’s share of capital and labor income. States with high capital gains tax rates will have larger capital income relative to other states.
[12] Walczak, Jared. “Nevada Approves New Tax on Business Gross Receipts.” Tax Foundation. June 8, 2015.
[13] The average local sales tax rate in Alaska is 1.78 percent. See Scott Drenkard and Jared Walczak, “State and Local Sales Taxes Rates, Midyear 2015,” Tax Foundation, July 1, 2015.
[14] “Historical Census of Housing Tables: Vacation Homes.” Census Bureau, Census of Housing.