Key Findings
- In 2017, OECD countries raised one-third of their taxA tax is a mandatory payment or charge collected by local, state, and national governments from individuals or businesses to cover the costs of general government services, goods, and activities. revenue through consumption taxes such as the Value-Added Tax (VAT), making consumption taxes on average the most important revenue source.
- Social insurance taxes and individual income taxes were the second and third most important sources of tax revenue in the OECD, respectively, at approximately 25 percent each, a change from 1990, when individual income taxes accounted for more revenue than social insurance taxes.
- On average, OECD countries collected little from the corporate income taxA corporate income tax (CIT) is levied by federal and state governments on business profits. Many companies are not subject to the CIT because they are taxed as pass-through businesses, with income reportable under the individual income tax. (9.2 percent) and the property taxA property tax is primarily levied on immovable property like land and buildings, as well as on tangible personal property that is movable, like vehicles and equipment. Property taxes are the single largest source of state and local revenue in the U.S. and help fund schools, roads, police, and other services. (5.7 percent).
Introduction
Developed countries raise tax revenue through a mix of individual income taxes, corporate income taxes, social insurance taxes, taxes on goods and services, and property taxes. However, the extent to which an individual country relies on any of these taxes can differ substantially.
A country may decide to have a lower corporate income tax to attract investment, which may reduce its reliance on the corporate income tax revenue and increase its reliance on other taxes, such as social insurance taxes or consumption taxes. For example, in 2017, Estonia raised only 4.7 percent of total revenue from corporate income taxes, but a combined 76.8 percent of total revenue came from social insurance taxes and consumption taxes.
Countries may also be situated near natural resources that allow them to rely heavily on taxes on related economic activity. Norway, for example, has a substantial oil production industry on which it levies a high (78 percent) income tax and thus raises a significant amount of corporate income tax revenue.
These policy and economic differences among Organisation for Economic Co-operation and Development (OECD) countries have created differences in how they raise tax revenue.
Average OECD Revenue Sources
Figure 1.
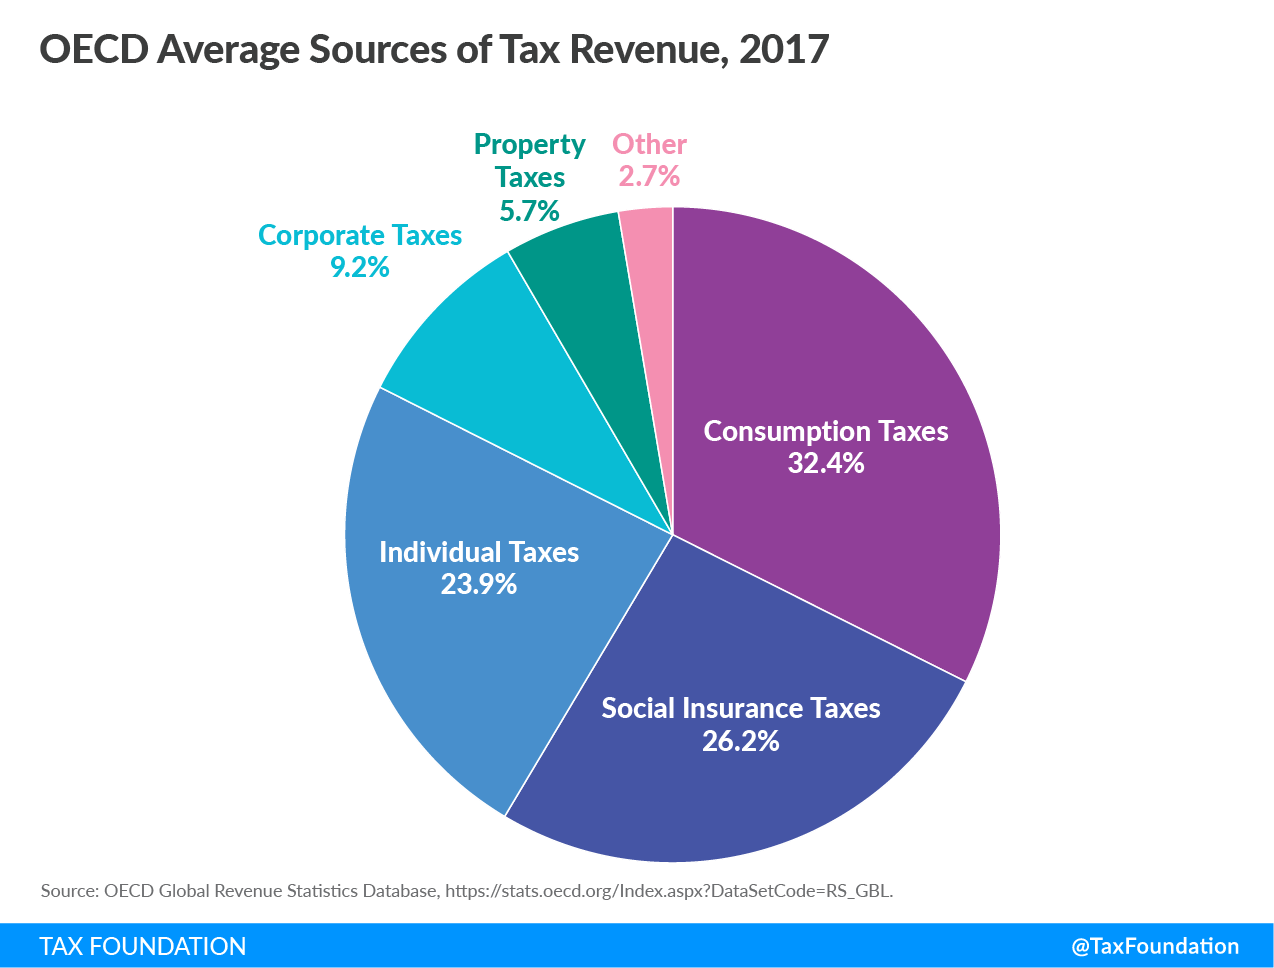
Per the most recent data from the OECD (2017),[2] taxes on consumption and labor made up the largest shares of tax revenue among OECD countries. On average, countries raised 32.4 percent of their tax revenue from consumption taxes. This is unsurprising given that all OECD countries (except the United States) levy Value-Added Taxes (VAT) at relatively high rates.
The next significant source of tax revenue is social insurance taxes at 26.2 percent of revenue on average. Individual income taxes accounted for 23.9 percent of total revenue across the OECD. The smallest shares of revenue were from corporate income taxes (9.2 percent) and property taxes (5.7 percent).
OECD Revenue Sources, 2017 Compared to 1990
Figure 2.
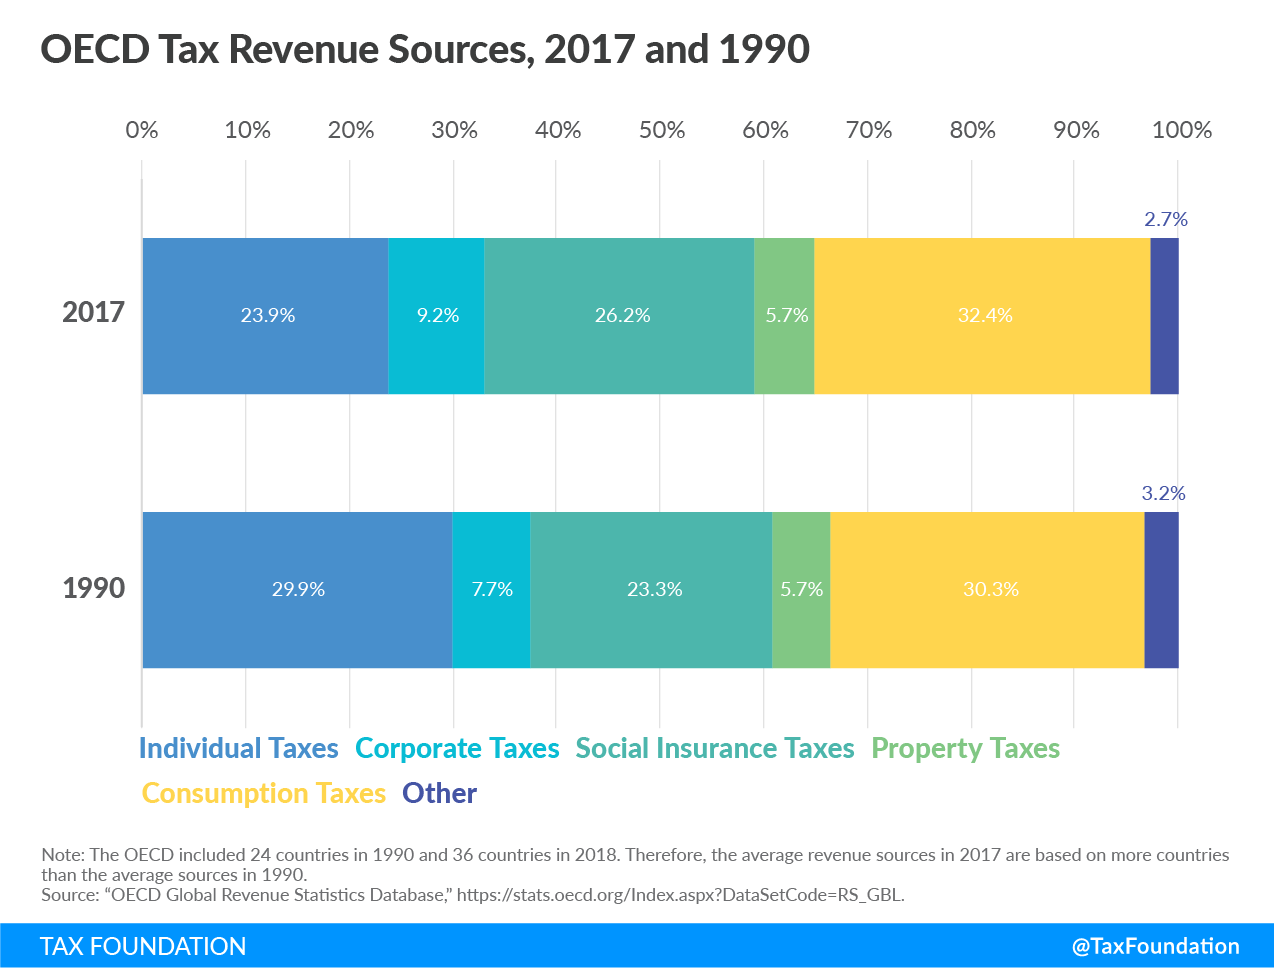
When comparing average 2017 and 1990 OECD tax revenue sources, the most notable change is a decrease in individual income taxes versus increases in social insurance and consumption taxes. Revenue sources from corporate income taxes have also increased compared to 1990 (despite declining corporate income tax rates[3]). The relative importance of property taxes as a source of revenue has stayed constant.
Sources of Tax Revenue
Consumption Taxes
Consumption taxes are taxes on goods and services. These are in the form of excise taxes, Value-Added Taxes (VAT), or retail sales taxes. Most OECD countries levy consumption taxes through VATs and excise taxes. The United States is the only country in the OECD with no VAT. Instead, most U.S. state governments and many local governments apply a retail sales taxA sales tax is levied on retail sales of goods and services and, ideally, should apply to all final consumption with few exemptions. Many governments exempt goods like groceries; base broadening, such as including groceries, could keep rates lower. A sales tax should exempt business-to-business transactions which, when taxed, cause tax pyramiding. on the final sale of products and excise taxes on the production of goods such as cigarettes and alcohol.[4]
In 2017, Chile relied the most on taxes on goods and services, raising approximately 54.8 percent of its total tax revenue from these taxes. Chile was followed by Turkey (43.4 percent) and Estonia (42.9 percent) (Table 1, below).
The United States raised the least amount of tax revenue from consumption taxes in the OECD at 15.9 percent in 2017. Japan raised slightly more, at 20.4 percent, followed by Switzerland, at 22.3 percent.
Social Insurance Taxes
Social insurance taxes are typically levied in order to fund specific programs such as unemployment insurance, health insurance, and old age insurance. In most countries, these taxes are applied to both an individual’s wage and an employer’s payroll.
The Slovak Republic relied the most on social insurance taxes (44.1 percent), followed by the Czech Republic (43 percent) and Lithuania (41.4 percent) (Table 1, below).
Denmark raised the least, at 0.1 percent, because social programs in Denmark are mostly funded from taxes other than dedicated social insurance taxes. Australia and New Zealand are the only countries that do not levy specific social insurance taxes on workers to fund government programs.
Individual Income Taxes
Income taxes are levied directly on an individual’s income, beginning with wage income. Many nations also levy their individual income taxAn individual income tax (or personal income tax) is levied on the wages, salaries, investments, or other forms of income an individual or household earns. The U.S. imposes a progressive income tax where rates increase with income. The Federal Income Tax was established in 1913 with the ratification of the 16th Amendment. Though barely 100 years old, individual income taxes are the largest source of tax revenue in the U.S. on investment income such as capital gains, dividends, interest, and business income. These taxes are typically levied in a progressive manner, meaning that an individual’s average tax rateThe average tax rate is the total tax paid divided by taxable income. While marginal tax rates show the amount of tax paid on the next dollar earned, average tax rates show the overall share of income paid in taxes. increases as income increases.
The country with the highest reliance on individual income taxes in 2017 was Denmark (53.4 percent), followed by Australia (40.8 percent) and the United States (38.6 percent) (Table 1, below).
Chile (9.7 percent), the Slovak Republic (10.3 percent), and the Czech Republic (11.6 percent) relied the least on individual income taxes.
Corporate Income Taxes
The corporate income tax is a direct taxA direct tax is levied on individuals and organizations and cannot be shifted to another payer. Often with a direct tax, such as the personal income tax, tax rates increase as the taxpayer’s ability to pay increases, resulting in what’s called a progressive tax. on corporate profits. All OECD countries levy a tax on corporate profits. However, countries differ substantially in how they define taxable incomeTaxable income is the amount of income subject to tax, after deductions and exemptions. For both individuals and corporations, taxable income differs from—and is less than—gross income. and the rate at which they apply the tax. Generally, the corporate income tax raises little revenue compared to other sources.
Chile relied the most on its corporate income tax, at 21.1 percent of total tax revenue. Mexico (21 percent) and Australia (16.5 percent) also relied heavily on their corporate income tax compared to the OECD average of 9.2 percent (Table 1, below).
In 2017, Estonia (4.7 percent), Slovenia (4.9 percent), and Hungary (4.9 percent) relied the least on the corporate income tax.
Property Taxes
A much smaller source of tax revenue for most OECD countries is the property tax. The property tax is levied on the value of an individual’s or business’s property. Other types of property taxes include estate, gift, and inheritance taxes, and net wealth taxes.
The United States relied the most on property taxes in the OECD (15.4 percent), followed by the United Kingdom (12.6 percent) and Canada (11.9 percent) (Table 1, below).
Estonia relied the least on property taxes, raising only 0.7 percent of total revenue. Austria, Lithuania, and the Slovak Republic (all at 1.3 percent) also relied very little on property taxes.
Revenue Sources of Selected Countries Compared to the OECD Average
The OECD averages described above reflect overall tendencies in revenue collections of developed countries. However, many OECD countries deviate from these averages quite substantially, reflecting social and economic differences across countries. The following country profiles illustrate different distributions of tax revenue sources.
Figure 3.
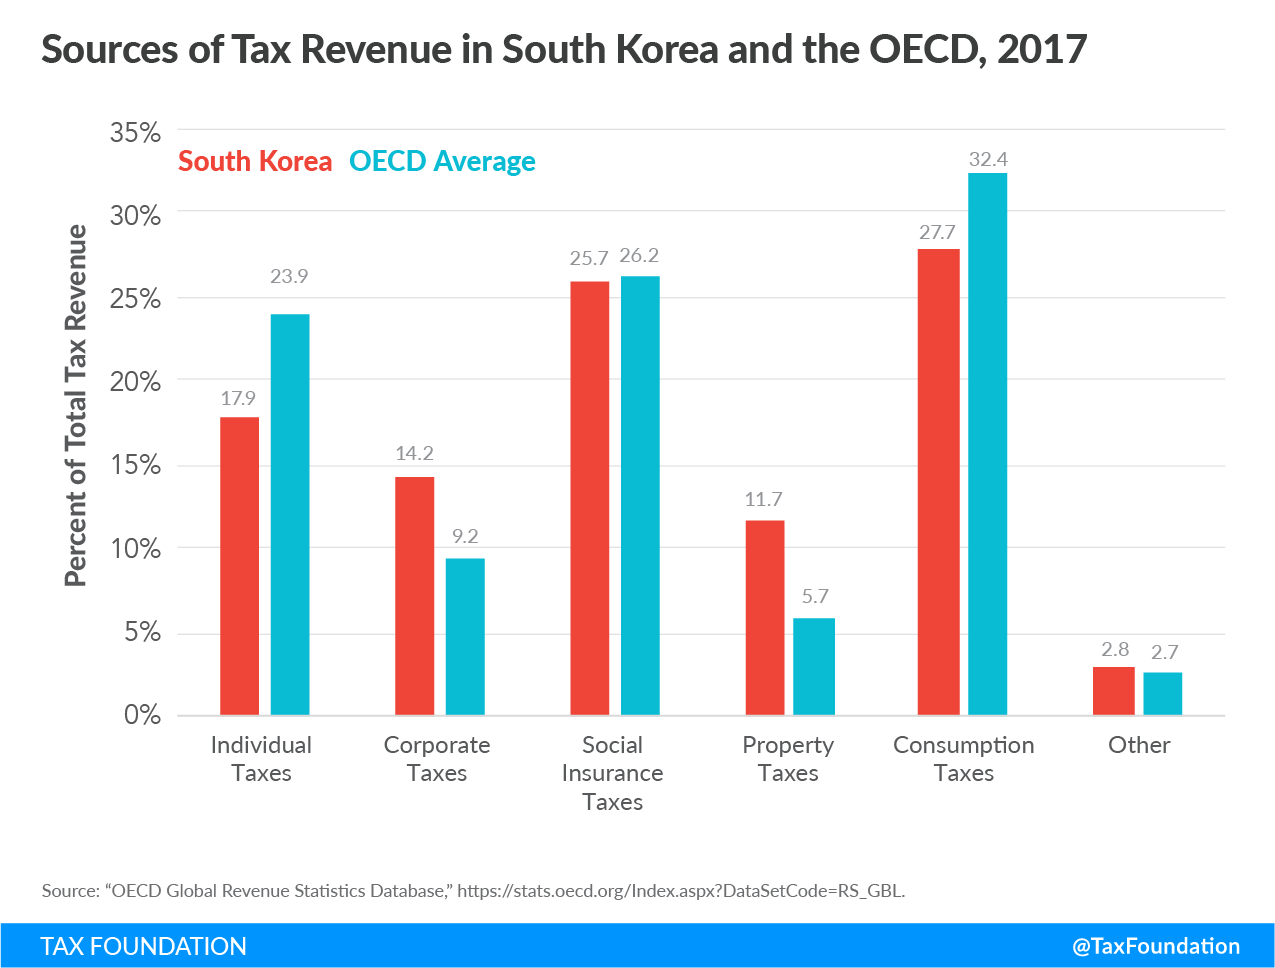
South Korea relies less on individual income and consumption taxes than the OECD average. Instead, corporate income and property taxes account for a larger share of tax revenue. Social insurance taxes are slightly lower than the OECD average.
Figure 4.
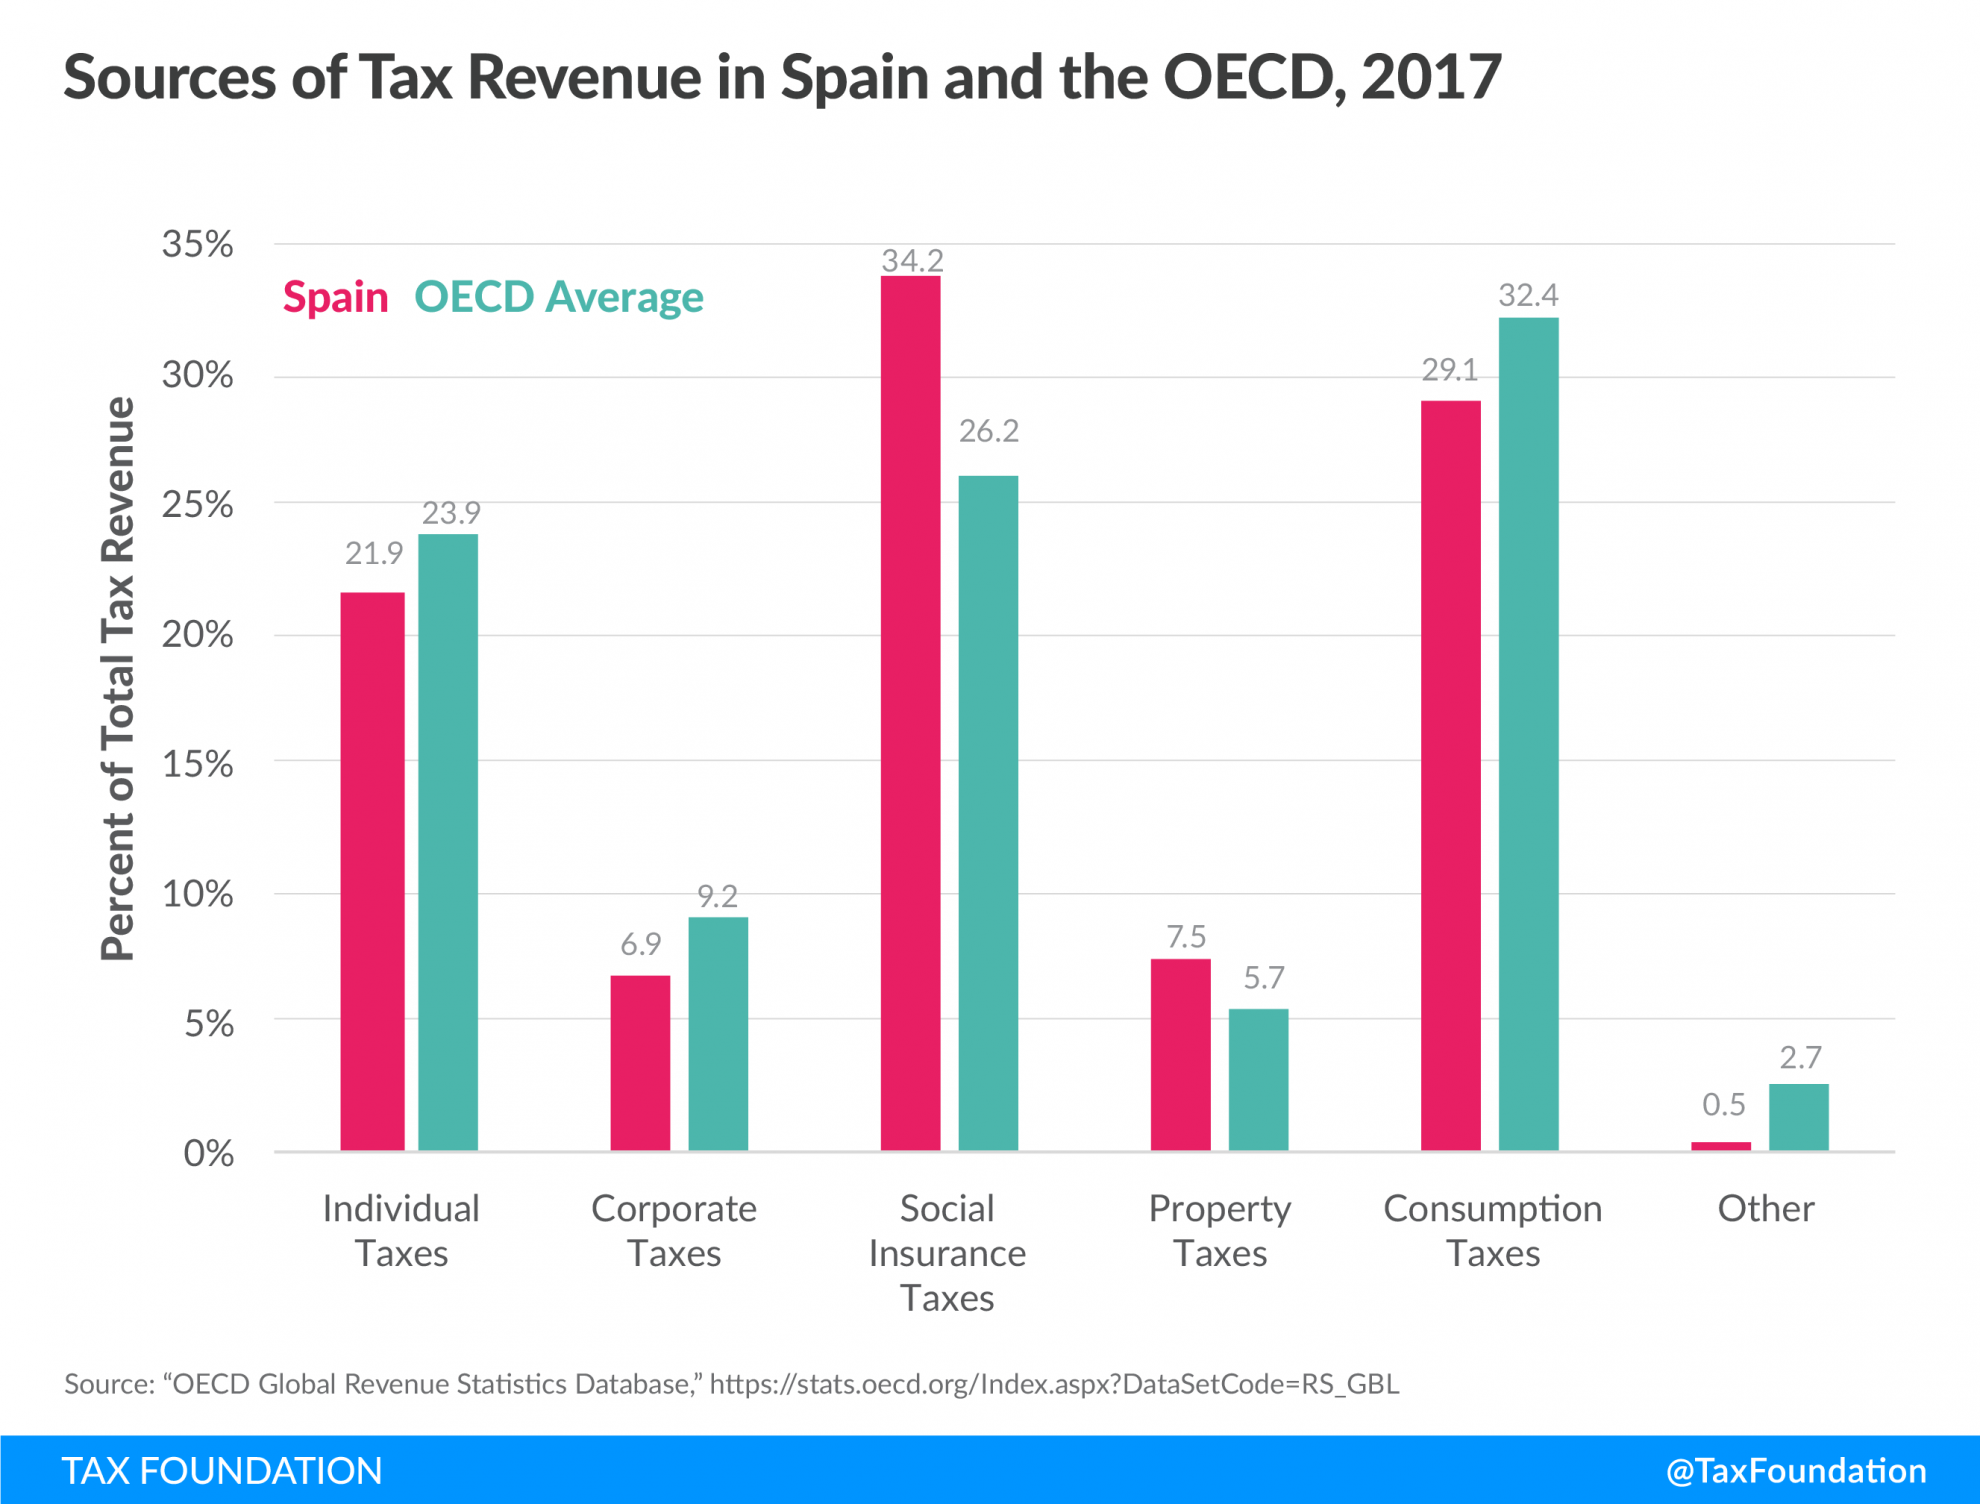
In 2017, social insurance taxes accounted for more than one-third of Spain’s tax revenue, compared to an OECD average of approximately one-fourth, making it the country’s most important revenue source. Spain’s share of property tax revenue was also above the OECD average. At the same time, the country relies less on revenue from individual income taxes, corporate income taxes, and consumption taxes.
Figure 5.
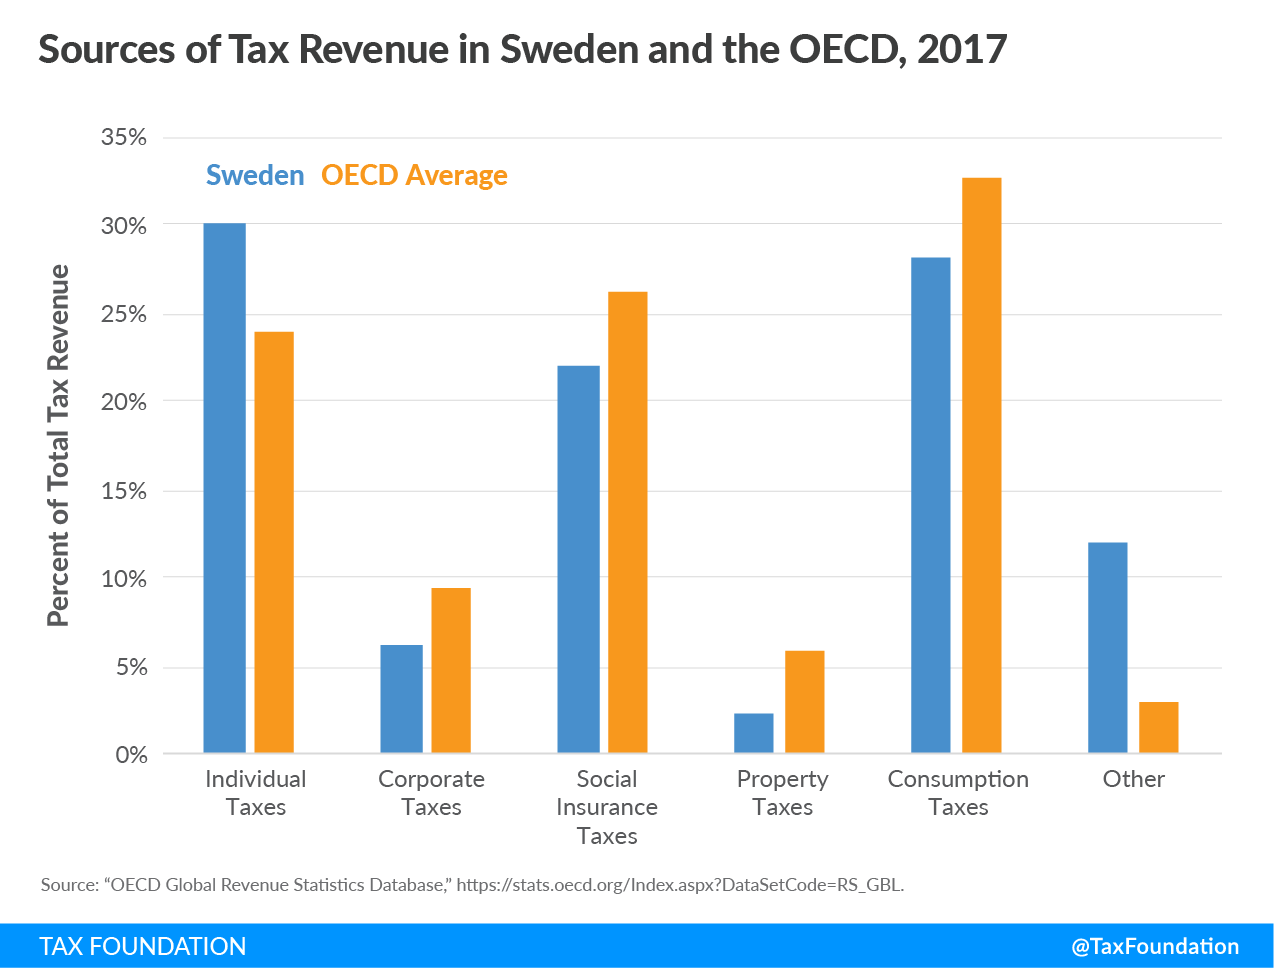
Sweden, the country with the fourth highest tax burden in 2017 as measured by total tax revenue as a percentage of GDP,[5] also deviates in its revenue source distribution from the OECD average. Sweden’s individual income tax revenue share is above the OECD average, and it levies a high payroll taxA payroll tax is a tax paid on the wages and salaries of employees to finance social insurance programs like Social Security, Medicare, and unemployment insurance. Payroll taxes are social insurance taxes that comprise 24.8 percent of combined federal, state, and local government revenue, the second largest source of that combined tax revenue. , which generates 11.9 percent of its tax revenue. Sweden relies less on corporate income taxes, social insurance taxes, property taxes, and consumption taxes.
Conclusion
In general, OECD countries lean more on tax revenue from consumption taxes, social insurance taxes, and individual income taxes than on corporate income taxes and property taxes. Compared to 1990, OECD countries have on average become more reliant on consumption taxes and less reliant on individual income taxes. These policy changes matter, considering that consumption-based taxes raise revenue with less economic damage and distortionary effects than taxes on income.
|
(a) Data for Australia, Japan, and Mexico is from 2016 because 2017 data was not available yet. (b) For Greece, only the aggregate Taxes on Income, Profits and Capital Gains was available for the year 2017. To split this aggregate into the three subcategories—Individual Income Taxes, Corporate Income Taxes and Other Income Taxes—each subcategory’s average share of the three years prior (2014-2016) was used to weigh it. Source: “OECD Global Revenue Statistics Database,” https://stats.oecd.org/Index.aspx?DataSetCode=RS_GBL. |
||||||
| Individual Taxes | Corporate Taxes | Social Insurance Taxes | Property Taxes | Consumption Taxes | Other | |
|---|---|---|---|---|---|---|
| Australia (a) | 40.8% | 16.5% | 0.0% | 10.8% | 27.1% | 4.9% |
| Austria | 21.7% | 5.9% | 34.8% | 1.3% | 28.2% | 8.2% |
| Belgium | 27.2% | 9.3% | 30.5% | 7.9% | 24.3% | 0.9% |
| Canada | 35.9% | 10.6% | 14.3% | 11.9% | 24.0% | 3.3% |
| Chile | 9.7% | 21.1% | 7.3% | 5.4% | 54.8% | 1.8% |
| Czech Republic | 11.6% | 10.6% | 43.0% | 1.4% | 32.9% | 0.5% |
| Denmark | 53.4% | 6.6% | 0.1% | 4.0% | 31.9% | 4.1% |
| Estonia | 17.3% | 4.7% | 33.9% | 0.7% | 42.9% | 0.5% |
| Finland | 29.1% | 6.3% | 27.9% | 3.6% | 32.8% | 0.2% |
| France | 18.5% | 5.1% | 36.4% | 9.5% | 24.4% | 6.1% |
| Germany | 27.2% | 5.4% | 37.9% | 2.7% | 26.2% | 0.6% |
| Greece (b) | 15.4% | 5.7% | 29.6% | 8.1% | 39.1% | 2.1% |
| Hungary | 13.3% | 4.9% | 33.9% | 2.8% | 42.5% | 2.5% |
| Iceland | 38.5% | 7.4% | 9.3% | 5.4% | 33.3% | 6.1% |
| Ireland | 31.4% | 12.2% | 17.0% | 5.6% | 32.5% | 1.2% |
| Israel | 20.7% | 10.1% | 16.2% | 10.0% | 34.7% | 8.4% |
| Italy | 25.7% | 5.0% | 30.4% | 6.0% | 28.4% | 4.4% |
| Japan (a) | 18.6% | 12.0% | 40.4% | 8.3% | 20.4% | 0.3% |
| Korea | 17.9% | 14.2% | 25.7% | 11.7% | 27.7% | 2.8% |
| Latvia | 21.8% | 5.2% | 27.7% | 3.3% | 41.4% | 0.6% |
| Lithuania | 13.0% | 5.1% | 41.4% | 1.3% | 38.5% | 0.8% |
| Luxembourg | 23.6% | 13.6% | 28.6% | 9.6% | 24.3% | 0.3% |
| Mexico (a) | 20.4% | 21.0% | 13.0% | 1.9% | 38.8% | 5.0% |
| Netherlands | 21.6% | 8.5% | 35.7% | 4.0% | 29.1% | 1.1% |
| New Zealand | 37.7% | 14.7% | 0.0% | 6.0% | 38.4% | 3.2% |
| Norway | 26.3% | 12.0% | 27.1% | 3.3% | 31.1% | 0.1% |
| Poland | 14.7% | 5.7% | 37.9% | 3.6% | 34.4% | 3.7% |
| Portugal | 18.8% | 9.4% | 26.8% | 4.0% | 39.8% | 1.2% |
| Slovak Republic | 10.3% | 9.8% | 44.1% | 1.3% | 33.4% | 1.1% |
| Slovenia | 14.2% | 4.9% | 40.0% | 1.8% | 38.6% | 0.5% |
| Spain | 21.9% | 6.9% | 34.2% | 7.5% | 29.1% | 0.5% |
| Sweden | 29.9% | 6.0% | 22.0% | 2.2% | 28.0% | 11.9% |
| Switzerland | 30.7% | 11.5% | 23.6% | 7.1% | 22.3% | 4.8% |
| Turkey | 14.5% | 6.8% | 29.3% | 4.5% | 43.4% | 1.3% |
| United Kingdom | 27.4% | 8.5% | 19.2% | 12.6% | 31.5% | 0.8% |
| United States | 38.6% | 7.1% | 23.1% | 15.4% | 15.9% | 0.0% |
| OECD Simple Average | 23.9% | 9.2% | 26.2% | 5.7% | 32.4% | 2.7% |
[1] EY, “2017 Global Oil and Gas TaxA gas tax is commonly used to describe the variety of taxes levied on gasoline at both the federal and state levels, to provide funds for highway repair and maintenance, as well as for other government infrastructure projects. These taxes are levied in a few ways, including per-gallon excise taxes, excise taxes imposed on wholesalers, and general sales taxes that apply to the purchase of gasoline. Guide, Norway,” 2017, https://www.ey.com/Publication/vwLUAssets/ey-oil-and-gas-tax-pdf/$File/ey-oil-and-gas-tax-pdf.pdf.
[2] OECD, “Global Revenue Statistics Database,” https://stats.oecd.org/Index.aspx?DataSetCode=RS_GBL.
[3] Daniel Bunn and Elke Asen, “Higher Corporate Tax Revenues Globally Despite Lower Tax Rates,” Tax Foundation, Jan. 22, 2019, https://taxfoundation.org/higher-corporate-tax-revenues-lower-tax-rates/.
[4] Janelle Cammenga, “State and Local Sales Tax Rates, 2019,” Tax Foundation, Jan. 30, 2019, https://taxfoundation.org/sales-tax-rates-2019/.
[5] OECD, “Global Revenue Statistics Database,” https://stats.oecd.org/Index.aspx?DataSetCode=RS_GBL.
Share this article