Skip to content

Taxes In DC

2026 DC Tax Rates, Collections, and Burdens

How Do DC Taxes Compare to Other States?

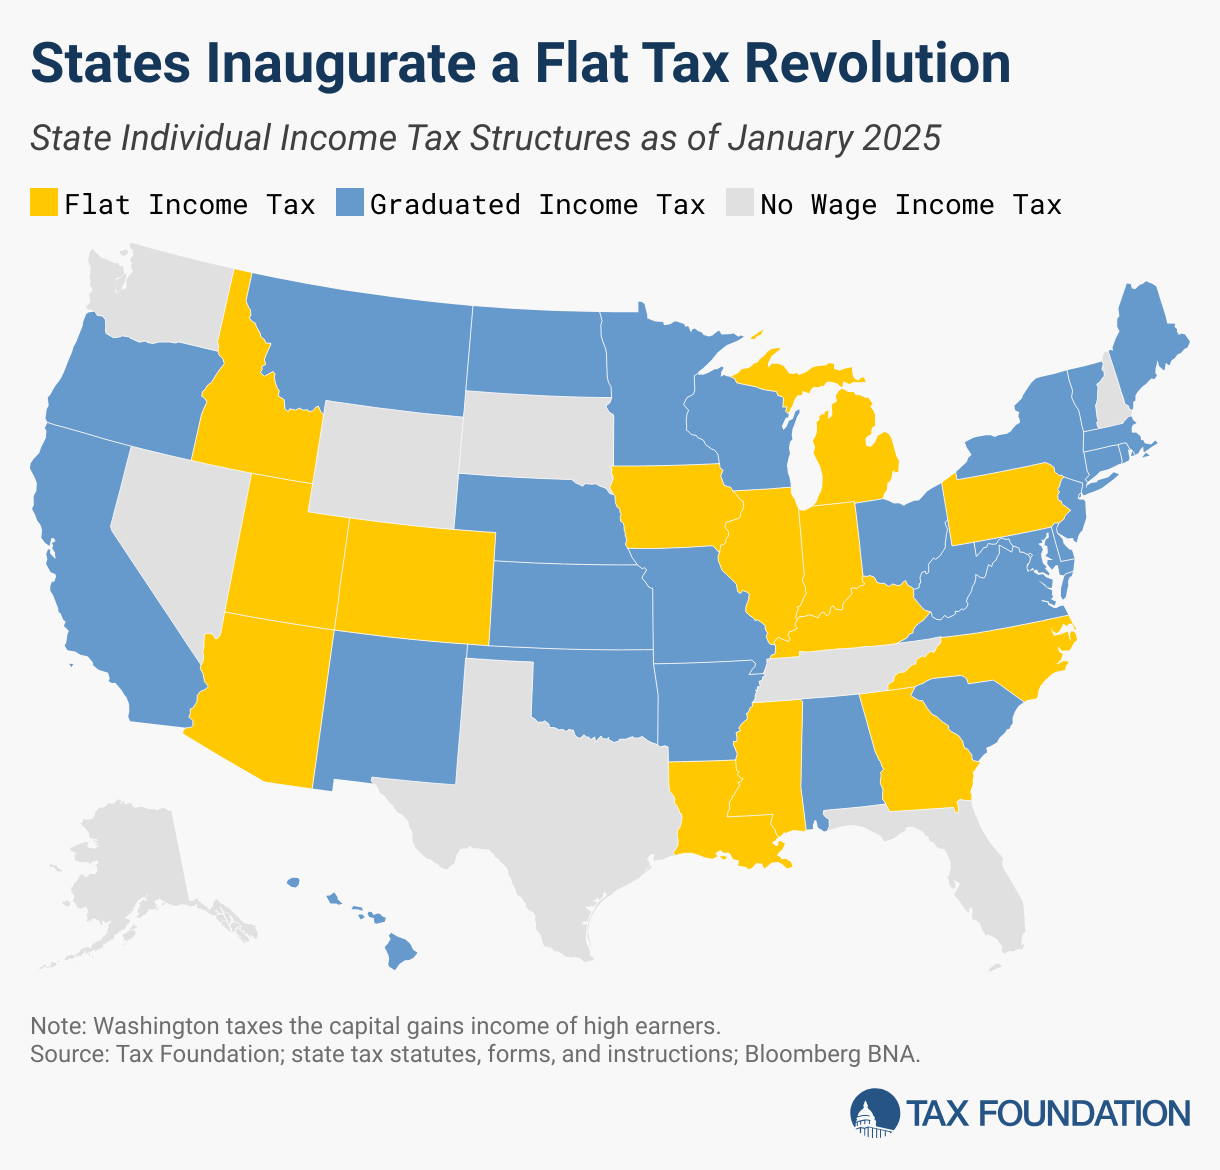
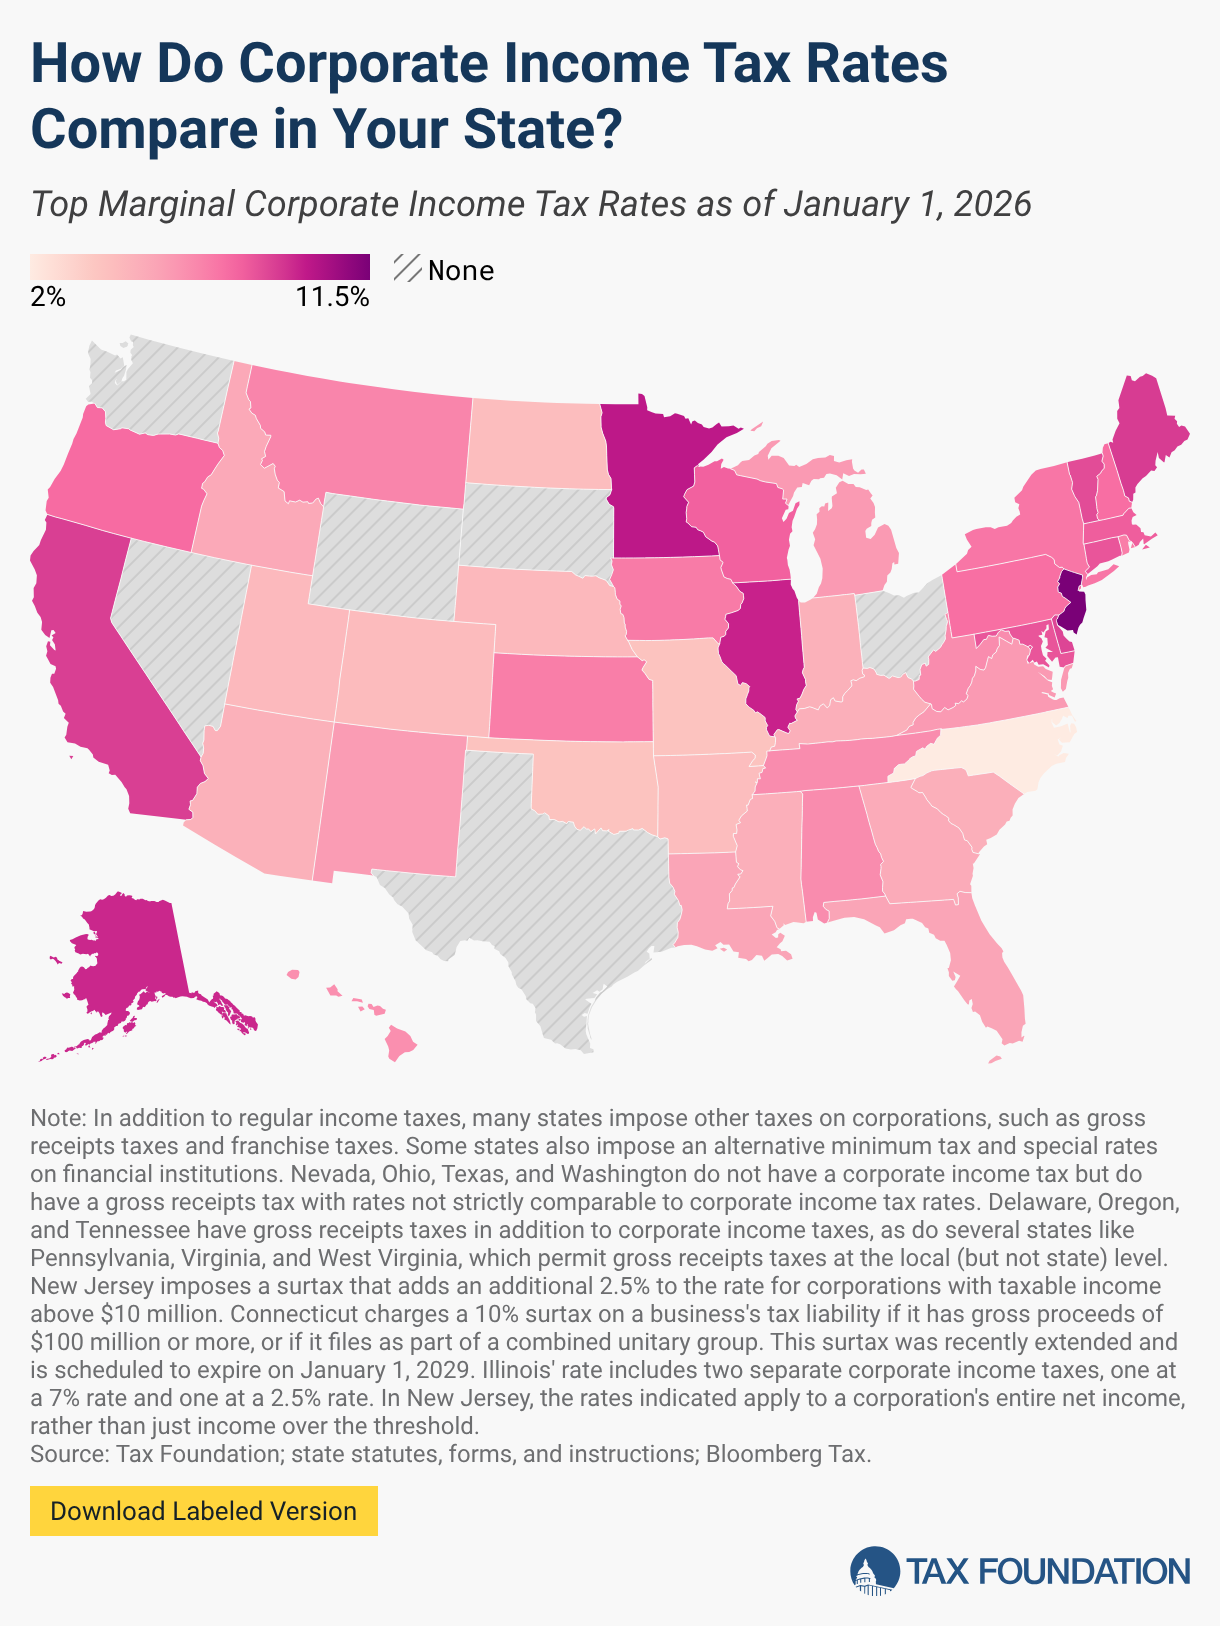
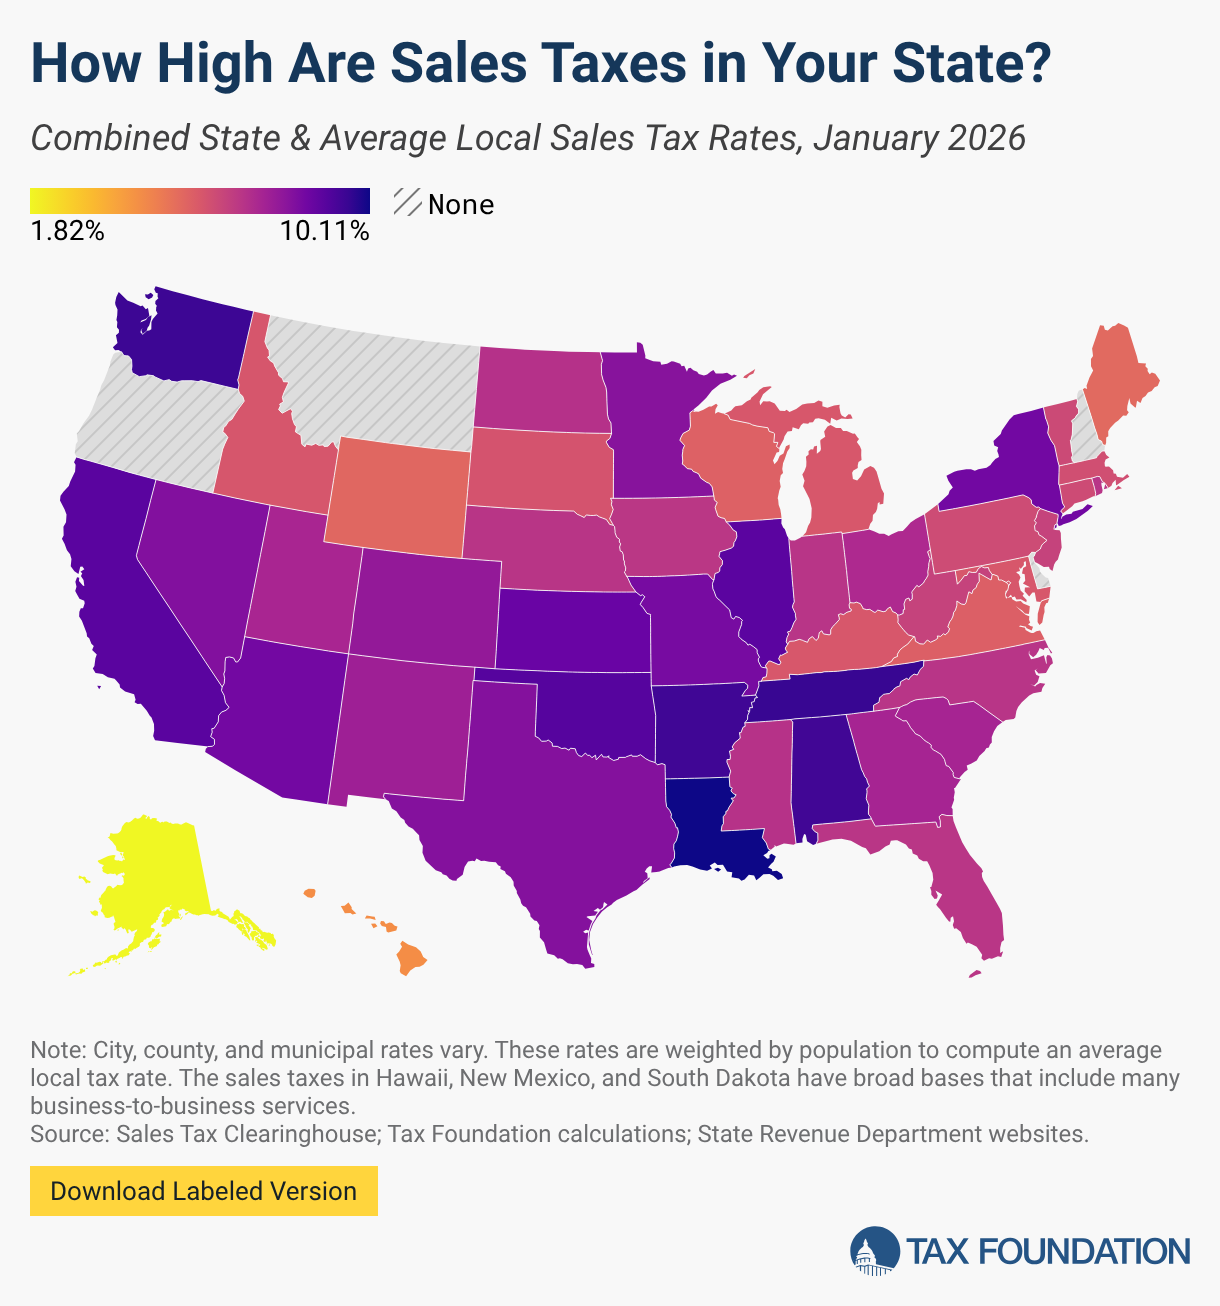
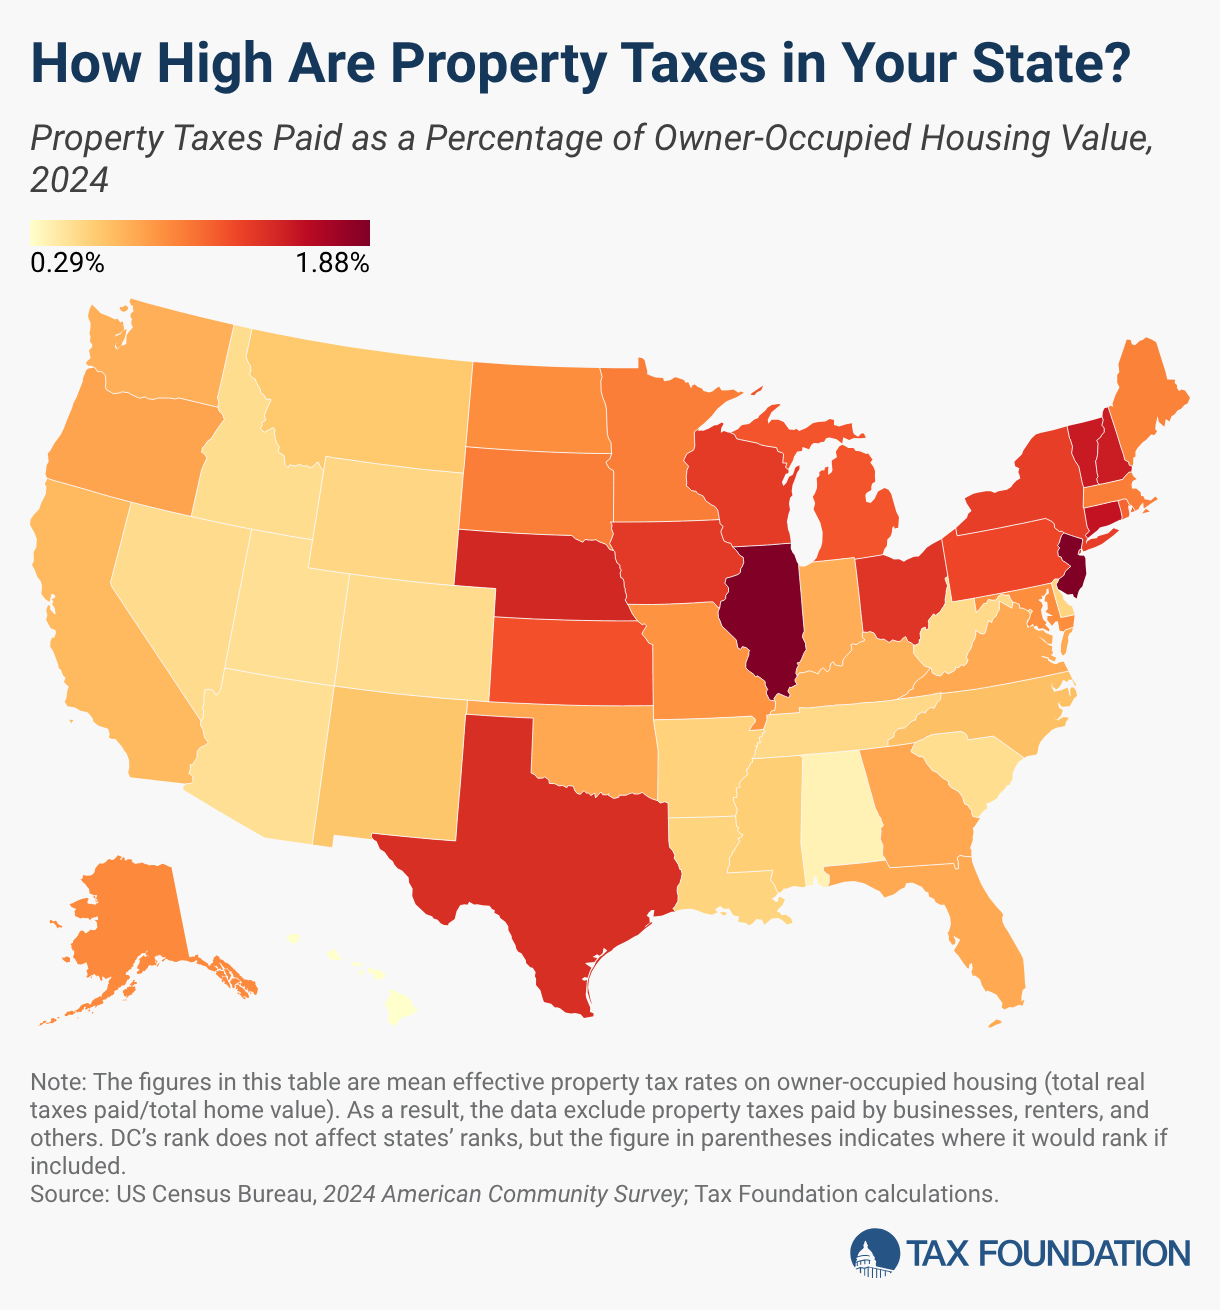
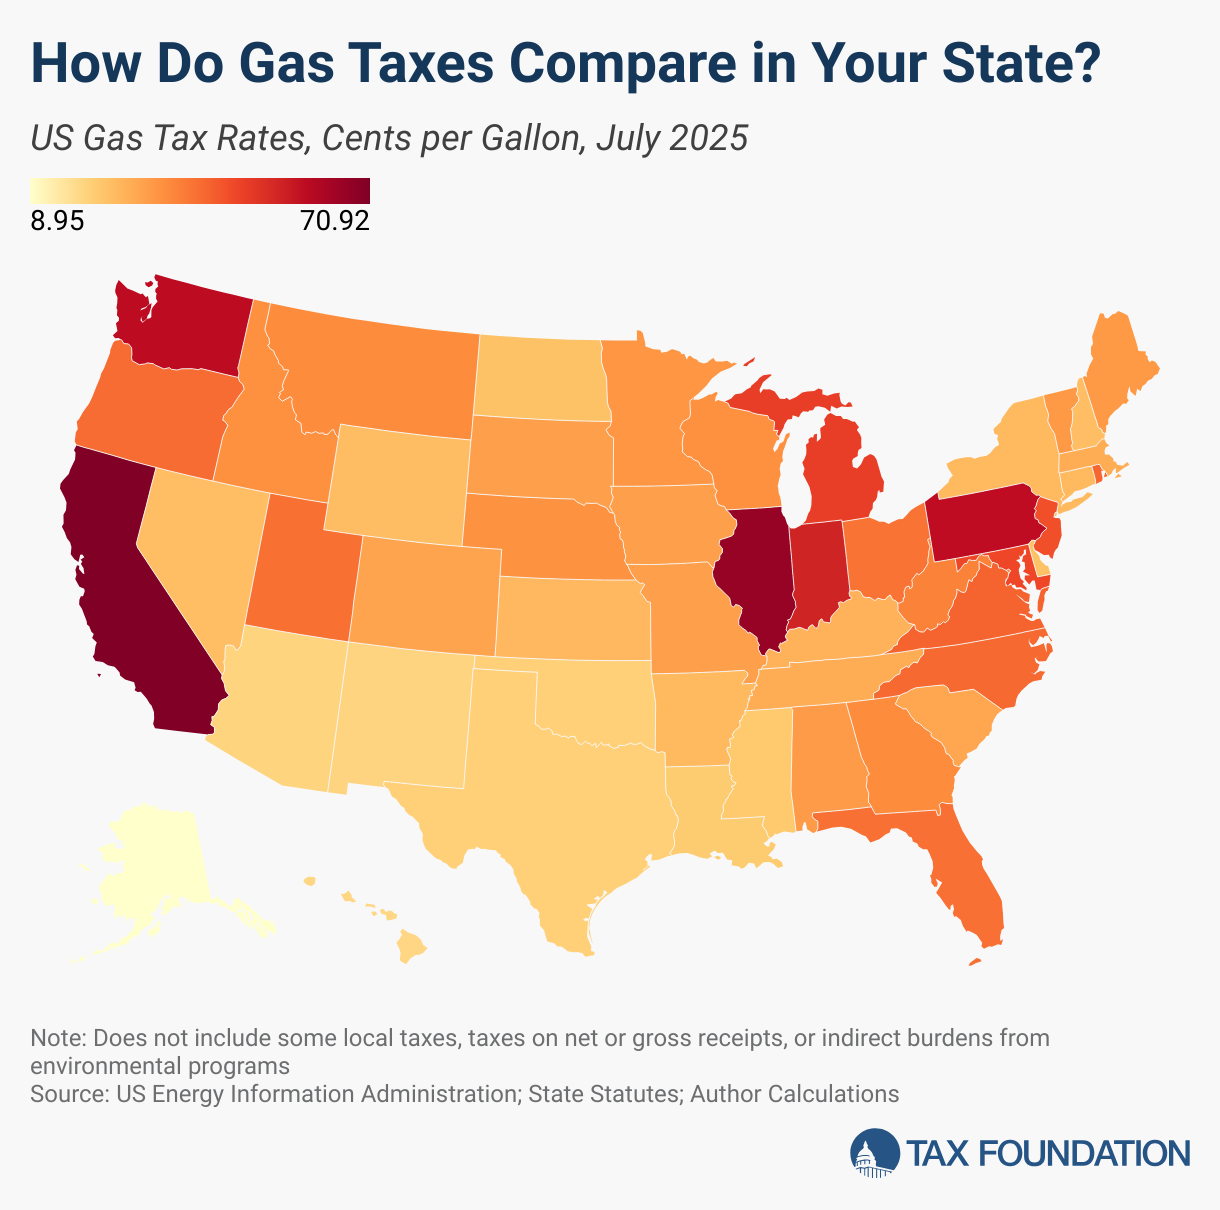
The District of Columbia (DC) has a graduated individual income tax, with rates ranging from 4.00 percent to 10.75 percent. The District of Columbia has an 8.25 percent corporate income tax rate, a 6.00 percent state sales tax rate, and an average combined state and local sales tax rate of 6.00 percent. The District of Columbia has a 0.60 percent effective property tax rate on owner-occupied housing value. The District of Columbia has an estate tax. DC’s gas tax is 35.7 cents per gallon, and its cigarette excise tax is $5.07 per pack of 20 cigarettes.

DC Tax Rankings, Debt, and Tax Revenue

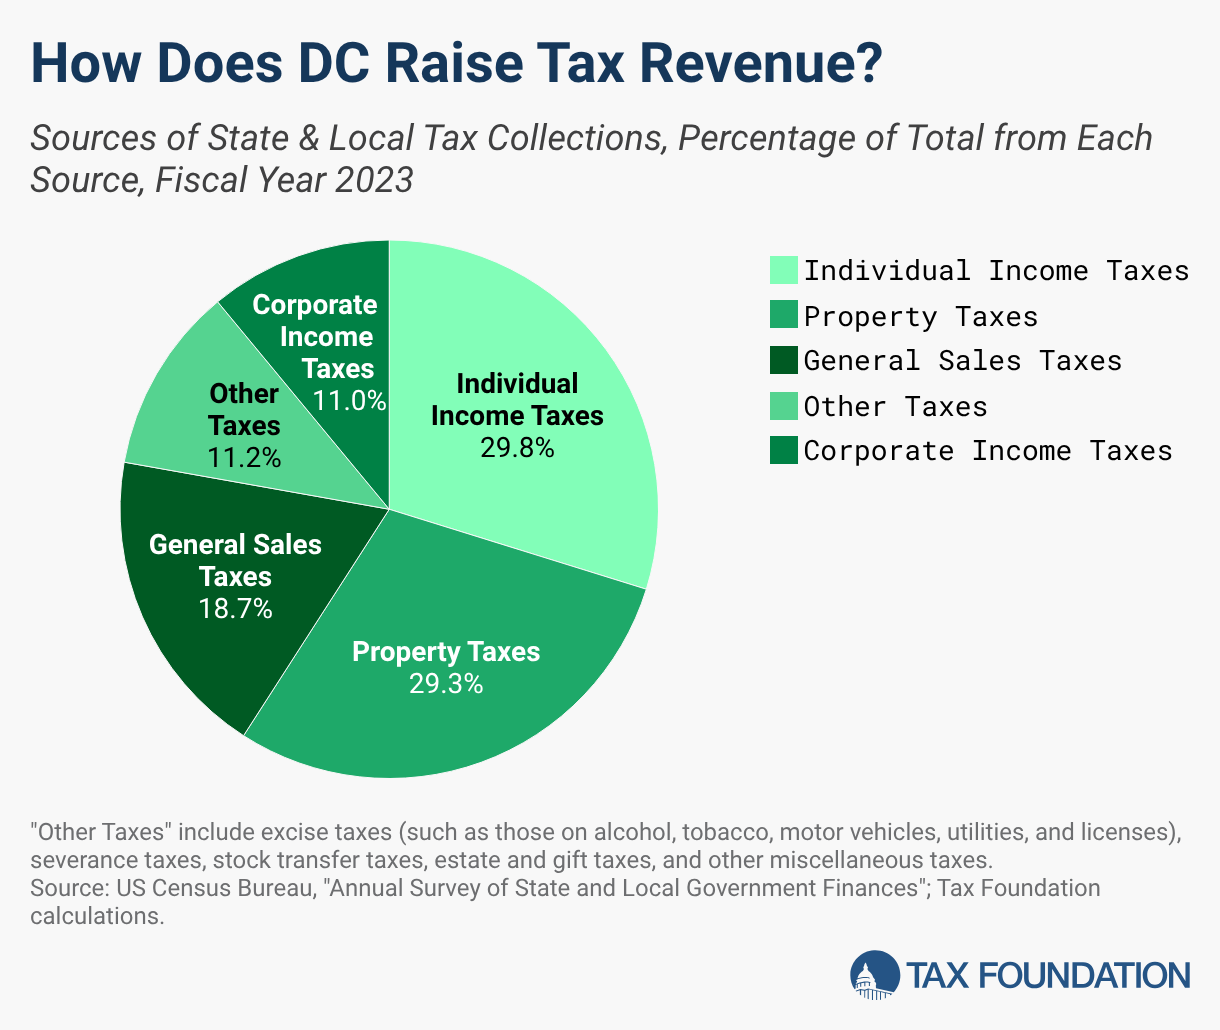
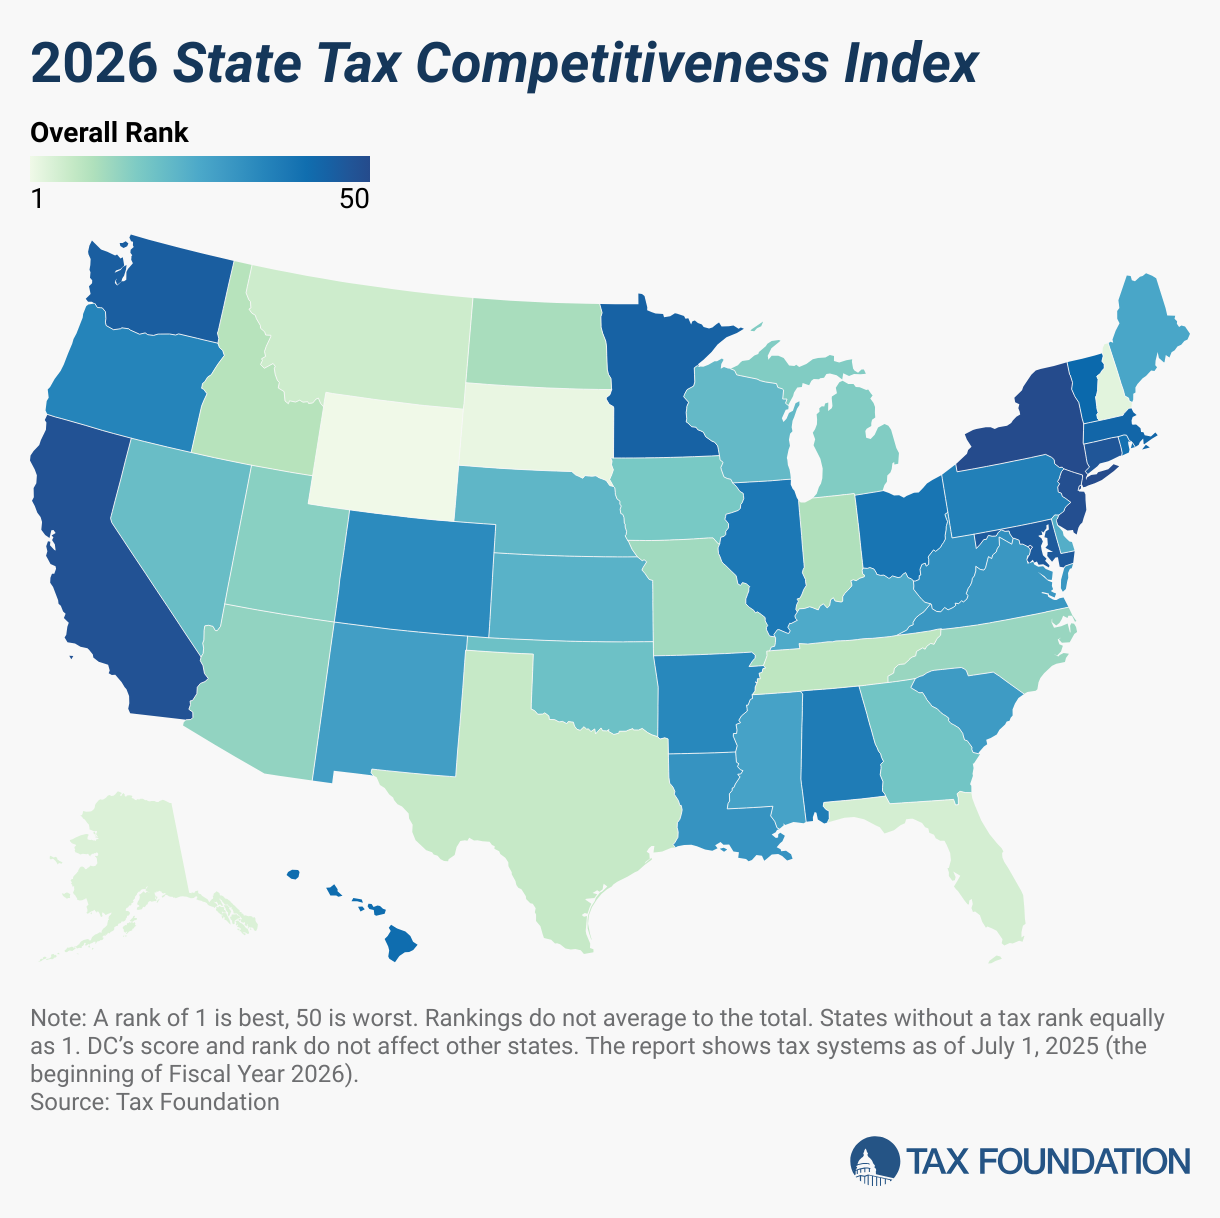
The District of Columbia raises tax revenue primarily through individual income taxes (29.8 percent of total state and local tax revenue), property taxes (29.3 percent), and general sales taxes (18.7 percent). The District of Columbia collects $15,009 in tax collections per capita, carries $32,166 in debt per capita, and has a 118 percent funded ratio of public pension plans. The District of Columbia’s tax system ranks 48th overall on the 2026 State Tax Competitiveness Index.

Understanding DC’s Tax System

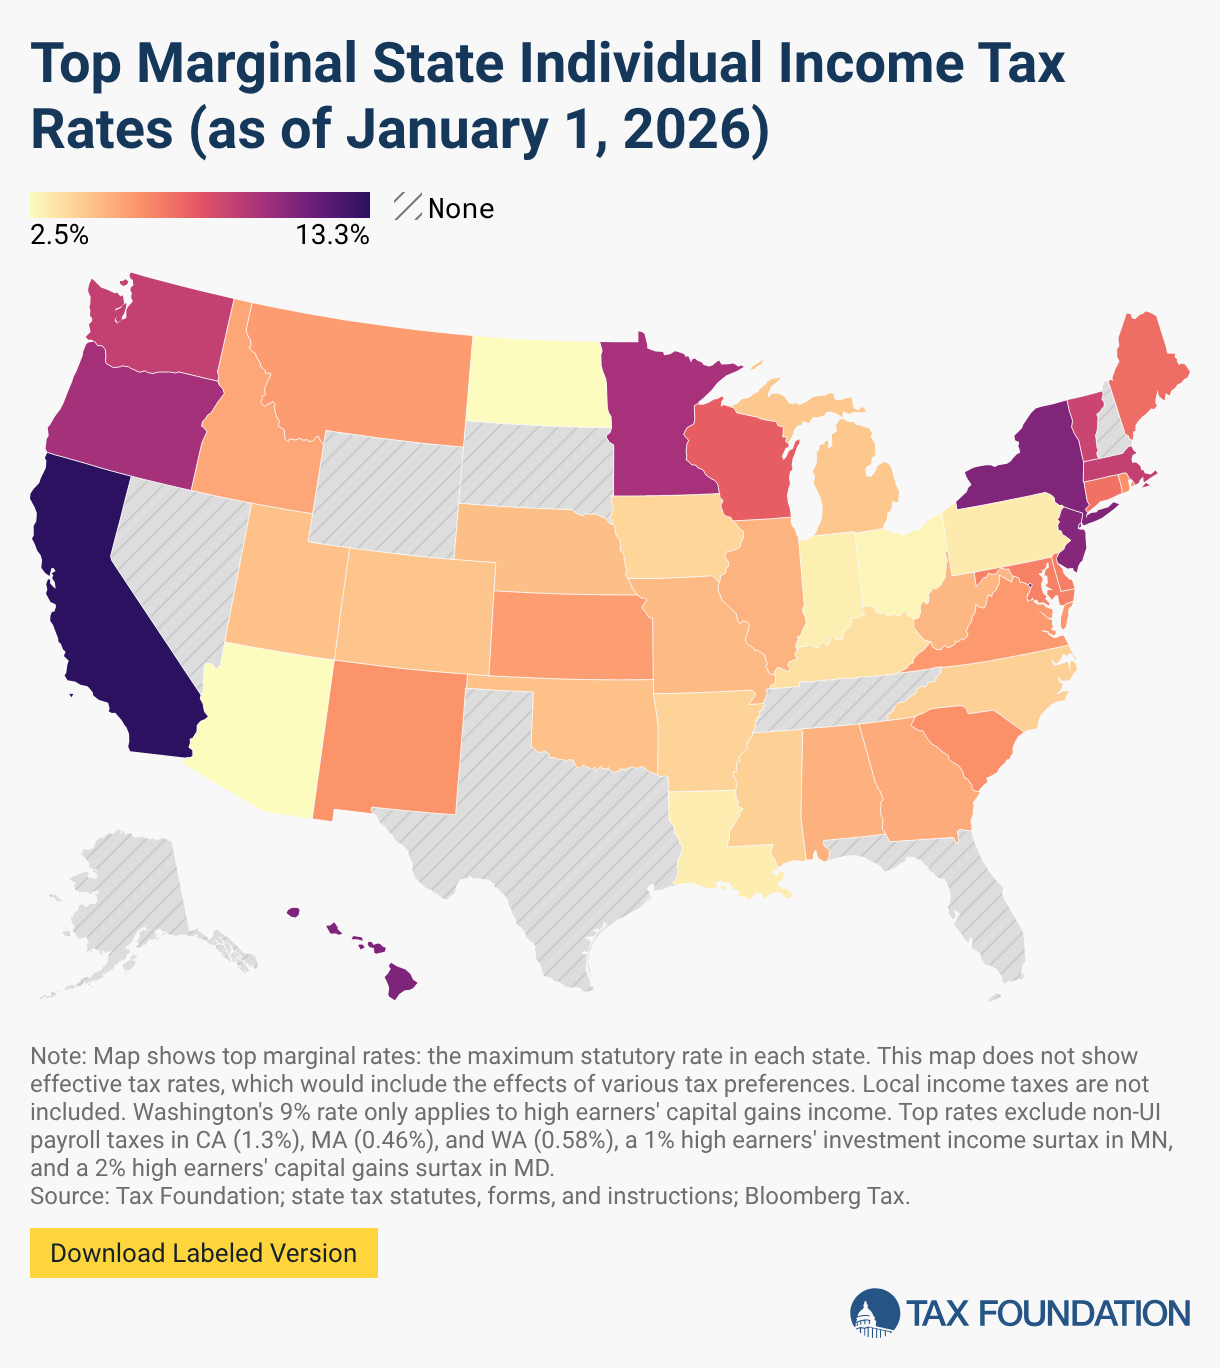
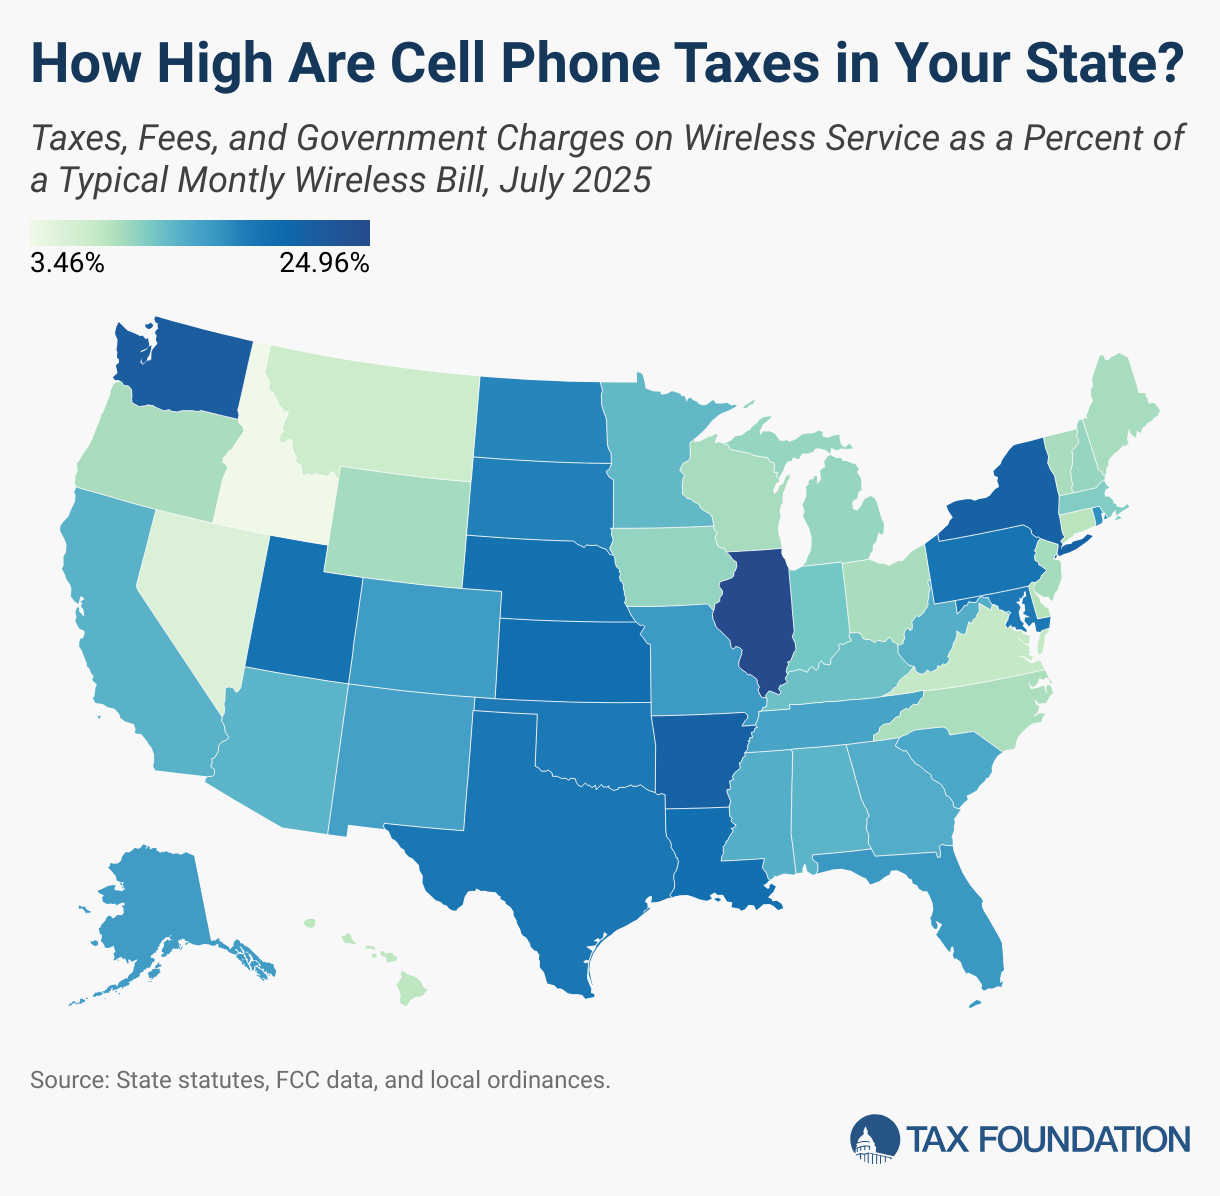
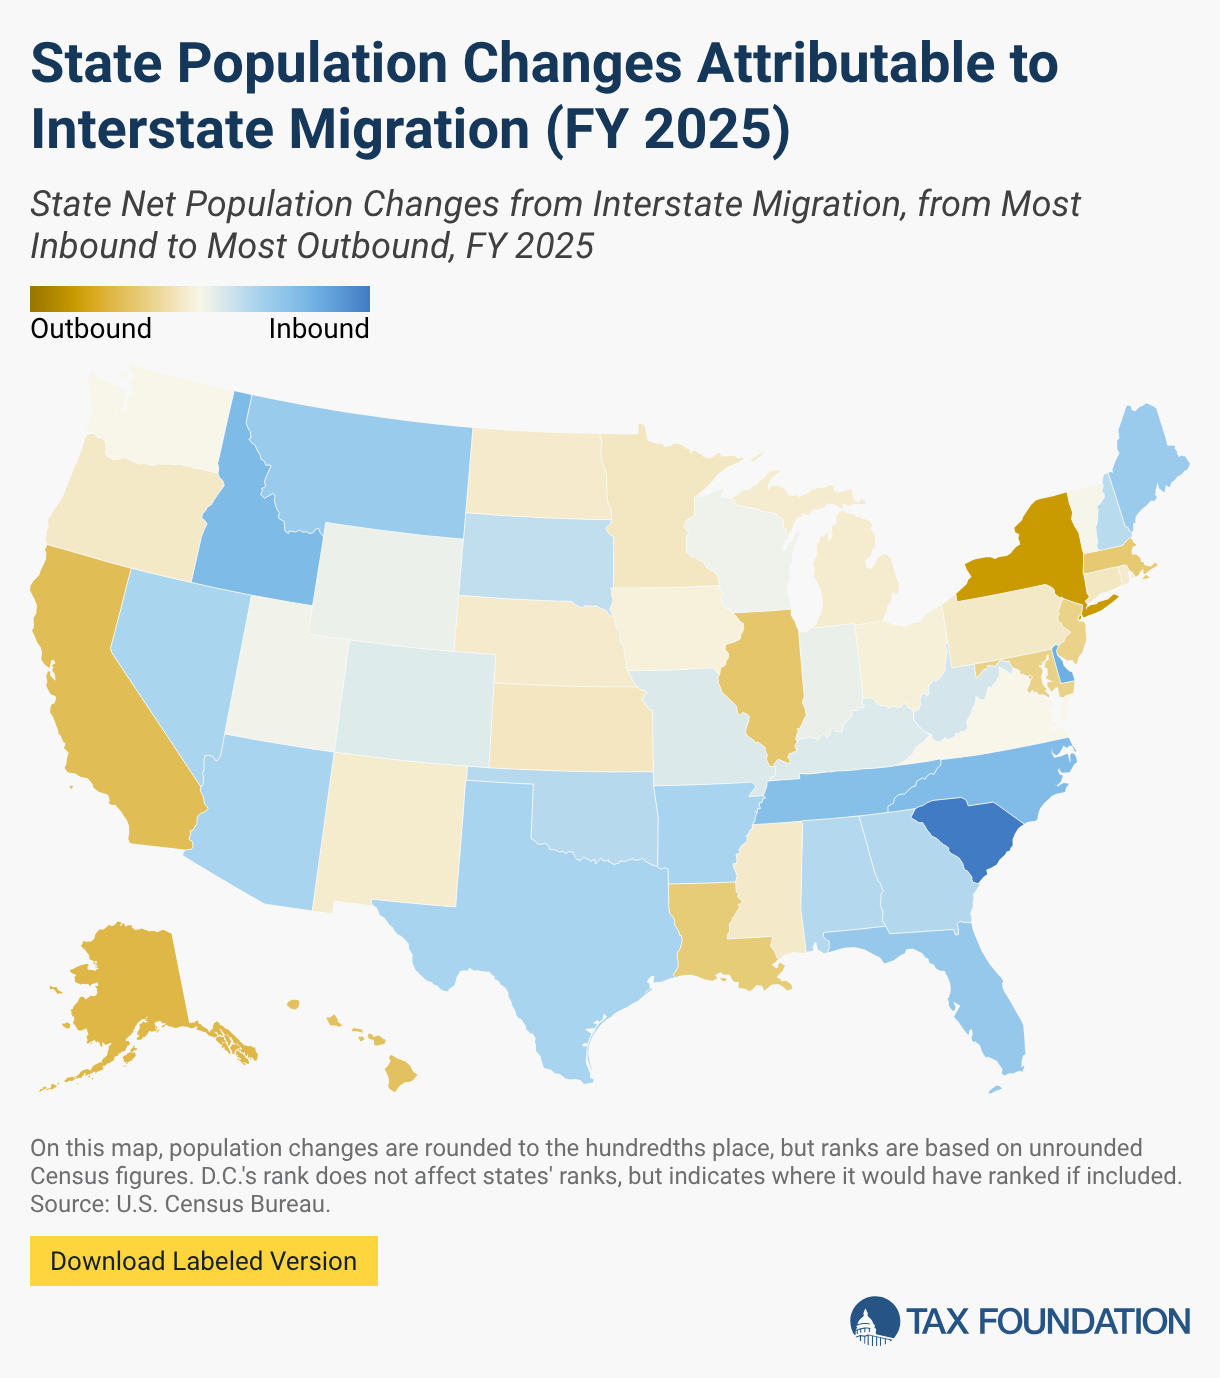
Each tax code is a multifaceted system with many moving parts, and the District of Columbia is no exception. Use the tabs below to compare DC taxes with other states and to see how the District of Columbia raises tax revenue. You can also browse our tax maps, which are compiled from our annual publication, Facts & Figures 2026: How Does Your State Compare?

See Related Articles

Tax Data by State

Get facts about taxes in your state and around the US

Explore Data

How Do Taxes in The District of Columbia Compare?

How Does The District of Columbia Collect Revenue?

How Does The District of Columbia's Tax System Rank?


All Related Articles

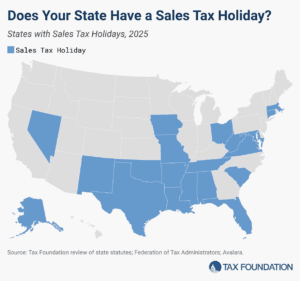
2025 sales tax holidays 2025 tax free weekends for back to school shopping by state

Sales Tax Holidays by State, 2025

However well-intended they may be, sales tax holidays remain the same as they always have been—ineffective and inefficient.

16 min read
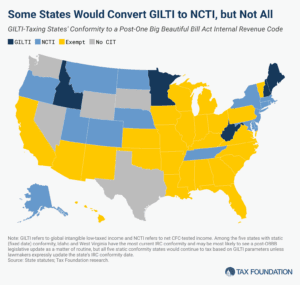
State Implications of the GILTI to NCTI Conversion The One, Big, Beautiful Bill’s (OBBB) changes to the taxation of international income

State Implications of the GILTI to NCTI Conversion

The One Big Beautiful Bill’s changes to the taxation of international income have surprising implications for state codes, yielding tax increases and a revised tax base that, through quirks of state incorporation, bears very little resemblance to the federal base and almost nothing of its purpose.

10 min read
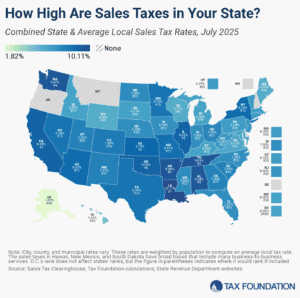
2025 midyear sales tax rates by state and local sales taxes as of midyear July 2025

State and Local Sales Tax Rates, Midyear 2025

The five states with the highest average combined state and local sales tax rates are Louisiana (10.11 percent), Tennessee (9.61 percent), Arkansas (9.48 percent), Washington (9.47 percent), and Alabama (9.44 percent).

10 min read
2025 State Tax Changes Taking Effect July 1 | Tax Foundation 2025 state tax changes in my state

State Tax Changes Taking Effect July 1, 2025

Summer has arrived, and states are beginning to implement policy changes that were enacted during this year’s legislative session (or that have delayed effective dates or are being phased in over time).

28 min read
State Implications of the One Big Beautiful Bill No Tax on Car Loan Interest SNAP Cost Sharing No Tax on Tips and Overtime Medicaid Reductions for States Covering Undocumented Immigrants

State Implications of the One, Big, Beautiful Bill

As the US House hashes out its “One, Big, Beautiful Bill,” statehouse lawmakers are watching closely, given the impact of both its tax and spending provisions on state budgets.

12 min read
2025 sales tax rates by state sales taxes

State and Local Sales Tax Rates, 2025

Retail sales taxes are an essential part of most states’ revenue toolkits, responsible for 32 percent of state tax collections and 13 percent of local tax collections (24 percent of combined collections).

9 min read