States compete with each other in a variety of ways, including in attracting (and retaining) residents. Sustained periods of inbound migration lead to (and reflect) greater economic output and growth. Prolonged periods of net outbound migration, however, can strain state coffers, contributing to revenue declines as economic activity and tax revenue follow individuals out of state.
United Van Lines, the largest moving company in the United States, keeps track of its clients’ migration among the 48 contiguous states. It publishes that data each January, comparing the number of inbound moves to outbound moves for each state. As those who use United Van Lines are individuals and companies using large moving trucks, this data is only a subset of all moves, but the National Movers Study still provides a targeted look at the types of interstate migration patterns we can expect to see in government-issued data once it becomes available.
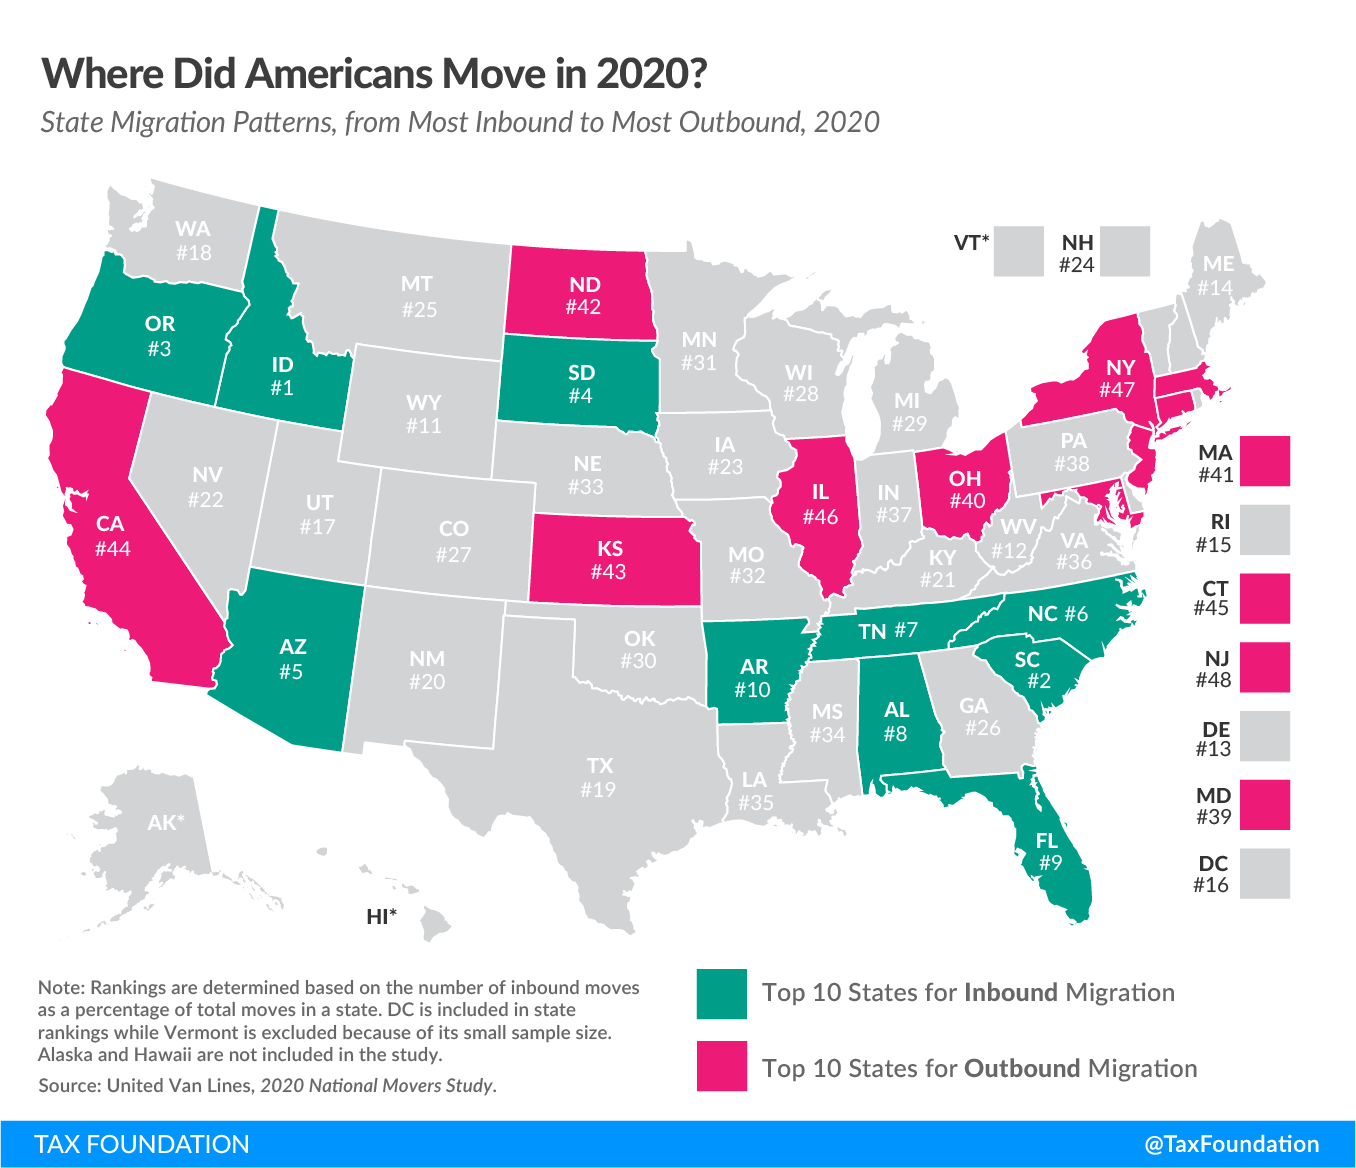
The 2020 National Movers Study shows Idaho, South Carolina, Oregon, South Dakota, and Arizona as the states with the highest proportion of inbound moves. New Jersey, New York, Illinois, Connecticut, and California saw the highest proportion of outbound migration. Inbound and outbound moves were nearly balanced in Colorado, Wisconsin, and Michigan. (Vermont also saw a high percentage of inbound moves, perhaps reflecting migration from New York, but it was excluded from the survey’s rankings because the sample size was too small.)
In this study, United Van Lines tracks a few of the most common reasons that people pack up and move to a new state. While “state taxA tax is a mandatory payment or charge collected by local, state, and national governments from individuals or businesses to cover the costs of general government services, goods, and activities. climate” is not a listed reason in this study, we can see glimpses of how taxes can affect decision-making.
Taxes may have limited influence on whether someone takes a job, but they can influence where jobs are available, and where a person taking a position might locate. The latter is perhaps most visible in smaller states and states with metropolitan centers located near state borders. For example, tens of thousands of individuals work in greater Chicago but live in Indiana, where many interstate commutes are attributable, at least in part, to stark differences in tax landscapes, particularly property taxes. While it is difficult to measure the extent to which tax considerations factor into individuals’ moving decisions, there is no doubt that taxes are important in many individuals’ personal financial deliberations. With the rise of remote work, moreover, individuals are likely to be more mobile than ever, able to make decisions about where to live that are independent of where their employer is located.
Another reason people moved was retirement.
| State | Rank |
|---|---|
| Delaware | 1 |
| Florida | 2 |
| South Carolina | 3 |
| Arizona | 4 |
| Wyoming | 5 |
| Idaho | 6 |
| New Mexico | 7 |
| Nevada | 8 |
| Maine | 9 |
| North Carolina | 10 |
|
Note: Source: United Van Lines, 2020 National Movers Study |
|
It’s unsurprising that retirees gravitated toward states with good climates, but many of these top states also have tax climates that would be attractive to retirees. Nine out of these 10 states either exempt a large portion of Social Security from income taxes, exempt Social Security completely, or have no income tax at all. Retirees, moreover, are freer to consider factors like taxation than those who are tied to a job.
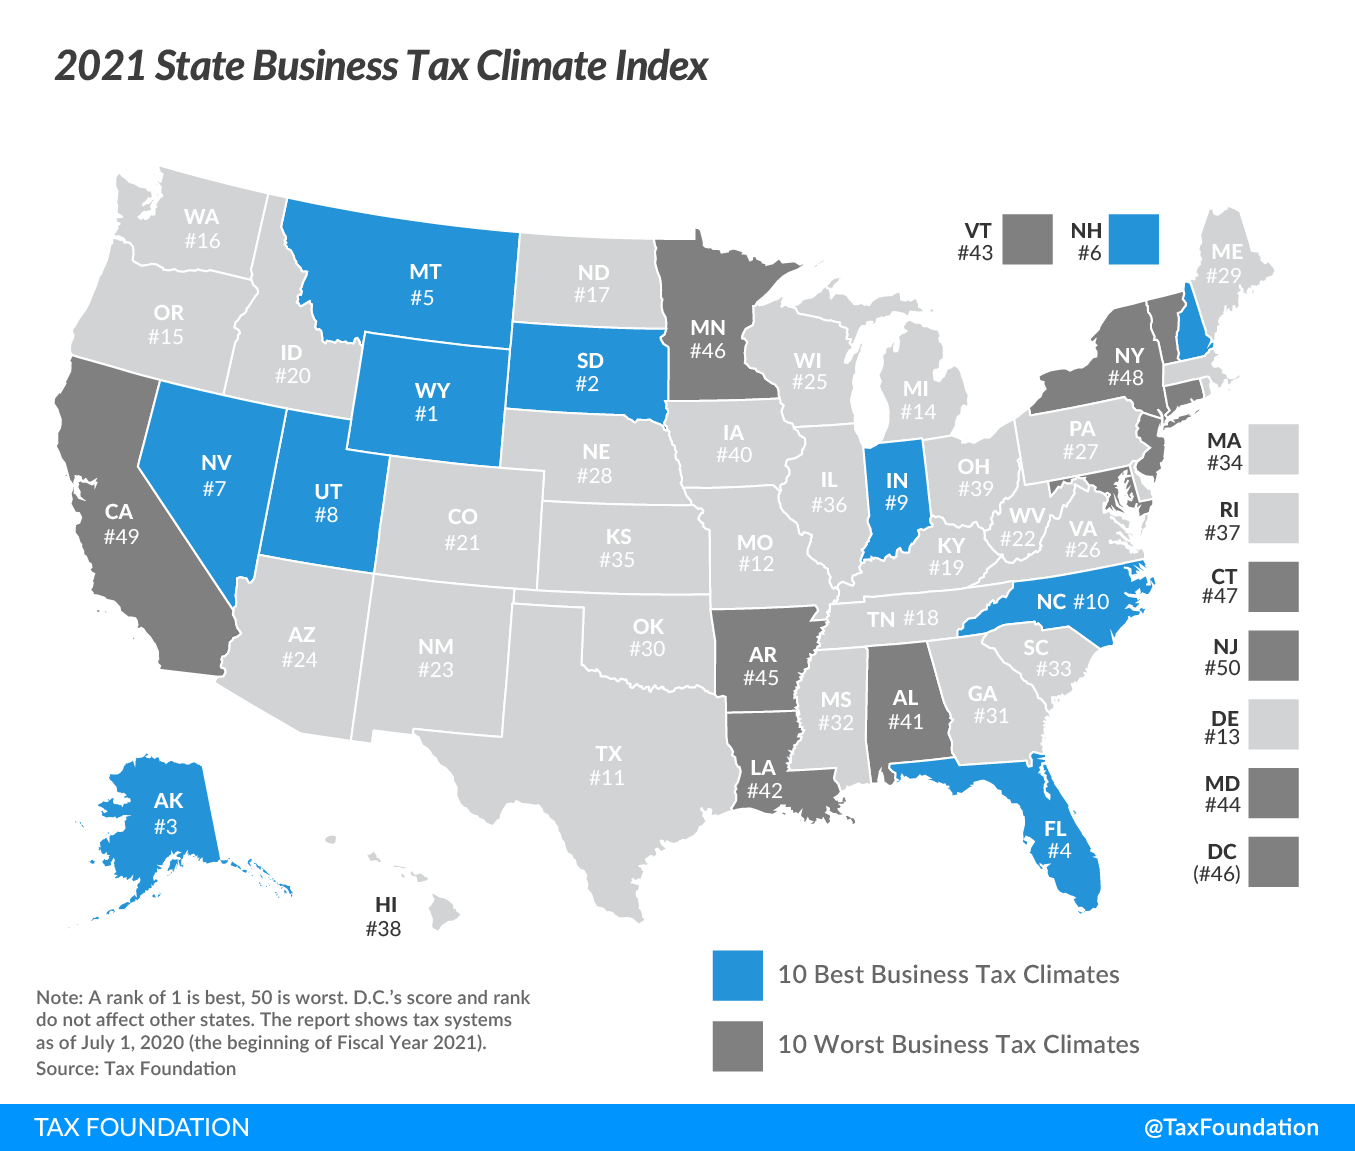
Our State Business Tax Climate Index uses over 100 variables to evaluate states on the competitiveness of their tax rates and structures. Four of the 10 worst-performing states on this year’s Index are also among the 10 states with the most outbound migration in this year’s National Movers Study (New Jersey, New York, Connecticut, and California). Seven of the top 10 ranked inbound migration states also rank in the top half of states on the Index, which measures tax structure. And the three which do not (Alabama, Arkansas, and South Carolina), while having significant room for improvement in the structure of their tax codes, generally feature low tax burdens. Conversely, all but one of the top outbound states rank in the bottom third of the Index, the only exception being North Dakota (17th), where outbound migration has been driven by a decline in energy markets.
While certain factors are outside a state’s control (sunny Florida may always have a certain competitive advantage in attracting retirees, for example), every state can foster an attractive economic landscape through wise tax policy decisions.
For more information on how your state measures up in terms of tax competitiveness, check out our interactive map or read the full State Business Tax Climate Index here.
Stay informed on the tax policies impacting you.
Subscribe to get insights from our trusted experts delivered straight to your inbox.
Subscribe
