Download Fiscal Fact No. 362: The High Burden of State and Federal Capital Gains Taxes
An Updated Version of this Study can be Found Here.
Introduction
As Congress begins to debate tax reform in the coming months, there is one taxA tax is a mandatory payment or charge collected by local, state, and national governments from individuals or businesses to cover the costs of general government services, goods, and activities. that they should pay close attention to: the capital gains tax. The capital gains taxA capital gains tax is levied on the profit made from selling an asset and is often in addition to corporate income taxes, frequently resulting in double taxation. These taxes create a bias against saving, leading to a lower level of national income by encouraging present consumption over investment. is a tax on profit through the sale of property or investments. At the beginning of this year, the top marginal statutory capital gains tax rate was increased to 23.8 percent from 15 percent. Although lower than the tax on ordinary income, states also tax capital gains, some of them as high as 13.3 percent, adding an additional tax burden to savers and investors. Some taxpayers could pay up to a 33 percent tax on capital gains, a rate that far exceeds rates throughout the world. This high tax rate has long-term negative implications for the economy as people save and invest less and capital seeks higher returns in other countries. Lawmakers should consider the negative economic impacts of such a high tax on investment and look to lower it in any tax reform package.
How the States Compare
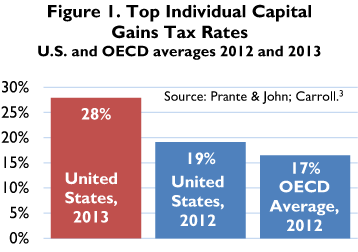 On January 1, the Senate passed H.R. 8, the American Taxpayer Relief Act of 2012. Among a number of major changes to the tax code in 2013, America’s top marginal statutory tax rate for capital gains increased from 15 percent to 20 percent, plus a 3.8 percent surtaxA surtax is an additional tax levied on top of an already existing business or individual tax and can have a flat or progressive rate structure. Surtaxes are typically enacted to fund a specific program or initiative, whereas revenue from broader-based taxes, like the individual income tax, typically cover a multitude of programs and services.
for the Affordable Care Act.[1] This increased the U.S. average rate (average of state capital gains tax rates + federal rate) to 27.9 percent from 19.1 percent,[2] a rate that far exceeds the Organization for Economic Cooperation and Development (OECD) average of 16.4 percent. (See Figure 1.)
On January 1, the Senate passed H.R. 8, the American Taxpayer Relief Act of 2012. Among a number of major changes to the tax code in 2013, America’s top marginal statutory tax rate for capital gains increased from 15 percent to 20 percent, plus a 3.8 percent surtaxA surtax is an additional tax levied on top of an already existing business or individual tax and can have a flat or progressive rate structure. Surtaxes are typically enacted to fund a specific program or initiative, whereas revenue from broader-based taxes, like the individual income tax, typically cover a multitude of programs and services.
for the Affordable Care Act.[1] This increased the U.S. average rate (average of state capital gains tax rates + federal rate) to 27.9 percent from 19.1 percent,[2] a rate that far exceeds the Organization for Economic Cooperation and Development (OECD) average of 16.4 percent. (See Figure 1.)
However, this average rate hides the variability of capital gains rates within the U.S. State capital gains tax rates range from 0 percent, in states such as Florida, Texas, South Dakota, and Wyoming, to as high as 13.3 percent in California. [4] (See Table 1, below.)
An individual who has capital gains income is subject to both federal and state-level capital gains rates. Taking into account the state deductibility of federal taxes and the phase out of personal exemptions for high income earners, one can calculate the specific rates that taxpayers will pay for tax year 2013 for capital gains.[5] (See Table 1, below.)
Compared to individual countries in the OECD, seven of ten of the top capital gains rates are U.S. states. (See Table 2, below.) California, with a top rate of 33 percent, is the second highest capital gains tax rate in the world, a rate higher than France, Finland, and Sweden.[6] Eleven OECD countries have no capital gains tax at all.
Since the fiscal cliff deal, capital gains tax rates have risen substantially. Taxpayers in every state are subject to a top capital gains tax rate higher than the OECD average. American lawmakers should recognize the combined burden of both state and federal capital gains taxes and the drag that they create on the economy. There are several reasons high capital gains taxes are problematic in terms of economic growth and fairness.
Capital Gains Tax is One Tax of Many on the Same Dollar
Capital gains taxes represent an additional tax on a dollar of income that has already been taxed multiple times. For example, take an individual who earns a wage and decides to save by purchasing stock. First, when he earns his wage, it is taxed once by the federal and state individual income taxAn individual income tax (or personal income tax) is levied on the wages, salaries, investments, or other forms of income an individual or household earns. The U.S. imposes a progressive income tax where rates increase with income. The Federal Income Tax was established in 1913 with the ratification of the 16th Amendment. Though barely 100 years old, individual income taxes are the largest source of tax revenue in the U.S. . He then purchases stock and lets his investment grow. However, that growth is smaller than it otherwise would have been due to the corporate income taxA corporate income tax (CIT) is levied by federal and state governments on business profits. Many companies are not subject to the CIT because they are taxed as pass-through businesses, with income reportable under the individual income tax. on the profits of the corporation in which he invested.[7] After ten years, he decides to sell the stock and realize his capital gains. At this point the gains (the difference between the value of the stock at purchase and the value at sale) are taxed once more by the capital gains tax. Even more, the effective capital gains tax rate could be even higher on your gains due to the fact that a significant difference in the value of the stock is due to inflationInflation is when the general price of goods and services increases across the economy, reducing the purchasing power of a currency and the value of certain assets. The same paycheck covers less goods, services, and bills. It is sometimes referred to as a “hidden tax,” as it leaves taxpayers less well-off due to higher costs and “bracket creep,” while increasing the government’s spending power. , not real gains.[8]
Creates a Bias Against Saving
These multiple layers of taxation encourage present consumption over savings. Suppose someone makes $1000 and it is first taxed at 20 percent through the income tax. This person now has a choice. He can either spend it all today or save it in stocks or bonds and spend it later. If he spends it today and buys a television, he would pay a state or local sales tax. However, if he decides to save it, delaying consumption, he is subject to the multiple layers of taxation discussed previously plus the sales taxA sales tax is levied on retail sales of goods and services and, ideally, should apply to all final consumption with few exemptions. Many governments exempt goods like groceries; base broadening, such as including groceries, could keep rates lower. A sales tax should exempt business-to-business transactions which, when taxed, cause tax pyramiding. when he eventually purchases the television. As an individual, to avoid the multiple layers of taxation on the same dollar, it makes more sense to spend it all now rather than spend it later and pay multiple taxes.
Slows Economic Growth
As people prefer consumption today due to the tax bias against savings, there will be less available capital in the future. For investors, this represents less available capital for factories, machines, and other investment opportunities. Additionally, the capital gains taxes create a lock-in effect that reduces the mobility of capital.[9] People are less willing to realize capital gains from one investment in order to move to another when they face a tax on their returns. Funds will be slower to move to better investments, further slowing economic growth.
Harms U.S. Competitiveness, Raises the Cost of Capital
Relatively high capital gains taxes also harm the competitiveness of U.S. corporations by raising the cost of capital. As corporations seek higher returns, corporate investment will move to countries that have lower capital gains tax rates.[10] Following the reduction of capital gains tax rates in the U.S. in the late 1970s from 35 percent to 20 percent, the ability of firms to raise funds through equity offerings greatly increased. As a result, the daily volume of the New York Stock Exchange increased from 28.6 million shares to 85 million shares in five years.[11] Higher rates will also slow down the productivity of businesses as there is less investment in new machinery and software. Having a relatively high capital gains tax rate compared to the rest of world is a clear drag on the competitiveness of U.S. businesses.
Lowering the Rate Will Not Necessarily Harm Federal Revenues
In 2009, revenue from capital gains was $37 billion, which is nearly a 20-year low.[12] Many claim that if the government were to lower the rate further, tax revenue would fall even farther. However, history has shown that this is not necessarily true. In fact, revenue collected from realized capital gains increases in years following a drop in the tax rates. (See Figure 2.) Even more, the CBO, in a review of the literature, found  that capital gains realizations are extremely sensitive to tax rates and raising rates wouldn’t necessarily result in additional revenue.[13] What seems to be more important to capital gains revenue is economic growth.
Conclusion
As Congress begins debating tax reform, members need to take a serious look at the U.S. capital gains tax rate. There is not much lawmakers in Washington can do about state tax policy, but they can be mindful of the combined effects of state and federal policies. With an average rate of 27.9 percent and a top rate of 33 percent in California, investment in the U.S. is at a severe competitive disadvantage. Investors could easily start looking for higher rates of return in other countries with much lower tax rates or simply choose to reduce domestic investment and instead consume more. The United States risks losing its competitive edge as other countries continue to reform their tax systems to attract businesses and promote economic growth. Policy makers here in Washington need to recognize that a high tax burden on capital gains harms growth and prosperity. Most of the world’s leaders have and as a consequence the United States is falling farther behind.
Table 1. Effective Long-term State and Combined Top Marginal Capital Gains Rate by State |
|||
|
Rank |
State |
Long-term State Capital Gains Rate, 2013 |
Combined State and Federal Long-term Capital Gains Rate, 2013 |
|
1 |
California |
13.3% |
33.0% |
|
2 |
New York |
8.8% |
31.4% |
|
3 |
Oregon |
9.9% |
31.0% |
|
4 |
New Jersey |
9.0% |
30.4% |
|
5 |
Vermont |
9.0% |
30.4% |
|
6 |
District of Columbia |
9.0% |
30.4% |
|
7 |
Maryland |
5.8% |
30.3% |
|
8 |
Maine |
8.5% |
30.1% |
|
9 |
Minnesota |
7.9% |
29.7% |
|
10 |
North Carolina |
7.8% |
29.7% |
|
11 |
Iowa |
9.0% |
29.6% |
|
12 |
Idaho |
7.4% |
29.5% |
|
13 |
Hawaii |
7.3% |
29.4% |
|
14 |
Delaware |
6.8% |
29.1% |
|
15 |
Nebraska |
6.8% |
29.1% |
|
16 |
Connecticut |
6.7% |
29.0% |
|
17 |
West Virginia |
6.5% |
28.9% |
|
18 |
Ohio |
5.9% |
28.7% |
|
19 |
Georgia |
6.0% |
28.6% |
|
20 |
Kentucky |
6.0% |
28.6% |
|
21 |
Missouri |
6.0% |
28.6% |
|
22 |
Rhode Island |
6.0% |
28.6% |
|
23 |
Virginia |
5.8% |
28.5% |
|
24 |
Wisconsin |
5.4% |
28.3% |
|
25 |
Massachusetts |
5.3% |
28.2% |
|
26 |
Oklahoma |
5.3% |
28.2% |
|
27 |
Illinois |
5.0% |
28.0% |
|
28 |
Mississippi |
5.0% |
28.0% |
|
29 |
Utah |
5.0% |
28.0% |
|
30 |
Arkansas |
4.9% |
27.9% |
|
31 |
Kansas |
4.9% |
27.9% |
|
32 |
Louisiana |
6.0% |
27.9% |
|
33 |
Montana |
4.9% |
27.9% |
|
34 |
Colorado |
4.6% |
27.8% |
|
35 |
Indiana |
3.4% |
27.8% |
|
36 |
Arizona |
4.5% |
27.7% |
|
37 |
Michigan |
4.3% |
27.7% |
|
38 |
Alabama |
5.0% |
27.4% |
|
39 |
South Carolina |
3.9% |
27.4% |
|
40 |
Pennsylvania |
3.1% |
26.8% |
|
41 |
North Dakota |
2.8% |
26.7% |
|
42 |
New Mexico |
2.5% |
26.5% |
|
43 |
Alaska |
0.0% |
23.8% |
|
44 |
Florida |
0.0% |
23.8% |
|
45 |
Nevada |
0.0% |
23.8% |
|
46 |
New Hampshire |
0.0% |
23.8% |
|
47 |
South Dakota |
0.0% |
23.8% |
|
48 |
Tennessee |
0.0% |
23.8% |
|
49 |
Texas |
0.0% |
23.8% |
|
50 |
Washington |
0.0% |
23.8% |
|
51 |
Wyoming |
0.0% |
23.8% |
|
U.S. Average |
5.1% |
27.9% |
Table 2. Effective Long-term State and Capital Gains Rate by State and OECD Country, 2013 |
||
|
Rank |
Country/State |
Combined Federal and State Long-term Capital Gains Rate, U.S. States and OECD (Simple Averages), 2013 |
|
1 |
Denmark |
42.0% |
|
2 |
California |
33.0% |
|
3 |
France |
32.5% |
|
4 |
Finland |
32.0% |
|
5 |
New York |
31.4% |
|
6 |
Oregon |
31.0% |
|
7 |
Delaware |
30.4% |
|
8 |
New Jersey |
30.4% |
|
9 |
Vermont |
30.4% |
|
10 |
Maryland |
30.3% |
|
11 |
Maine |
30.1% |
|
12 |
Ireland |
30.0% |
|
13 |
Sweden |
30.0% |
|
14 |
Idaho |
29.7% |
|
15 |
Minnesota |
29.7% |
|
16 |
North Carolina |
29.7% |
|
17 |
Iowa |
29.6% |
|
18 |
Hawaii |
29.4% |
|
19 |
District of Columbia |
29.1% |
|
20 |
Nebraska |
29.1% |
|
21 |
Connecticut |
29.0% |
|
22 |
West Virginia |
28.9% |
|
23 |
Ohio |
28.7% |
|
24 |
Georgia |
28.6% |
|
25 |
Kentucky |
28.6% |
|
26 |
Missouri |
28.6% |
|
27 |
Rhode Island |
28.6% |
|
28 |
Virginia |
28.5% |
|
29 |
Wisconsin |
28.3% |
|
30 |
Massachusetts |
28.2% |
|
31 |
Oklahoma |
28.2% |
|
32 |
Illinois |
28.0% |
|
33 |
Mississippi |
28.0% |
|
34 |
Norway |
28.0% |
|
35 |
United Kingdom |
28.0% |
|
36 |
Utah |
28.0% |
|
37 |
U.S. Average |
27.9% |
|
38 |
Arkansas |
27.9% |
|
39 |
Kansas |
27.9% |
|
40 |
Louisiana |
27.9% |
|
41 |
Montana |
27.9% |
|
42 |
Colorado |
27.8% |
|
43 |
Indiana |
27.8% |
|
44 |
Arizona |
27.7% |
|
45 |
Michigan |
27.7% |
|
46 |
Alabama |
27.4% |
|
47 |
South Carolina |
27.4% |
|
48 |
Spain |
27.0% |
|
49 |
Pennsylvania |
26.8% |
|
50 |
North Dakota |
26.7% |
|
51 |
New Mexico |
26.5% |
|
52 |
Austria |
25.0% |
|
53 |
Germany |
25.0% |
|
54 |
Israel |
25.0% |
|
55 |
Portugal |
25.0% |
|
56 |
Alaska |
23.8% |
|
57 |
Florida |
23.8% |
|
58 |
Nevada |
23.8% |
|
59 |
New Hampshire |
23.8% |
|
60 |
South Dakota |
23.8% |
|
61 |
Tennessee |
23.8% |
|
62 |
Texas |
23.8% |
|
63 |
Washington |
23.8% |
|
64 |
Wyoming |
23.8% |
|
65 |
Australia |
22.5% |
|
66 |
Canada |
22.5% |
|
67 |
Estonia |
21.0% |
|
68 |
Iceland |
20.0% |
|
69 |
Italy |
20.0% |
|
70 |
Poland |
19.0% |
|
71 |
Slovak Republic |
19.0% |
|
72 |
Chile |
18.5% |
|
73 |
OECD Average |
16.4% |
|
74 |
Hungary |
16.0% |
|
75 |
Japan |
10.0% |
|
76 |
Belgium |
0.0% |
|
77 |
Czech Republic |
0.0% |
|
78 |
Greece |
0.0% |
|
79 |
Korea |
0.0% |
|
80 |
Luxembourg |
0.0% |
|
81 |
Mexico |
0.0% |
|
82 |
Netherlands |
0.0% |
|
83 |
New Zealand |
0.0% |
|
84 |
Slovenia |
0.0% |
|
85 |
Switzerland |
0.0% |
|
86 |
Turkey |
0.0% |
[1] Joseph Henchman, Details of the Fiscal Cliff Deal, Tax Foundation Tax Policy Blog, Jan. 1, 2013, https://taxfoundation.org/blog/details-fiscal-cliff-tax-deal.
[2] Gerald Prante & Austin John, Top Marginal Effective Tax Rates by State and by Source of Income, 2012 Tax Law vs. 2013 Scheduled Tax Law (as enacted in ATRA) (Feb. 2013), http://papers.ssrn.com/sol3/papers.cfm?abstract_id=2176526.
[3] Id. See also Ernst & Young, Robert Carroll, et al., Corporate Dividend and Capital Gains Taxation: A Comparison of Sweden to Other Member Nations of the OECD and EU, and BRIC Countries (Oct. 2012), http://www.svensktnaringsliv.se/multimedia/archive/00033/Corporate_Dividend_a_33823a.pdf.
[4] Prante & John, supra note 2.
[5] Id.
[6] Carroll, et al., supra note 3.
[7] For an explanation of “integrated tax rates on capital gains,” see Robert Carroll & Gerald Prante, Corporate Dividend and Capital Gains Taxation: A comparison of the United States to other developed nations, Ernst & Young LLP (Feb. 2012), http://images.politico.com/global/2012/02/120208_asidividend.html.
[8] Arthur P. Hall, Issues in the Indexation of Capital Gains, Tax Foundation Special Report No. 47 (Apr. 1995), https://files.taxfoundation.org/docs/dafa29992e4cfa82276853f47607c84d.pdf.
[9] Bruce Bartlett, The Case for Ending the Capital Gains Tax, 41 Financial Analysts Journal 22-30 (June-July 1985).
[10] Chris Edwards, Advantages of Low Capital Gains Tax Rates, Tax & Budget Bulletin (Dec. 2012), http://www.cato.org/publications/tax-budget-bulletin/advantages-low-capital-gains-tax-rates.
[11] See Bartlett, supra note 8.
[12] U.S. Department of the Treasury, Capital Gains and Taxes Paid on Capital Gains for Returns with Positive Net Capital Gains, 1954-2009, http://www.treasury.gov/resource-center/tax-policy/Documents/OTP-CG-Taxes-Paid-Pos-CG-1954-2009-6-2012.pdf.
[13] Tim Dowd, Robert McClelland, & Antiphat Muthitacharoen, New Evidence on the Tax Elasticity of Capital Gains, Joint Working Paper of the Staff of the Joint Committee on Taxation and the Congressional Budget Office (June 2012), http://www.cbo.gov/sites/default/files/cbofiles/attachments/43334-TaxElasticityCapGains.pdf.
Share this article