Key Findings
- Average wage earners in the OECD have their take-home pay lowered by three major taxes: the individual income taxAn individual income tax (or personal income tax) is levied on the wages, salaries, investments, or other forms of income an individual or household earns. The U.S. imposes a progressive income tax where rates increase with income. The Federal Income Tax was established in 1913 with the ratification of the 16th Amendment. Though barely 100 years old, individual income taxes are the largest source of tax revenue in the U.S. , the payroll taxA payroll tax is a tax paid on the wages and salaries of employees to finance social insurance programs like Social Security, Medicare, and unemployment insurance. Payroll taxes are social insurance taxes that comprise 24.8 percent of combined federal, state, and local government revenue, the second largest source of that combined tax revenue. (both the employee and employer side), and the value-added taxA tax is a mandatory payment or charge collected by local, state, and national governments from individuals or businesses to cover the costs of general government services, goods, and activities. (VAT).
- Although about half of the legal incidence of payroll taxes falls on employers, employees ultimately bear the burden through lower take-home pay.
- Before accounting for state and local sales taxes, the tax burden that a single average wage earner faces in the U.S. is 31.7 percent of pretax earnings, amounting to $18,198 in taxes in 2017.
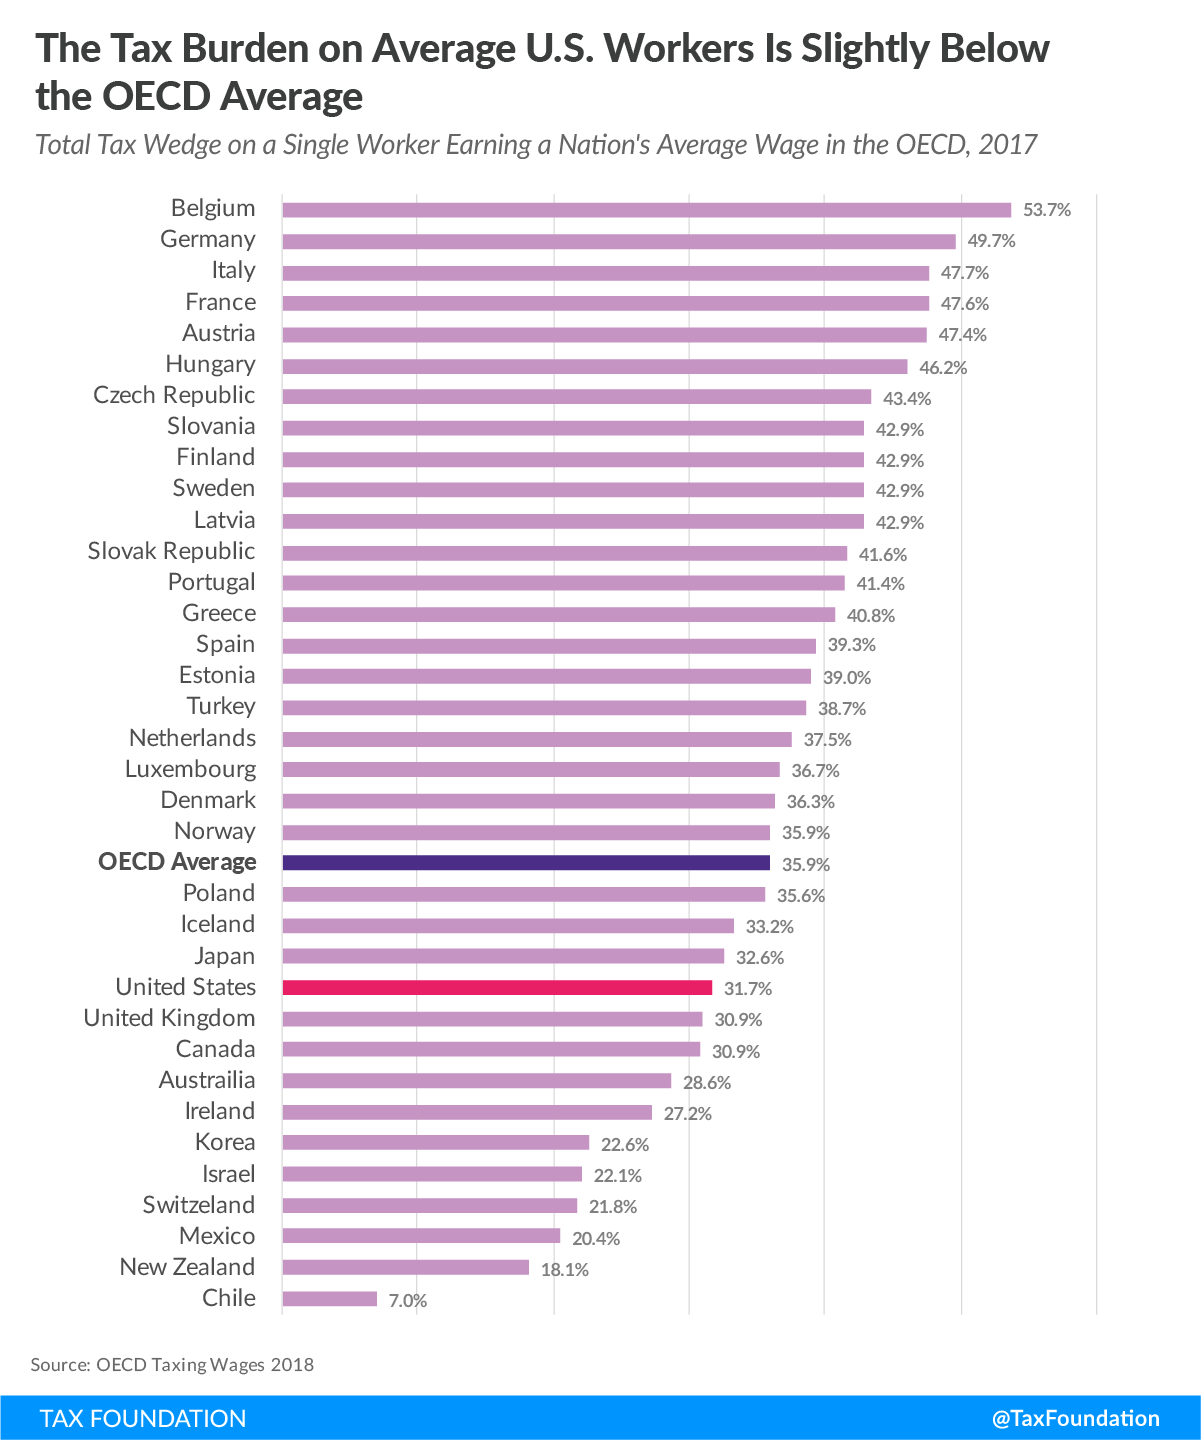
- The tax burden from income and payroll taxes faced by average U.S. workers was the 11th lowest in the OECD, below the 35-country average of 36 percent.
- The tax burden from income and payroll taxes that families in OECD countries face is 9.8 percentage points lower on average than that of single, childless taxpayers.
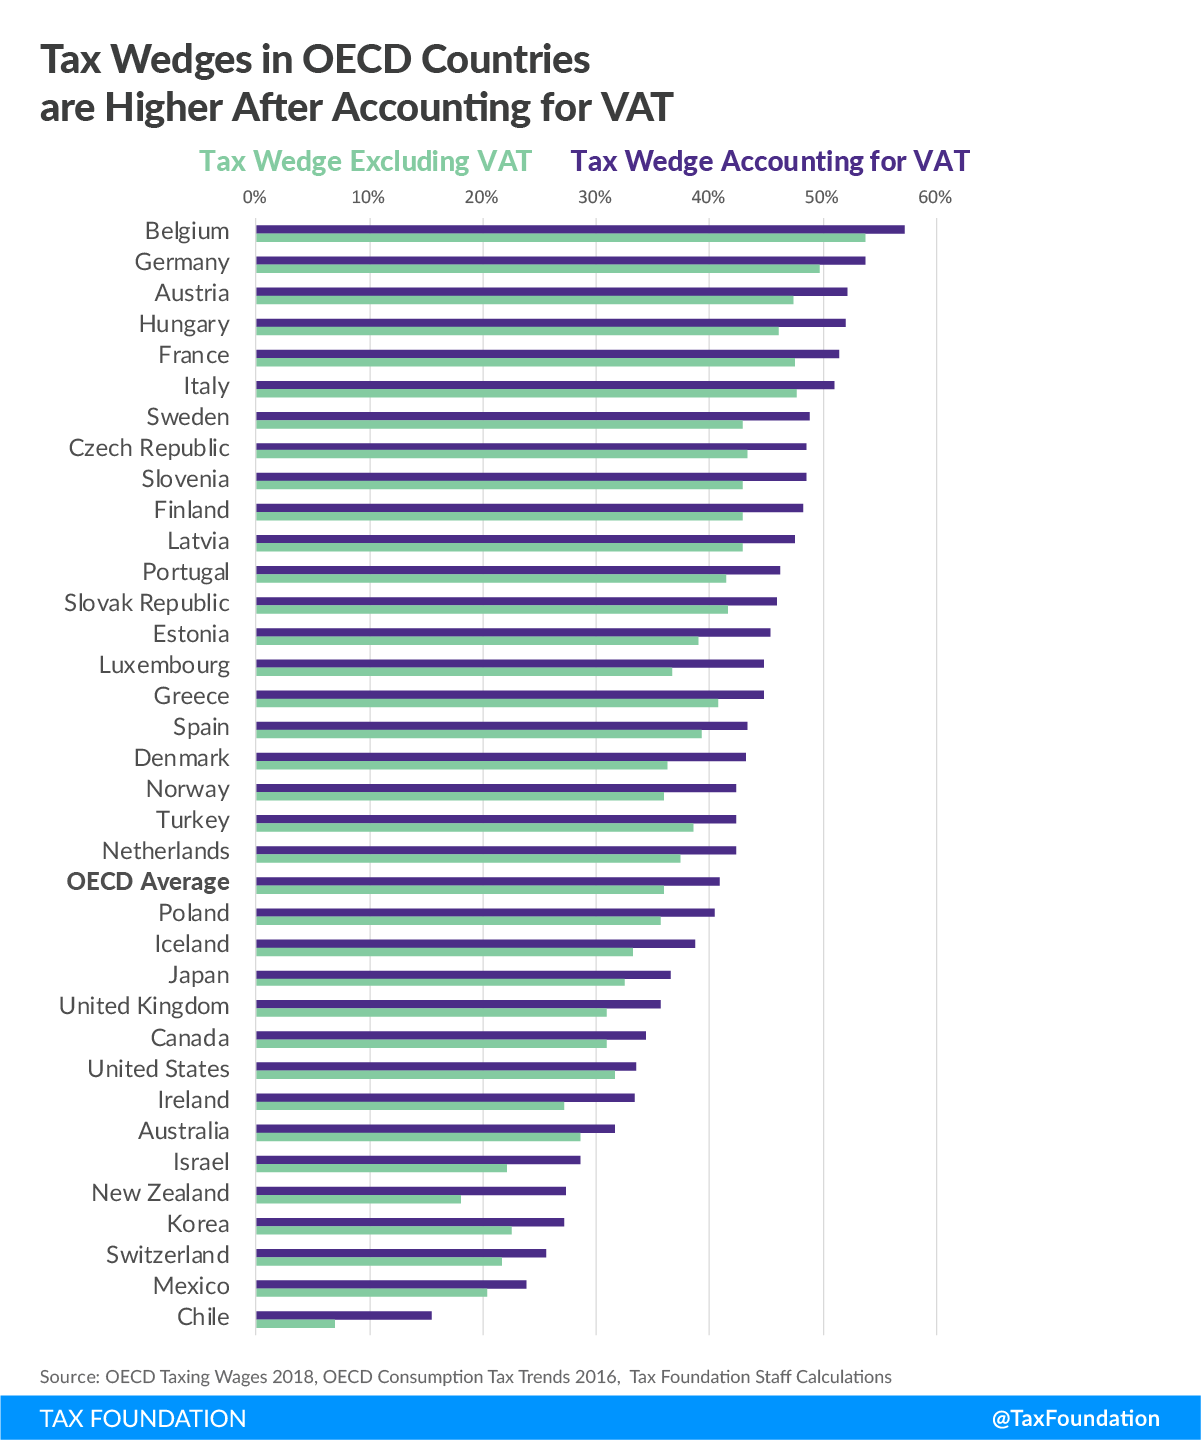
- Accounting for value-added taxes reveals that the average tax burden on labor is 14 percent higher than when only income and payroll taxes are considered.
Introduction
Individual income taxes, payroll taxes, and value-added taxes (VAT) make up a large portion of many countries’ tax revenue. These taxes combined make up the tax burden on labor. Revenues from these taxes often go toward large-scale government programs, such as Social Security and Medicare in the United States. The Organisation for Economic Co-operation and Development (OECD) reports data on the tax burden on labor across 35 developed countries, including the United States.[1] Tax burdens in other OECD countries are generally higher on average than in the United States, but 80 percent of countries in the OECD still have tax burdens over 30 percent.
In many countries these taxes are progressive, which means that higher-income workers are taxed at higher rates. However, this does not mean that the average worker is not also burdened by these taxes. It is also important to note that the tax burden on families is often lower than the burden on single, childless workers making the same pretax income.
The most recent data available shows that single workers with no children earning an average wage in the United States faced a tax burden from income and payroll taxes of 31.7 percent in 2017, which remains unchanged from last year’s report. The Tax Cuts and Jobs Act of 2017 (TCJA) reduced individual incomes taxes beginning in 2018, and these changes are expected to lower tax burdens going forward.[2] After accounting for sales taxes, which reduce the purchasing power of earnings, the tax wedge in the United States is 33.5 percent.
As noted in our primer on the tax wedgeA tax wedge is the difference between total labor costs to the employer and the corresponding net take-home pay of the employee. It is also an economic term that refers to the economic inefficiency resulting from taxes. on labor, there is a negative relationship between the tax wedge and employment.[3] Because of this, countries should explore ways to make their taxation of labor less burdensome to improve the efficiency of their labor markets.
Taxation of Wage Income in the United States
The OECD report focuses on two major types of taxes that wage earners in the United States pay. First, individual income taxes are levied by federal, state, and sometimes local governments to fund the general operations of government. Second, governments levy payroll taxes on both employees and employers, though the economic burden, or incidence, of both ultimately falls on wage earners. Payroll taxes are meant to fund programs such as Social Security, Medicare, and Unemployment Insurance funds.
In total, the tax burden on labor is referred to as a “tax wedge,” which simply refers to the amount the government takes from the labor force, or the difference between pretax and post-tax wages.[4] For the purpose of the OECD study, the wedge is determined by several factors: the amount of pretax income (referred to as labor cost) a person makes, the taxes that apply to that income, and whether the taxpayer is filing as single or as a family.
The Individual Income Tax
Federal income taxes are the most familiar component of taxation on labor. In the United States, federal income taxes are levied via a system of brackets at different rates.[5] The Tax Cuts and Jobs Act (TCJA) altered the brackets and rates; these changes will be included in next year’s update to the OECD report, but are not reflected here because the OECD report is looking at data from 2017.
| Prior to TCJA | After TCJA | ||
|---|---|---|---|
| Taxable Income | Tax Rate | Taxable Income | Tax Rate |
| $0-$9,525 | 10% | $0-$9,525 | 10% |
| $9526-$38,700 | 15% | $9526-$38,700 | 12% |
| $38701-$93,700 | 25% | $38,701-$82,500 | 22% |
| $93,701-$195,450 | 28% | $82,501-$157,500 | 24% |
| $195,451-$424,950 | 33% | $157,501-$200,000 | 32% |
| $424,951-$426,700 | 35% | $200,001-$500,000 | 35% |
| $426,701+ | 39.60% | $500,001+ | 37% |
Payroll Taxes
The United States levies two major payroll taxes. The first is a 12.4 percent tax which is used to fund Social Security (Table 2). This tax is levied beginning on the first dollar an individual earns in wages and self-employment income up to a cap of $127,200 in 2017. This cap is adjusted to wage and changes each year. Legally, the tax is paid half by employers and half by employees.[6]
The second is a 2.9 percent payroll tax to fund Medicare. This tax is also levied beginning on the first dollar of income but has no cap. As with the Social Security payroll tax, this tax is split evenly between employers and employees. An additional 0.9 percent Medicare payroll tax applies to wage income over $200,000 (this cap is not adjusted for inflationInflation is when the general price of goods and services increases across the economy, reducing the purchasing power of a currency and the value of certain assets. The same paycheck covers less goods, services, and bills. It is sometimes referred to as a “hidden tax,” as it leaves taxpayers less well-off due to higher costs and “bracket creep,” while increasing the government’s spending power. ).[7]
| Taxable Earnings | Social Security | Medicare | Total | ||
|---|---|---|---|---|---|
| Employee | Employer | Employee | Employer | ||
| $0 – $128,700 | 6.20% | 6.20% | 1.45% | 1.45% | 15.30% |
| $128,800 – $200,000 | 0 | 0 | 1.45% | 1.45% | 2.90% |
| $200,000 and over | 0 | 0 | 2.35% | 1.45% | 3.80% |
Unemployment Insurance Taxes
In addition to the employer-side taxes that fund Medicare and Social Security, there is a third payroll tax, to fund Unemployment Insurance (UI). Unemployment Insurance is a joint federal-state social insurance program that insures workers against an unexpected loss of income due to losing one’s job. The tax that funds this program is levied on the employer.
The federal unemployment tax is 6 percent on the first $7,000 of payroll. However, states also set UI tax rates to fund their portion of the program. State UI tax rates and bases can vary substantially. The variation is based on how frequently an individual employer’s workers receive unemployment benefits. If an employer is likely to hire and fire her employees at a higher than normal rate, the employer will face a higher tax rate. However, the federal and state tax rates are not additive. Employers can credit 90 percent of their state tax against the federal tax, reducing the federal rate to as low as 0.6 percent.[8]
The Economic Incidence of Payroll Taxes
Although payroll taxes in the United States are split between workers and their employers, economists generally agree that both sides of the payroll tax ultimately fall on workers.
In tax policy, there is an important distinction between the “legal” and the “economic” incidence of a tax. The legal incidence of a tax falls on the party that is legally required to write the check to the tax collector.
However, the party that legally pays a tax is not always the one that ultimately bears the burden of the tax. The “economic” incidence of a tax can fall on any number of people and is determined by the relative elasticities of supply and demand of a taxed good, or how people and businesses respond to a tax.[9]
Even unemployment insurance taxes, in which the legal incidence is only on employers, still can be shifted so that the economic incidence is on the employees. This is because employers control employee wages and can adjust them to make up for the taxes.
U.S. Single Workers with No Children
Every year, the OECD surveys all 35-member nations on their labor tax burdens. The OECD calculates these burdens by adding together the income tax payment, employee payroll tax payment, and employer-side payroll tax payment of a worker making the average wage in each country. The OECD then divides this figure by the total labor cost of this average worker, or what the worker would have earned in the absence of these three taxes. This is called the average tax wedge on labor income.
The United States’ tax wedge is the combined labor tax burden, which is made from the income tax, employee payroll tax, and employee-side payroll tax, divided by the total labor cost of the average worker (what the worker would’ve earned without the taxes).
In 2017, the United States’ tax wedge for a single worker with no children was 31.7 percent, slightly below the OECD average of 35.9 percent. The OECD also estimated that in 2017 American workers paid an income tax of 16.9 percent, which is slightly above the OECD average of 13.5 percent, as many other countries have higher payroll taxes on employers rather than direct income taxes.
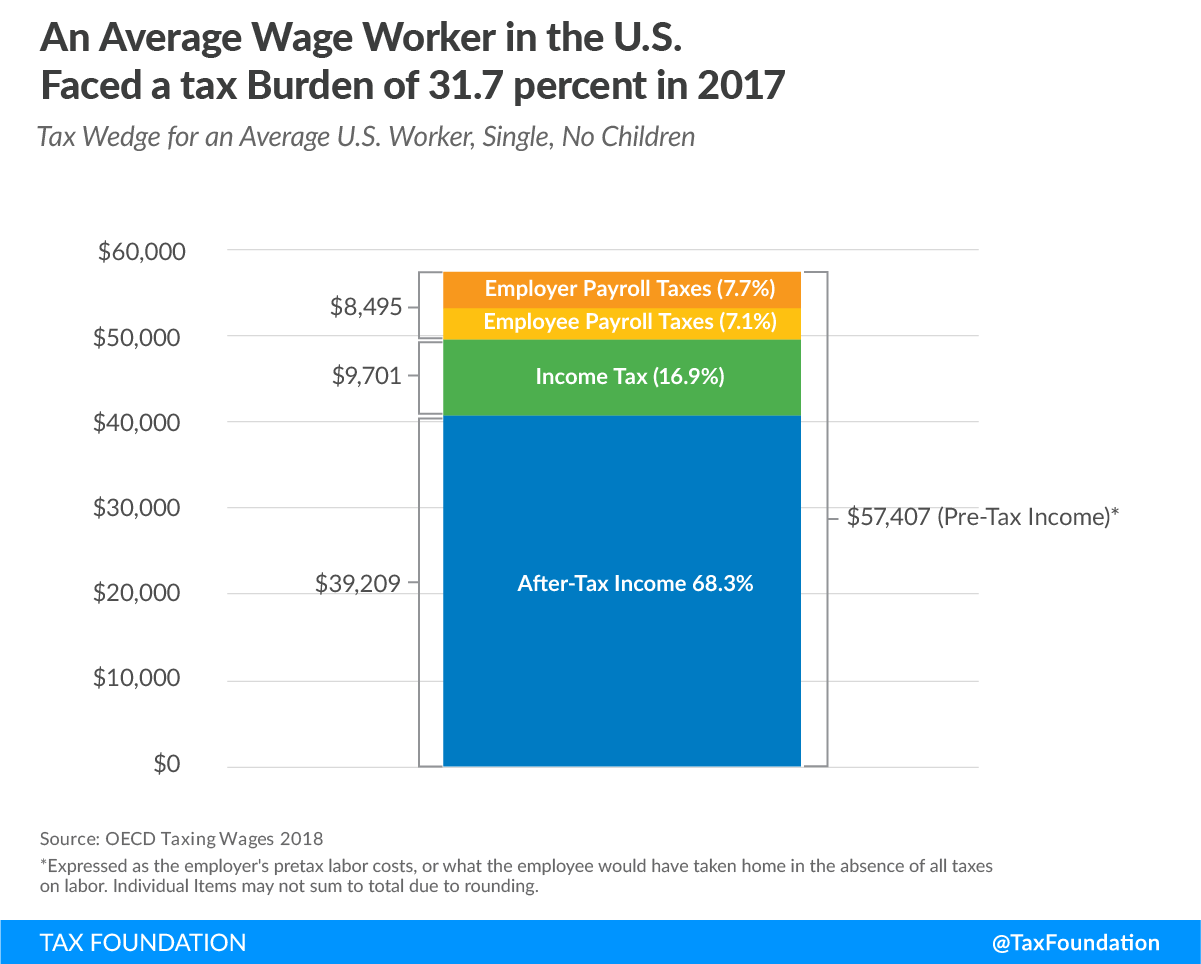
An average-wage worker in the United States in 2017 (making an average of $57,407 annually kept 68.3 percent of that income, or $39,203. Out of the three taxes, income tax makes up the largest part of the tax wedge at 16.9 percent, or, on average, $9,701.
Where does the United States Rank?
As previously noted, the United States has a below average tax wedge on single workers when looking at income and payroll taxes. The U.S. has the 11th lowest tax burden in the OECD (out of 35 countries) for single workers. Forty percent of countries in the OECD have tax wedges between 30 to 40 percent while another 40 percent of member countries have tax wedges between 40 to 55 percent.
Many countries rely more on employer contributions than the United States does. For example, the 17 countries with the highest tax wedges all have higher employer-side payroll taxes than income taxes. Countries where the largest portion of the tax wedge comes from the income tax are more uncommon. Some of these countries include the United States, Canada, and the United Kingdom.
However, as previously noted, many countries may levy higher employer-side payroll taxes, but this only puts the legal incidence on the employers, not the economic incidence. That is, the employers may be the ones signing the checks to the various governments, but in the end the employees pay these taxes through lowered wages.
How Family Composition Alters the Tax Burden Among OECD Member Countries
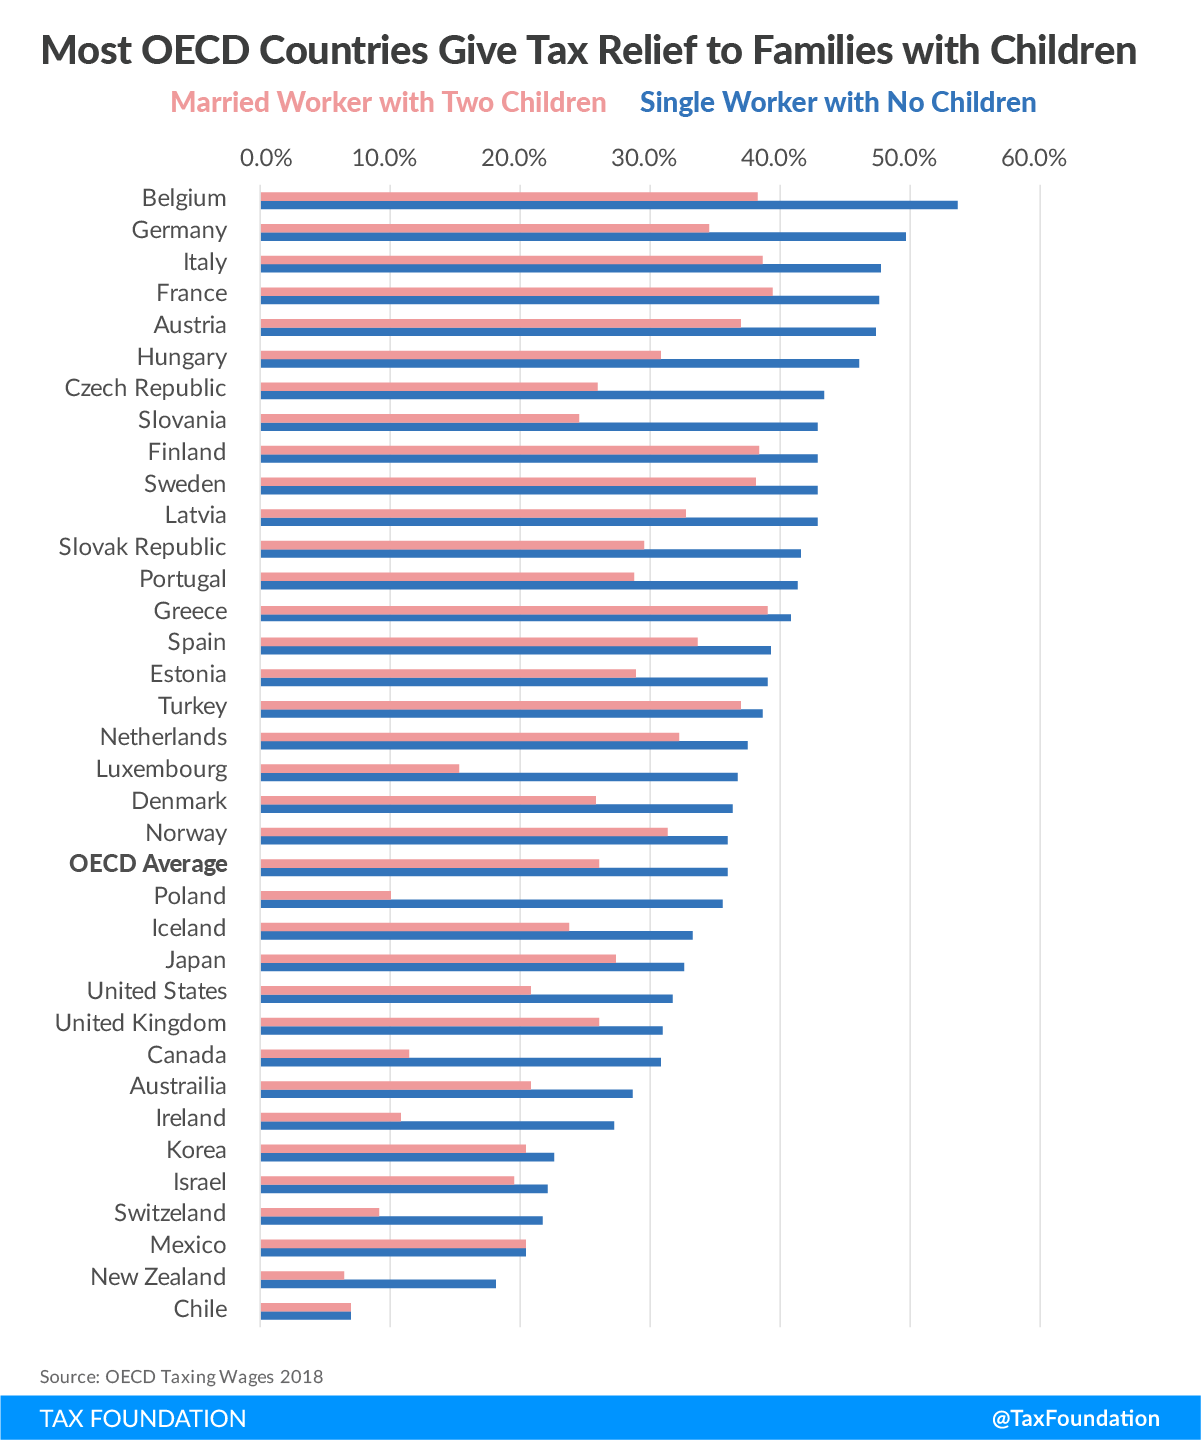
Many countries in the OECD provide some targeted tax relief for families with children. While the average tax wedge for single workers is 35.9 percent, the average wedge for families, defined as including a single income earner filing jointly with two children, is 26.1 percent.[10] The United States is no exception, as the average tax wedge for families is 20.8 percent, compared to the 31.7 percent average wedge for single workers with no children. These two wedges, single and family, are based on the same pretax wages (referred to as labor cost) because a “family” refers to a two-child family with just one income earner.
Poland has the largest disparity between the two tax wedges with a 25.6 percentage-point difference between its 35.6 percent wedge for single workers and 10 percent wedge for families. The lowest family tax wedge is in New Zealand at 6.4 percent, which is just slightly lower than Chile, which has a 7 percent wedge for both single and family taxpayers.
Marginal and Average Tax Wedges
Comparing the tax wedge on the average worker across countries is only a partial representation of how taxes on labor impact the economy, both by changing incentives to work and by raising revenue for the government at various levels.
The OECD’s “Taxing Wages 2018” report presents both average and marginal tax wedges. The average tax wedge is what has been presented so far and is the combined share of labor and payroll taxes relative to total labor costs, or the tax burden. The marginal tax wedge is instead the share of labor and payroll taxes applicable to the next dollar earned and can impact individuals’ decisions to work. The marginal tax wedge is generally higher than the average tax wedge due to the progressivity of taxes on labor across countries—as workers earn more, they face a higher tax wedge on their marginal dollar of earnings.
Directly comparing marginal tax wedges across countries is less informative. Many countries’ marginal tax wedges are higher than others simply because their overall tax burden is high. For example, France has a high marginal tax wedge of 62 percent while Israel has a marginal tax wedge of just 41 percent.
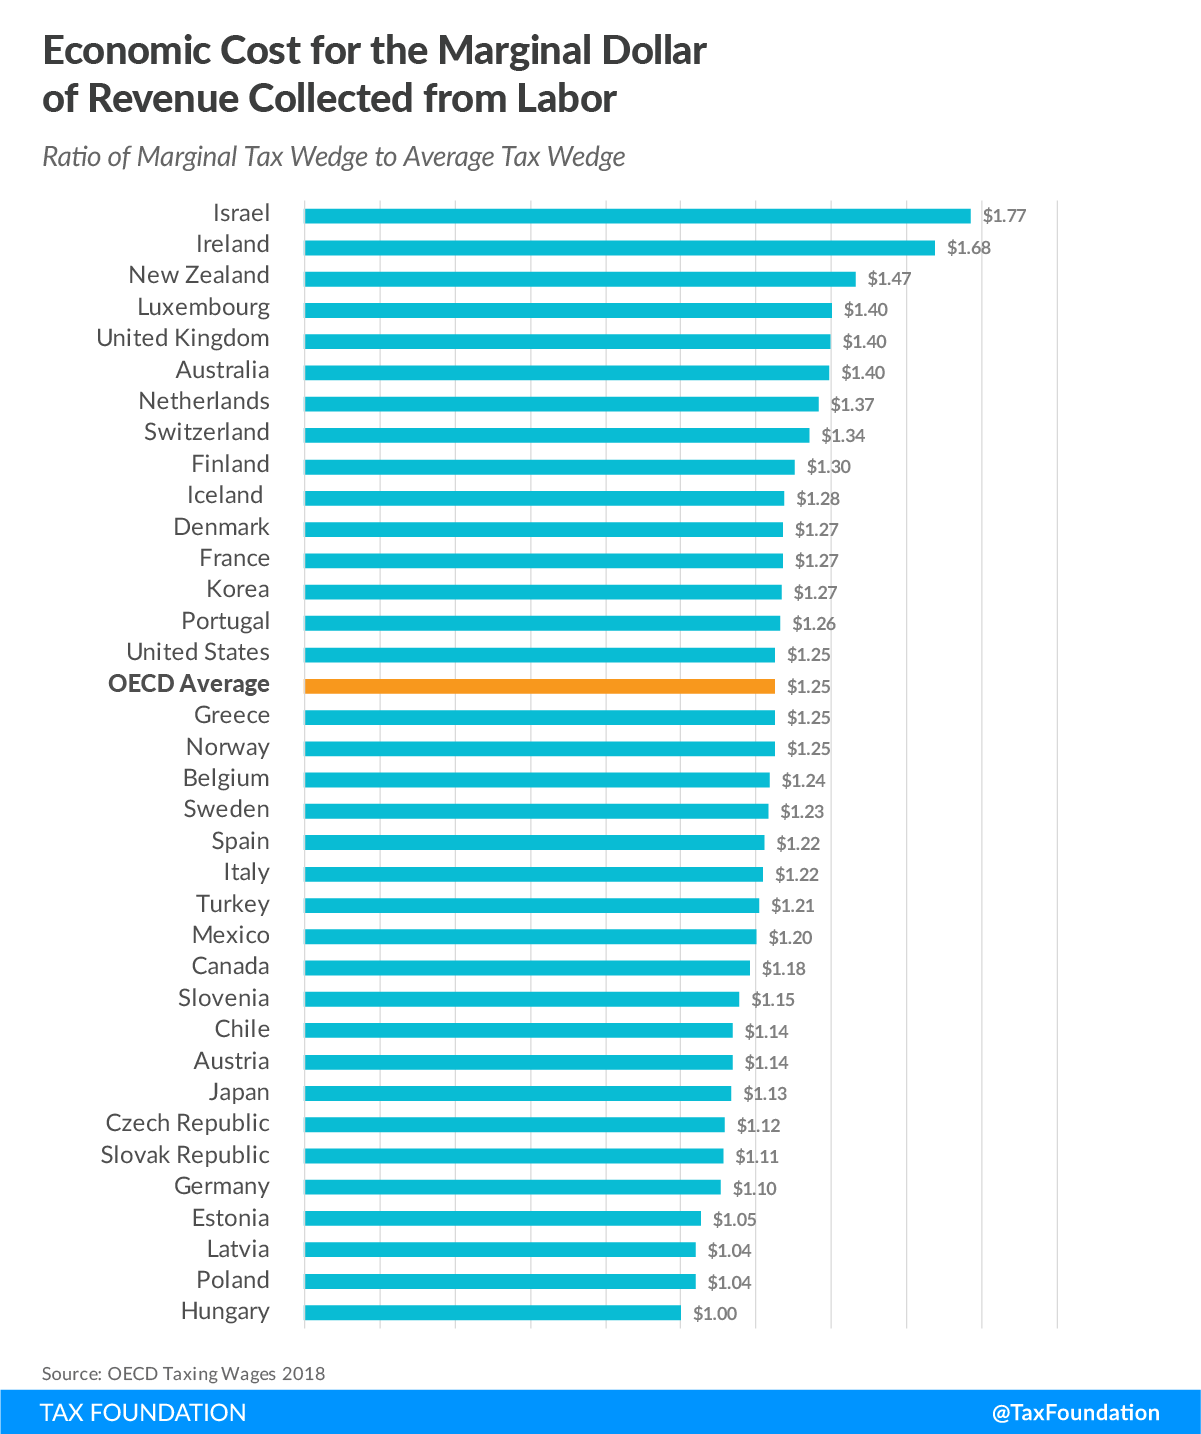
One way to examine the efficiency of labor taxation in a country is to control for the level of labor taxation by taking the ratio of the marginal tax wedge to the average tax wedge. The ratio of the marginal tax wedge to the average tax wedge for a country is a rough proxy for the economic cost of a government funding $1 more of revenue through taxes on labor, at any given level of labor taxation.
Comparing this metric across countries shows that Hungary has the lowest ratio of $1 in cost for each additional dollar raised from labor taxes. This is because Hungary has a flat income tax, so the marginal and average tax wedge are the same. In contrast, in Israel, the cost of raising an additional dollar in revenue from taxes on its workforce is $1.77. The average across OECD countries is $1.25.
This metric tends to show that countries with high labor burdens, such as Germany and Austria, raise revenue from labor taxes rather efficiently. These countries have labor tax wedges of 50 percent and 47 percent, respectively, but their ratios are both below the OECD average of $1.25.
Accounting for Consumption Taxes
The tax burden on labor is broader than personal income taxes and payroll taxes. In many countries individuals also pay a value-added tax (VAT) on their consumption. Because a VAT diminishes the purchasing power of individual earnings, a more complete picture of the tax burden should include the VAT. Although the United States does not have a VAT, state sales taxes also work to diminish the value of earnings.
Accounting for VAT rates and bases in OECD countries increases the average tax burden on labor by 5 percentage points. The distribution of rates across countries is similar to that shown in Figure 2. The country with the largest difference between the two measurements is New Zealand with a tax wedge accounting for the VAT that is 27.3 percent, 9.2 percentage points larger than the tax wedge that only accounts for income and payroll taxes. The United States has the smallest difference between the two measures, 1.8 percentage points, because state sales taxes as a share of total labor costs are generally much lower than VAT rates in other OECD countries. The effective VAT rate is much lower than the statutory rate for each country because of exclusions in the tax base.
Conclusion
The United States has a relatively low tax burden on labor compared to other countries in the OECD. Income taxes in most countries, including the U.S., are progressive, but even average-wage workers end up paying about one-third of their wages in taxes. Families across OECD countries have smaller tax burdens than single workers earning the same income in most countries, but how much less families pay varies. Accounting for consumption taxes reveals higher tax wedges than when just accounting for income and payroll taxes. Governments with higher taxes generally tout that they provide more services as an explanation, and while that is often true, the cost of these services can be more than half of an average worker’s salary, and for most, at least a third of their salary.
| Source: OECD Taxing Wages 2018 | |||||||||||||||||||||||||||||||||||||||||||||||||||||||||||||||||||||||||||||||||||||||||||||||||||
| Country | Rank | Tax Wedge % | Income tax % | Social Security Contributions % | Average Labor Costs | ||||||||||||||||||||||||||||||||||||||||||||||||||||||||||||||||||||||||||||||||||||||||||||||
|---|---|---|---|---|---|---|---|---|---|---|---|---|---|---|---|---|---|---|---|---|---|---|---|---|---|---|---|---|---|---|---|---|---|---|---|---|---|---|---|---|---|---|---|---|---|---|---|---|---|---|---|---|---|---|---|---|---|---|---|---|---|---|---|---|---|---|---|---|---|---|---|---|---|---|---|---|---|---|---|---|---|---|---|---|---|---|---|---|---|---|---|---|---|---|---|---|---|---|---|
| Employee | Employer | ||||||||||||||||||||||||||||||||||||||||||||||||||||||||||||||||||||||||||||||||||||||||||||||||||
| Belgium | 1 | 53.7 | 20.7 | 10.9 | 22.2 | $75,220 | |||||||||||||||||||||||||||||||||||||||||||||||||||||||||||||||||||||||||||||||||||||||||||||
| Germany | 2 | 49.7 | 16.0 | 17.4 | 16.3 | $75,896 | |||||||||||||||||||||||||||||||||||||||||||||||||||||||||||||||||||||||||||||||||||||||||||||
| Italy | 3 | 47.7 | 16.5 | 7.2 | 24.0 | $56,980 | |||||||||||||||||||||||||||||||||||||||||||||||||||||||||||||||||||||||||||||||||||||||||||||
| France | 4 | 47.6 | 11.0 | 10.6 | 26.0 | $65,316 | |||||||||||||||||||||||||||||||||||||||||||||||||||||||||||||||||||||||||||||||||||||||||||||
| Austria | 5 | 47.4 | 11.2 | 14.0 | 22.2 | $73,996 | |||||||||||||||||||||||||||||||||||||||||||||||||||||||||||||||||||||||||||||||||||||||||||||
| Hungary | 6 | 46.2 | 12.1 | 15.0 | 19.0 | $32,125 | |||||||||||||||||||||||||||||||||||||||||||||||||||||||||||||||||||||||||||||||||||||||||||||
| Czech Republic | 7 | 43.4 | 9.8 | 8.2 | 25.4 | $36,898 | |||||||||||||||||||||||||||||||||||||||||||||||||||||||||||||||||||||||||||||||||||||||||||||
| Slovenia | 8 | 42.9 | 10.0 | 19.0 | 13.9 | $36,475 | |||||||||||||||||||||||||||||||||||||||||||||||||||||||||||||||||||||||||||||||||||||||||||||
| Finland | 9 | 42.9 | 17.1 | 7.6 | 18.2 | $59,947 | |||||||||||||||||||||||||||||||||||||||||||||||||||||||||||||||||||||||||||||||||||||||||||||
| Sweden | 10 | 42.9 | 13.7 | 5.3 | 23.9 | $62,631 | |||||||||||||||||||||||||||||||||||||||||||||||||||||||||||||||||||||||||||||||||||||||||||||
| Latvia | 11 | 42.9 | 15.3 | 8.5 | 19.1 | $26,896 | |||||||||||||||||||||||||||||||||||||||||||||||||||||||||||||||||||||||||||||||||||||||||||||
| Slovak Republic | 12 | 41.6 | 7.7 | 10.2 | 23.6 | $30,752 | |||||||||||||||||||||||||||||||||||||||||||||||||||||||||||||||||||||||||||||||||||||||||||||
| Portugal | 13 | 41.4 | 13.3 | 8.9 | 19.2 | $38,224 | |||||||||||||||||||||||||||||||||||||||||||||||||||||||||||||||||||||||||||||||||||||||||||||
| Greece | 14 | 40.8 | 8.0 | 12.8 | 20.0 | $43,977 | |||||||||||||||||||||||||||||||||||||||||||||||||||||||||||||||||||||||||||||||||||||||||||||
| Spain | 15 | 39.3 | 11.3 | 4.9 | 23.0 | $52,546 | |||||||||||||||||||||||||||||||||||||||||||||||||||||||||||||||||||||||||||||||||||||||||||||
| Estonia | 16 | 39.0 | 12.5 | 1.2 | 25.3 | $35,853 | |||||||||||||||||||||||||||||||||||||||||||||||||||||||||||||||||||||||||||||||||||||||||||||
| Turkey | 17 | 38.7 | 11.0 | 12.8 | 14.9 | $34,384 | |||||||||||||||||||||||||||||||||||||||||||||||||||||||||||||||||||||||||||||||||||||||||||||
| Netherlands | 18 | 37.5 | 15.5 | 11.8 | 10.1 | $70,094 | |||||||||||||||||||||||||||||||||||||||||||||||||||||||||||||||||||||||||||||||||||||||||||||
| Luxembourg | 19 | 36.7 | 14.9 | 11.0 | 10.8 | $73,707 | |||||||||||||||||||||||||||||||||||||||||||||||||||||||||||||||||||||||||||||||||||||||||||||
| Denmark | 20 | 36.3 | 35.8 | 0.0 | 0.8 | $56,651 | |||||||||||||||||||||||||||||||||||||||||||||||||||||||||||||||||||||||||||||||||||||||||||||
| Norway | 21 | 35.9 | 17.2 | 7.3 | 11.5 | $63,733 | |||||||||||||||||||||||||||||||||||||||||||||||||||||||||||||||||||||||||||||||||||||||||||||
| Poland | 22 | 35.6 | 6.2 | 15.3 | 14.1 | $32,384 | |||||||||||||||||||||||||||||||||||||||||||||||||||||||||||||||||||||||||||||||||||||||||||||
| Iceland | 23 | 33.2 | 26.5 | 0.3 | 6.4 | $68,021 | |||||||||||||||||||||||||||||||||||||||||||||||||||||||||||||||||||||||||||||||||||||||||||||
| Japan | 24 | 32.6 | 6.9 | 12.5 | 13.2 | $60,989 | |||||||||||||||||||||||||||||||||||||||||||||||||||||||||||||||||||||||||||||||||||||||||||||
| United States | 25 | 31.7 | 16.9 | 7.1 | 7.7 | $57,407 | |||||||||||||||||||||||||||||||||||||||||||||||||||||||||||||||||||||||||||||||||||||||||||||
| United Kingdom | 26 | 30.9 | 12.6 | 8.5 | 9.8 | $60,213 | |||||||||||||||||||||||||||||||||||||||||||||||||||||||||||||||||||||||||||||||||||||||||||||
| Canada | 27 | 30.9 | 13.8 | 6.6 | 10.4 | $45,746 | |||||||||||||||||||||||||||||||||||||||||||||||||||||||||||||||||||||||||||||||||||||||||||||
| Australia | 28 | 28.6 | 23.0 | 0.0 | 5.6 | $58,387 | |||||||||||||||||||||||||||||||||||||||||||||||||||||||||||||||||||||||||||||||||||||||||||||
| Ireland | 29 | 27.2 | 13.9 | 3.6 | 9.7 | $49,941 | |||||||||||||||||||||||||||||||||||||||||||||||||||||||||||||||||||||||||||||||||||||||||||||
| Korea | 30 | 22.6 | 5.5 | 7.6 | 9.4 | $57,945 | |||||||||||||||||||||||||||||||||||||||||||||||||||||||||||||||||||||||||||||||||||||||||||||
| Israel | 31 | 22.1 | 9.2 | 7.6 | 5.3 | $41,409 | |||||||||||||||||||||||||||||||||||||||||||||||||||||||||||||||||||||||||||||||||||||||||||||
| Switzerland | 32 | 21.8 | 10.0 | 5.9 | 5.9 | $75,245 | |||||||||||||||||||||||||||||||||||||||||||||||||||||||||||||||||||||||||||||||||||||||||||||
| Mexico | 33 | 20.4 | 8.8 | 1.2 | 10.4 | $14,209 | |||||||||||||||||||||||||||||||||||||||||||||||||||||||||||||||||||||||||||||||||||||||||||||
| New Zealand | 34 | 18.1 | 18.1 | 0.0 | 0.0 | $39,826 | |||||||||||||||||||||||||||||||||||||||||||||||||||||||||||||||||||||||||||||||||||||||||||||
| Chile | 35 | 7.0 | 0.0 | 7.0 | 0.0 | $22,616 | |||||||||||||||||||||||||||||||||||||||||||||||||||||||||||||||||||||||||||||||||||||||||||||
| OECD Average | N/A | 35.9 | 13.5 | 8.2 | 14.2 | $51,047 | |||||||||||||||||||||||||||||||||||||||||||||||||||||||||||||||||||||||||||||||||||||||||||||
| Source: OECD Taxing Wages 2018 | |||||||||||||||||||||||||||||||||||||||||||||||||||||||||||||||||||||||||||||||||||||||||||||||||||
| Country | Rank | Tax Wedge Including VAT % | Income tax % | Social Security Contributions % | VAT % | Average Labor Costs Including VAT | |||||||||||||||||||||||||||||||||||||||||||||||||||||||||||||||||||||||||||||||||||||||||||||
|---|---|---|---|---|---|---|---|---|---|---|---|---|---|---|---|---|---|---|---|---|---|---|---|---|---|---|---|---|---|---|---|---|---|---|---|---|---|---|---|---|---|---|---|---|---|---|---|---|---|---|---|---|---|---|---|---|---|---|---|---|---|---|---|---|---|---|---|---|---|---|---|---|---|---|---|---|---|---|---|---|---|---|---|---|---|---|---|---|---|---|---|---|---|---|---|---|---|---|---|
| Belgium | 1 | 57.2 | 19.1 | 30.6 | 7.5 | $81,355 | |||||||||||||||||||||||||||||||||||||||||||||||||||||||||||||||||||||||||||||||||||||||||||||
| Germany | 2 | 53.7 | 14.7 | 30.9 | 8.1 | $82,561 | |||||||||||||||||||||||||||||||||||||||||||||||||||||||||||||||||||||||||||||||||||||||||||||
| Austria | 3 | 52.1 | 10.2 | 32.9 | 9.0 | $81,273 | |||||||||||||||||||||||||||||||||||||||||||||||||||||||||||||||||||||||||||||||||||||||||||||
| Hungary | 4 | 52.0 | 10.8 | 30.3 | 10.8 | $36,018 | |||||||||||||||||||||||||||||||||||||||||||||||||||||||||||||||||||||||||||||||||||||||||||||
| France | 5 | 51.5 | 10.2 | 33.9 | 7.4 | $70,541 | |||||||||||||||||||||||||||||||||||||||||||||||||||||||||||||||||||||||||||||||||||||||||||||
| Italy | 6 | 51.0 | 15.5 | 29.3 | 6.3 | $60,781 | |||||||||||||||||||||||||||||||||||||||||||||||||||||||||||||||||||||||||||||||||||||||||||||
| Sweden | 7 | 48.8 | 12.3 | 26.2 | 10.2 | $69,771 | |||||||||||||||||||||||||||||||||||||||||||||||||||||||||||||||||||||||||||||||||||||||||||||
| Czech Republic | 8 | 48.5 | 8.9 | 30.5 | 9.1 | $40,612 | |||||||||||||||||||||||||||||||||||||||||||||||||||||||||||||||||||||||||||||||||||||||||||||
| Slovenia | 9 | 48.5 | 9.1 | 29.7 | 9.8 | $40,422 | |||||||||||||||||||||||||||||||||||||||||||||||||||||||||||||||||||||||||||||||||||||||||||||
| Finland | 10 | 48.3 | 15.4 | 23.4 | 9.5 | $66,213 | |||||||||||||||||||||||||||||||||||||||||||||||||||||||||||||||||||||||||||||||||||||||||||||
| Latvia | 11 | 47.5 | 14.1 | 25.4 | 8.1 | $29,276 | |||||||||||||||||||||||||||||||||||||||||||||||||||||||||||||||||||||||||||||||||||||||||||||
| Portugal | 12 | 46.2 | 12.2 | 25.8 | 8.2 | $41,655 | |||||||||||||||||||||||||||||||||||||||||||||||||||||||||||||||||||||||||||||||||||||||||||||
| Slovak Republic | 13 | 45.9 | 7.2 | 31.4 | 7.4 | $33,212 | |||||||||||||||||||||||||||||||||||||||||||||||||||||||||||||||||||||||||||||||||||||||||||||
| Estonia | 14 | 45.4 | 11.2 | 23.7 | 10.4 | $40,036 | |||||||||||||||||||||||||||||||||||||||||||||||||||||||||||||||||||||||||||||||||||||||||||||
| Luxembourg | 15 | 44.8 | 13.0 | 19.0 | 12.7 | $84,417 | |||||||||||||||||||||||||||||||||||||||||||||||||||||||||||||||||||||||||||||||||||||||||||||
| Greece | 16 | 44.8 | 7.4 | 30.6 | 6.7 | $47,127 | |||||||||||||||||||||||||||||||||||||||||||||||||||||||||||||||||||||||||||||||||||||||||||||
| Spain | 17 | 43.3 | 10.6 | 26.1 | 6.6 | $56,285 | |||||||||||||||||||||||||||||||||||||||||||||||||||||||||||||||||||||||||||||||||||||||||||||
| Denmark | 18 | 43.2 | 32.0 | 0.7 | 10.6 | $63,336 | |||||||||||||||||||||||||||||||||||||||||||||||||||||||||||||||||||||||||||||||||||||||||||||
| Norway | 19 | 42.4 | 15.4 | 16.9 | 10.1 | $70,871 | |||||||||||||||||||||||||||||||||||||||||||||||||||||||||||||||||||||||||||||||||||||||||||||
| Turkey | 20 | 42.3 | 10.3 | 26.0 | 6.0 | $36,587 | |||||||||||||||||||||||||||||||||||||||||||||||||||||||||||||||||||||||||||||||||||||||||||||
| Netherlands | 21 | 42.3 | 14.3 | 20.2 | 7.7 | $75,933 | |||||||||||||||||||||||||||||||||||||||||||||||||||||||||||||||||||||||||||||||||||||||||||||
| Poland | 22 | 40.5 | 5.7 | 27.2 | 7.6 | $35,048 | |||||||||||||||||||||||||||||||||||||||||||||||||||||||||||||||||||||||||||||||||||||||||||||
| Iceland | 23 | 38.7 | 24.3 | 6.2 | 8.2 | $74,077 | |||||||||||||||||||||||||||||||||||||||||||||||||||||||||||||||||||||||||||||||||||||||||||||
| Japan | 24 | 36.6 | 6.5 | 24.2 | 6.0 | $64,870 | |||||||||||||||||||||||||||||||||||||||||||||||||||||||||||||||||||||||||||||||||||||||||||||
| United Kingdom | 25 | 35.6 | 11.8 | 17.1 | 6.8 | $64,629 | |||||||||||||||||||||||||||||||||||||||||||||||||||||||||||||||||||||||||||||||||||||||||||||
| Canada | 26 | 34.4 | 13.1 | 16.2 | 5.1 | $48,224 | |||||||||||||||||||||||||||||||||||||||||||||||||||||||||||||||||||||||||||||||||||||||||||||
| United States | 27 | 33.5 | 16.5 | 14.4 | 2.6 | $58,968 | |||||||||||||||||||||||||||||||||||||||||||||||||||||||||||||||||||||||||||||||||||||||||||||
| Ireland | 28 | 33.3 | 12.7 | 12.2 | 8.4 | $54,516 | |||||||||||||||||||||||||||||||||||||||||||||||||||||||||||||||||||||||||||||||||||||||||||||
| Australia | 29 | 31.7 | 22.0 | 5.4 | 4.3 | $60,988 | |||||||||||||||||||||||||||||||||||||||||||||||||||||||||||||||||||||||||||||||||||||||||||||
| Israel | 30 | 28.6 | 8.4 | 11.8 | 8.4 | $45,199 | |||||||||||||||||||||||||||||||||||||||||||||||||||||||||||||||||||||||||||||||||||||||||||||
| New Zealand | 31 | 27.3 | 16.1 | 0.0 | 11.2 | $44,865 | |||||||||||||||||||||||||||||||||||||||||||||||||||||||||||||||||||||||||||||||||||||||||||||
| Korea | 32 | 27.1 | 5.2 | 16.0 | 5.9 | $61,580 | |||||||||||||||||||||||||||||||||||||||||||||||||||||||||||||||||||||||||||||||||||||||||||||
| Switzerland | 33 | 25.5 | 9.6 | 11.2 | 4.8 | $79,064 | |||||||||||||||||||||||||||||||||||||||||||||||||||||||||||||||||||||||||||||||||||||||||||||
| Mexico | 34 | 23.8 | 8.4 | 11.1 | 4.2 | $14,836 | |||||||||||||||||||||||||||||||||||||||||||||||||||||||||||||||||||||||||||||||||||||||||||||
| Chile | 35 | 15.5 | 0.0 | 6.4 | 9.1 | $24,891 | |||||||||||||||||||||||||||||||||||||||||||||||||||||||||||||||||||||||||||||||||||||||||||||
| OECD Average | N/A | 40.9 | 12.4 | 20.6 | 7.9 | $55,430 | |||||||||||||||||||||||||||||||||||||||||||||||||||||||||||||||||||||||||||||||||||||||||||||
Methodology
The ratio of marginal to average tax wedges is calculated using the OECD data of marginal and average total tax wedges at four different levels of income for single individuals without dependents. It is the average of marginal total tax wedges at 67 percent, 100 percent, 133 percent, and 167 percent of average earnings divided by the average of average total tax wedges at 67 percent, 100 percent, 133 percent, and 167 percent of average earnings.
The formula for calculating tax wedges that account for VAT utilize the VAT rates and base from the OECD’s “Consumption TaxA consumption tax is typically levied on the purchase of goods or services and is paid directly or indirectly by the consumer in the form of retail sales taxes, excise taxes, tariffs, value-added taxes (VAT), or an income tax where all savings is tax-deductible. Trends” report and the OECD’s “Tax Wedge Decomposition” dataset.[11] We first calculate a tax-inclusive VAT, which is the rate/(rate+1) multiplied by the tax baseThe tax base is the total amount of income, property, assets, consumption, transactions, or other economic activity subject to taxation by a tax authority. A narrow tax base is non-neutral and inefficient. A broad tax base reduces tax administration costs and allows more revenue to be raised at lower rates. . The formula for calculating the tax wedge including the VAT is then:
(Income taxes + Payroll taxes + Sales taxes)/(Gross incomeFor individuals, gross income is the total pre-tax earnings from wages, tips, investments, interest, and other forms of income and is also referred to as “gross pay.” For businesses, gross income is total revenue minus cost of goods sold and is also known as “gross profit” or “gross margin.” + Sales taxes)
Sales taxes are in both the numerator and the denominator because the tax wedge is taxes on labor as a share of total labor costs. For employees, sales taxes and VAT are part of taxes on labor and they are also part of the total labor costs that employers face. By definition, a value-added tax is the rate of tax placed on the value added by a business by employing capital and labor. The added value is measured by the difference between the purchase price of materials and the sale of those materials (most often after a business turns those materials into something more useful). Though businesses may raise prices to pass the cost of a VAT or sales taxA sales tax is levied on retail sales of goods and services and, ideally, should apply to all final consumption with few exemptions. Many governments exempt goods like groceries; base broadening, such as including groceries, could keep rates lower. A sales tax should exempt business-to-business transactions which, when taxed, cause tax pyramiding. on to consumers in the short run, over the long run, the economic incidence of the VAT falls on workers.[12]
Notes
[1] OECD Publishing, “Taxing Wages 2018,” https://doi.org/10.1787/tax_wages-2018-en.
[2] Amir El-Sibaie, “2018 Tax BracketsA tax bracket is the range of incomes taxed at given rates, which typically differ depending on filing status. In a progressive individual or corporate income tax system, rates rise as income increases. There are seven federal individual income tax brackets; the federal corporate income tax system is flat. ,” Tax Foundation, Jan. 25, 2018, https://taxfoundation.org/2018-tax-brackets/.
[3] Scott A. Hodge and Bryan Hickman, “The Importance of the Tax Wedge on Labor in Evaluating Tax Systems,” Tax Foundation. /wp-content/uploads/2018/09/Global-Primer_tax_wedge.pdf
[4] Investopedia staff, “Tax Wedge, May 27, 2018, https://www.investopedia.com/terms/t/tax_wedge.asp.
[5] El-Sibaie, “2018 Tax Brackets.”
[6] Jose Trejos and Kyle Pomerleau, “A Comparison of the Tax Burden on Labor in the OECD, 2017,” Tax Foundation, August 30, 2017, https://taxfoundation.org/comparison-tax-burden-labor-oecd-2017/#_ftn3.
[7] Ibid.
[8] Joseph Bishop-Henchman, “Unemployment Insurance Taxes: Options for Program Design and Insolvent Trust Funds, Tax Foundation, Oct. 17, 2011, https://taxfoundation.org/article/unemployment-insurance-taxes-options-program-design-and-insolvent-trust-funds.
[9] Congressional Budget Office, “The Distribution of Household Income and Federal Taxes, 2013,” June 8, 2016. https://www.cbo.gov/publication/51361.
[10] OECD Publishing, “Taxing Wages 2018.”
[11] OECD Publishing, “Taxing Wages 2018”; OECD.Stat, “Table I.4. Marginal personal income tax and social security contribution rates on gross labour income,” https://stats.oecd.org/viewhtml.aspx?datasetcode=TABLE_I4&lang=en; and OECD.Stat, “Table I.5. Average personal income tax and social security contribution rates on gross labour income,” https://stats.oecd.org/viewhtml.aspx?datasetcode=TABLE_I5&lang=en.
[12] Eric Toder, Jim Nunns, and Joseph Rosenberg, “Implications of Different Bases for a VAT,” Tax Policy Center and Pew Charitable Trusts, February 2012, https://www.taxpolicycenter.org/publications/implications-different-bases-vat/full.
Share this article