Key Findings
The Institute on TaxA tax is a mandatory payment or charge collected by local, state, and national governments from individuals or businesses to cover the costs of general government services, goods, and activities. ation and Economic Policy (ITEP) released the fifth edition of its biennial study, Who Pays? A Distributional Analysis of the Tax System in All 50 States. We find six key issues with the report and its findings. They are:
-
The study isn’t focused on the distribution of taxes by income group, but rather, it is focused on how well state and local tax systems redistribute income.
-
The study includes one regressive portion of the federal income tax but fails to include any discussion of the federal income tax as a whole, even though it is highly progressive.
-
The study includes discussion of tax exporting in its explanation of property taxA property tax is primarily levied on immovable property like land and buildings, as well as on tangible personal property that is movable, like vehicles and equipment. Property taxes are the single largest source of state and local revenue in the U.S. and help fund schools, roads, police, and other services. es but doesn’t discuss tax exporting as it relates to other taxes.
-
The study ignores severance taxes and broad-based business taxes other than corporate income taxA corporate income tax (CIT) is levied by federal and state governments on business profits. Many companies are not subject to the CIT because they are taxed as pass-through businesses, with income reportable under the individual income tax. es.
-
The study refers to a problematic report completed by Standard and Poor’s to prove its point.
-
The study recommends making tax policy changes that would cause tax revenue volatility and economic harm.
Every two years, the Institute on Taxation and Economic Policy (ITEP) publishes a study called Who Pays? A Distributional Analysis of the Tax Systems in All 50 States. Yesterday, the fifth edition was released. The report “assess[es] the fairness of state and local tax systems by measuring the state and local taxes that will be paid in 2015 by different income groups as a share of their incomes.” The report’s key measure is the effective tax rate faced by various income groups when we consider state and local property, sales, excise, individual income, and corporate income taxes. Somewhat surprisingly, ITEP finds that every single state tax system is regressive, taxing lower income individuals more than they tax the wealthy.
Here are six issues we found with the latest edition of Who Pays? (Note that several of these are similar to critiques we made regarding the 2013 edition of the report, which still stand two years later.)
(1) The study isn’t focused on the distribution of taxes by income group. Instead, it’s focused on how well state and local tax systems redistribute income.
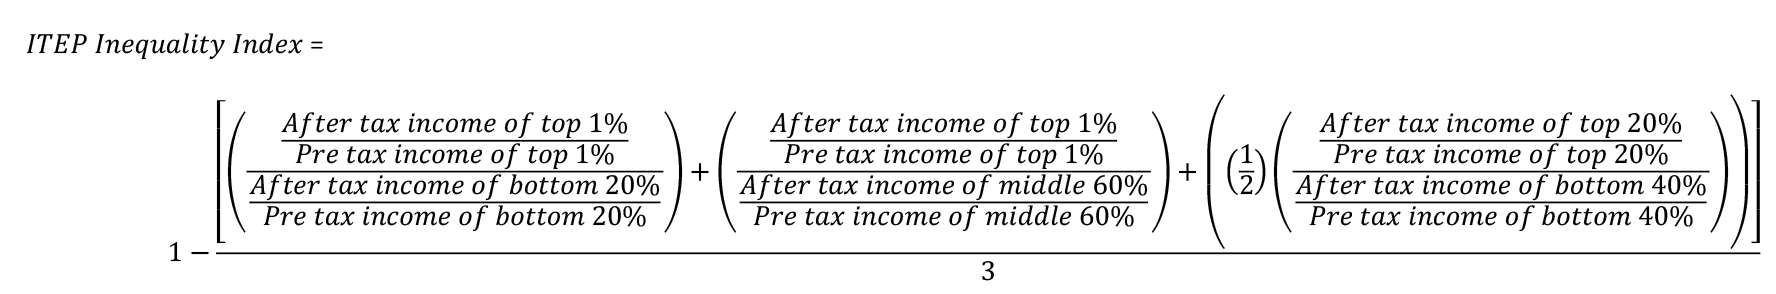
Because of what it measures, Who Pays? is better characterized as a report about whether a state’s tax code does a good job of redistributing income by making the rich less rich after taxes and the poor less poor. If the report was really about “measuring the state and local taxes . . . paid by different income groups,” ITEP would rank states by effective tax rates of the poorest residents. Instead, states are ranked based on a complex formula that compares various measures of pre- and after-tax incomeAfter-tax income is the net amount of income available to invest, save, or consume after federal, state, and withholding taxes have been applied—your disposable income. Companies and, to a lesser extent, individuals, make economic decisions in light of how they can best maximize their earnings. for various income groups. ITEP’s formula for this “Inequality Index” is below.
According to ITEP:
States with regressive taxA regressive tax is one where the average tax burden decreases with income. Low-income taxpayers pay a disproportionate share of the tax burden, while middle- and high-income taxpayers shoulder a relatively small tax burden. structures have negative tax inequality indexes, meaning that incomes are less equal in those states after state and local taxes than before. States with progressive taxA progressive tax is one where the average tax burden increases with income. High-income families pay a disproportionate share of the tax burden, while low- and middle-income taxpayers shoulder a relatively small tax burden. structures have positive tax inequality indexes; incomes are more equal after state and local taxes than before.
If the goal is to measure redistribution, the ITEP Inequality Index isn’t a good measure to use. Most tax redistribution happens at the federal level with the highly progressive federal income tax (which we’ll address in our second point, below). Any income redistribution measure needs to include the spending side, as that’s where most of the actual redistribution happens. To frame this in Robin Hood terms, the “taking from the rich” occurs predominantly on the tax side, and the “giving to the poor” occurs predominantly on the spending side. In 2013, we found that spending (federal, state, and local combined) primarily benefits the lowest income families in America. For example, the bottom 20 percent of American families received more back in total government spending than they pay in total taxes. In 2012, they received $5.28 back in government spending for every $1 they paid in taxes. The top 1 percent, conversely, received only $0.06 back in spending for every dollar of taxes paid.
Spending at both the federal and state and local level is progressive (but more so at the federal level). The point is that leaving spending out paints an incomplete picture of the government’s redistributive policies.
ITEP’s Inequality Index relies on arbitrary break points for its rankings. Is income equality achieved when the after-tax income of the top 1 percent equals the after-tax income of the bottom 1 percent? Is it when the after-tax income of the top 1 percent is equal to the after-tax income of the bottom 20 percent? If the percentage ranges in the Inequality Index formula was changed (say from top 1 percent to top 10 percent or from bottom 20 percent to bottom 30 percent), the state rankings would likely change.
The point of the ITEP report is not to actually rank the states but to showcase ITEP’s preferred tax structure in light of its conclusion that all state tax systems are regressive, even if doing so means leaving a lot of relevant contextual information out of the report and including inconsistent assumptions.
(2) Including the “federal offset” but leaving out the progressive federal income tax.
Perhaps the most problematic part of ITEP’s report is its selective inclusion of federal policy. When ITEP presents effective state and local tax rates they also include what is known as the “federal offset.” The federal income tax code allows taxpayers who itemize their deductions to claim tax payments to state and local governments as a deduction. ITEP argues that since this benefit disproportionately helps high-income taxpayers lower their total tax bill, it should be accounted for in an analysis of regressivity.
While it is true that this deduction is primarily taken by higher-income taxpayers, it is misleading to include this one regressive feature of the federal tax code in a study of state tax systems, while excluding the rest of the highly progressive federal tax code. When the federal offset is not included in the calculations of state and local effective rates, ITEP’s regressivity conclusions are much less severe. (ITEP relegates pre-federal offset effective rates in its appendices, not in its main discussion of results.)
ITEP also breaks the top quintile into three smaller income groups, making the difference between the richest and the poorest appear much more pronounced. In the charts below, we present the top quintile as a whole, rather than breaking it up into smaller income groups (breaking out the bottom 20 percent into smaller income groups and showing their effective rate would be a good compromise). Figure 1 shows the U.S. average of state and local effective tax rates, with and without the federal offset. 
Correcting these problems still produces a mildly regressive result but one far less pronounced than ITEP asserts: the difference is only 2.4 percentage points between the highest 20 percent and the lowest 20 percent, rather than the 5.5 point difference between the highest 1 percent and the lowest 20 percent originally presented in the report. Including the federal offset makes effective tax rates look more regressive than they actually are.
Related to this point, if ITEP believes it’s important to include the federal offset in the discussion of state and local taxes, it should be equally important to also include the amount of federal taxes paid by various income groups, because it provides important context for ITEP’s results. Figure 2 shows federal effective tax rates for 2013 as reported by the Urban-Brookings Tax Policy Center. Though these are a bit outdated, general trends today will be similar. These federal rates are presented alongside ITEP’s national average effective state and local tax rates by income quintile to demonstrate the high degree of progressivity of federal effective rates compared to state and local effective rates. Figure 3 shows the two types of effective rates combined to demonstrate the progressivity of the tax system as a whole—federal, state, and local combined.

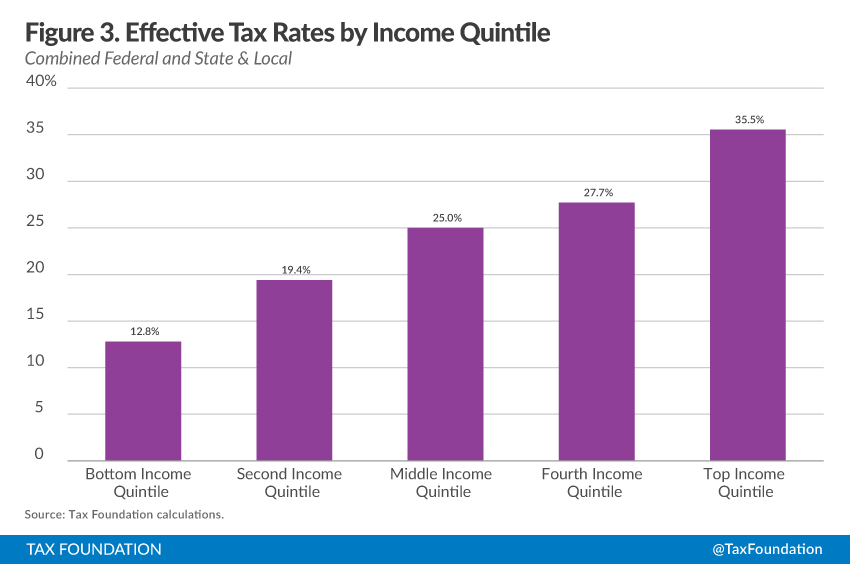
Federal effective rates are much more progressive than state and local effective rates. When the entirety of the tax system is examined, the top 20 percent of individuals pay a much larger percentage of their income in taxes than the other four income groups. ITEP should not pick and choose which federal tax policy information to include in their analysis, because doing so skews the results in favor of their desired outcome.
(3) Treatment of tax exporting.
ITEP assumes that business property taxes are partly passed on by business owners to renters, and that some of these business taxes are exported across state lines:
The business tax component reduces the regressivity of the property tax as it generally falls on owners of capital and to a significant degree is “exported” to residents of other states. On average this study finds that about 40 percent of a typical state’s property taxes fall on business (excluding the portion of apartment taxes that is assigned to renters).
However, the same logic should also apply to several other tax types. Corporate income and sales taxA sales tax is levied on retail sales of goods and services and, ideally, should apply to all final consumption with few exemptions. Many governments exempt goods like groceries; base broadening, such as including groceries, could keep rates lower. A sales tax should exempt business-to-business transactions which, when taxed, cause tax pyramiding. es are partially exported, because a portion of them are paid by businesses. However, ITEP does not assume tax exporting for any tax other than property taxes. Not accounting for a portion of the sales tax that is exported is especially problematic, because it assumes all sales taxes in a state are borne by state residents, when in fact they are likely borne by the residents of other states in the form of higher prices.
(4) Exclusion of “other taxes” from the analysis ignores significant portions of some state budgets.
Similarly, ITEP does not include taxes such as severance taxes, business license taxes, and other types of business taxes (such as gross receipts taxes and modified gross receipts taxes) in its analysis. This is problematic, because in some states, these taxes make up a significant share of the state budget and significantly alter the over distributional impact of a state’s tax system. For example, 68.7 percent of total state and local taxes in Alaska were severance taxes in fiscal year 2012 (the most recent data available). Ignoring two-thirds of a state’s tax system while making broad statements about the state’s overall regressivity does not present an accurate picture.
Similarly, several states depend on gross receipts taxes, modified gross receipts taxes, and business license taxes, but these are not included in the report. For example, in 2012, Delaware obtained over 35 percent of total taxes from taxes other than sales, income, excise, or property taxes—much of these are business license fees and Delaware’s gross receipts taxA gross receipts tax, also known as a turnover tax, is applied to a company’s gross sales, without deductions for a firm’s business expenses, like costs of goods sold and compensation. Unlike a sales tax, a gross receipts tax is assessed on businesses and apply to business-to-business transactions in addition to final consumer purchases, leading to tax pyramiding. . Again, these are an important part of some state tax codes.
These omissions are related to why Washington State is shown as the most regressive state in the nation. The Census Bureau, the main data source for state and local tax researchers, inaccurately classifies Washington’s gross receipts tax on businesses as a sales tax. This makes Washington’s sales tax collections look much higher than they actually are and thus makes ITEP allocate more taxes than it should to lower income groups in Washington. (Note that this classification of Washington’s gross receipts tax was confirmed via direct email correspondence with the Census Bureau.)
(5) Citation of Standard and Poor’s report on income inequality.
A new feature of the fifth edition of ITEP’s report is a discussion of a Standard & Poor’s (S&P) report from September 2014 linking state income inequality to state tax revenues. ITEP states:
[A] September 2014 Standard & Poor’s (S&P) study concludes that rising income inequality can make it more difficult for state tax systems to pay for needed services over time. The more income that goes to the wealthy, the slower a state’s revenue grows. Digging deeper, S&P also found that not all states have been affected in the same way by rising inequality. States that rely heavily on sales taxes tend to be hardest hit by growth income inequality, while states that rely heavily on personal income taxes don’t experience the same negative effects.
While the report does show a correlation between inequality and state tax revenue growth, these types of analyses can be riddled with confounding factors or issues that make this conclusion less clear cut. It may not be the case that inequality has a direct effect on state tax revenue in states that rely heavily on sales taxes. It may have more to do with how states structure those sales taxes and how the economy has changed over time.
A sales tax works best when it is levied evenly on all final consumption. Many states break from this ideal and have large sales tax exemptions, especially for services such as legal fees. This has had a large impact on revenue growth given that the United States’ economy has shifted away from a goods economy and more toward a service economy (see Figure 4). The result is a shrinking tax baseThe tax base is the total amount of income, property, assets, consumption, transactions, or other economic activity subject to taxation by a tax authority. A narrow tax base is non-neutral and inefficient. A broad tax base reduces tax administration costs and allows more revenue to be raised at lower rates. for state sales taxes. Coincidently, this shift has occurred at the same time that S&P has seen increasing income inequality. The S&P report may just be observing two independent trends that are happening simultaneously.

Another issue with the S&P report is that their measure of inequality is flawed. They measure inequality using IRS data on adjusted gross incomeFor individuals, gross income is the total pre-tax earnings from wages, tips, investments, interest, and other forms of income and is also referred to as “gross pay.” For businesses, gross income is total revenue minus cost of goods sold and is also known as “gross profit” or “gross margin.” (AGI), which is a narrower concept than what most of us consider income. One of the biggest issues with AGI is its treatment of investment income, or the income one earns from saving in a tax-deferred retirement account:
U.S. households have $19.8 trillion worth of pension entitlements. Every single dollar in a 401(k), Traditional IRA, or employer-sponsored plan, public or private, has never once been counted by the IRS as anyone’s income. In 2013, for example, pension funds had assets of $18.9 trillion, all of which was earned by somebody. None of that money has yet showed up on an individual tax return.
A lot of pension income accrues to individuals in middle and lower income quintiles, income that the IRS never sees. In contrast, wealthier individuals usually earn investment income that is not tax deferred and is measured by the IRS in AGI, skewing the measure of capital income toward the top. Changes in income inequality depend a lot on how you measure income. It is entirely likely that this report overstates the growth in inequality.
(6) ITEP’s idea tax system (no sales tax, very progressive income tax with lots of taxation of capital gains, and heavy reliance on individual income taxAn individual income tax (or personal income tax) is levied on the wages, salaries, investments, or other forms of income an individual or household earns. The U.S. imposes a progressive income tax where rates increase with income. The Federal Income Tax was established in 1913 with the ratification of the 16th Amendment. Though barely 100 years old, individual income taxes are the largest source of tax revenue in the U.S. es) would lead to volatile tax systems that dampen economic growth.
ITEP’s report characterizes several features of state tax systems as either regressive or progressive. States are criticized for having narrow income tax brackets that don’t tax higher income levels at high enough rates, the lack of high taxes on capital gains income, a high reliance on sales and excise taxes, or not having a state income tax. States are praised for relying little on consumption taxA consumption tax is typically levied on the purchase of goods or services and is paid directly or indirectly by the consumer in the form of retail sales taxes, excise taxes, tariffs, value-added taxes (VAT), or an income tax where all savings is tax-deductible. es, having graduated income tax structures that tax high income levels at comparatively higher rates, and using refundable tax creditA refundable tax credit can be used to generate a federal tax refund larger than the amount of tax paid throughout the year. In other words, a refundable tax credit creates the possibility of a negative federal tax liability. An example of a refundable tax credit is the Earned Income Tax Credit (EITC). s such as the Earned Income Tax CreditA tax credit is a provision that reduces a taxpayer’s final tax bill, dollar-for-dollar. A tax credit differs from deductions and exemptions, which reduce taxable income, rather than the taxpayer’s tax bill directly. s.
ITEP’s ideal tax structure would result in a state with significant year-to-year revenue volatility. Income tax revenues are more volatile than sales taxes or property taxes, and the more they rely on high-income earners, the more volatile they are. Using state and local government finance data from the Census Bureau, we analyzed the U.S. totals of various combined state and local tax revenue sources to identify the most volatile sources of tax revenue from year to year. Figure 5 shows the annual percentage change in various types of state and local tax revenues.
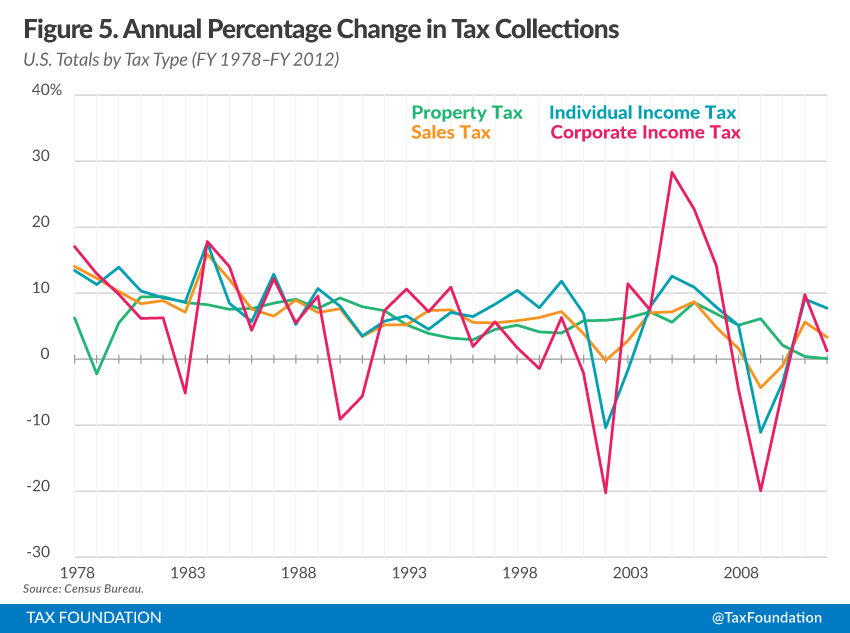
According to this Census data, the most volatile source of state and local government tax revenues in the U.S. is corporate income taxes, followed by individual income taxes, then sales taxes, then property taxes. While it is true that income tax revenues (both corporate and individual) grow faster than the economy when the economy is in an upswing, the reverse is also true: when the economy dips, these dip faster, too. ITEP’s ideal tax system relies heavily—even exclusively—on these volatile elements.
Flatter income taxes are less volatile over the business cycle, while graduated income taxes are much more unstable. ITEP praises the least regressive states that have “high reliance on PIT [personal income tax].” But depending largely on a volatile source of revenue can cause budget issues in economic downturns. Comparing 2009 and 2007 IRS data, we found that not only did the number of millionaires fall by 40 percent during the recessionA recession is a significant and sustained decline in the economy. Typically, a recession lasts longer than six months, but recovery from a recession can take a few years. , but the overall income of millionaires fell by 50 percent. The result for the U.S. Treasury was that 54 percent of the total drop in tax revenues during this period was due to the falling tax collections from millionaires. Though this example uses federal tax collections, the principle still applies to state and local governments. The more a government relies on volatile sources of revenue, the more unstable overall funding will be when the economy dips.
Another consequence of depending more on income taxes and less on sales taxes is the impact on economic growth. Two years ago, we published a review of the academic literature on the relationship between taxes and growth. Within this study, we examined the work that distinguishes between tax types—that is, what types of taxes have a larger negative growth impact. Researchers found that the taxes most harmful to growth were corporate and individual income taxes, followed by taxes on consumption. The least harmful were taxes on property. ITEP suggests states move away from sales taxes.
Conclusion
Overall, “fairness” is a subjective term and largely depends on how you define it. Despite this, there are some methodological concerns and some concerns with the way ITEP presents data that should be addressed. On top of this, it is important to point out the caveats of depending on one type of tax over another. While acknowledging the degree of progressivity or regressivity of a tax is a worthy pursuit, focusing only on that when making tax policy recommendations can lead to some undesirable economic and budgetary side effects.
Share