
Taxes can create different burdens on taxpayers of different income levels, measured by comparing taxes paid as a fraction of income. A regressive tax is one that creates a larger burden on lower-income taxpayers than on middle- or higher-income taxpayers.
What Are Some Examples of Regressive Taxes?
Two common examples of regressive taxes are consumption taxes and payroll taxes.
Consumption taxes, such as sales taxes, result in a regressive tax burden even though they typically apply the same tax rate to all taxpayers. For example, if two taxpayers both spend $10,000 throughout the year on goods that face a 5 percent sales tax, they will have both paid $500 in sales tax that year. But if the first taxpayer has an annual income of $30,000 and the second taxpayer has an annual income of $50,000, the sales tax creates a larger percentage burden on the lower-income taxpayer (1.7 percent) than the higher-income taxpayer (1.0 percent).
Payroll taxes for Social Security also have a regressive impact because they are levied as a flat rate on earnings up to a certain threshold. By excluding earnings above a certain threshold, higher-income taxpayers pay a smaller fraction of their incomes in payroll taxes. However, while in isolation the payroll tax is regressive, Social Security benefits are also tied to income levels in a progressive manner and result in an overall progressive impact over a taxpayer’s lifetime.
Taxes structured as a flat dollar amount, such as consumption taxes where everyone pays the same rate, or income taxes that truly apply a higher rate to lower-income taxpayers, can all result in a distributional effect where lower-income taxpayers pay a higher fraction of their incomes in tax than middle- or higher-income taxpayers.
How Regressive Are Excise Taxes?
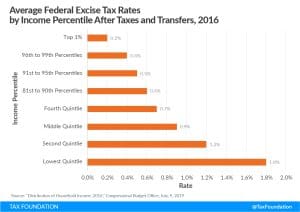
In the real world, households of different income levels don’t typically have the same levels or types of consumption. Instead, lower-income households tend to consume a larger share of their incomes than higher-income households, and they tend to consume goods that face higher levels of tax. Both factors contribute to the regressivity of certain types of excise taxes.
An excise tax is a tax imposed on a specific good or activity and is commonly levied on cigarettes, alcoholic beverages, soda, gasoline, insurance premiums, amusement activities, and betting.
In addition to spending a larger share of their incomes than higher-income households, Americans at or below the poverty line are more likely to use nicotine, which makes excise taxes on tobacco even more regressive than excise taxes in general. For example, in 2016, households in the lowest one-fifth of the income distribution faced an average federal excise tax rate nine times the average excise tax rate faced by the top 1 percent of households.
Likewise, taxes on imports (tariffs) are regressive in that they apply to consumption, and lower-income households tend to consume a greater share of their incomes than higher-income households. But they are particularly regressive because the tariff schedules tend to apply higher rates to lower-end goods than they do to luxury goods, including on many apparel and home goods items.
Level-up your tax knowledge with free educational resources—primers, glossary terms, videos, and more—delivered monthly.Stay updated on the latest educational resources.