As the reality of a second quarter of negative economic growth settles in Washington, the Congressional Budget Office (CBO) released its own sobering report on the government’s long-term finances. The CBO long-term budget outlook report shows widening deficits over the next three decades as both federal spending and taxA tax is a mandatory payment or charge collected by local, state, and national governments from individuals or businesses to cover the costs of general government services, goods, and activities. revenues are expected to rise above historic levels, with spending growth far outpacing the modest growth in tax revenues. Indeed, the Congressional Budget Office (CBO) expects federal spending to reach 30 percent of GDP by 2052, a level most associated with European nations.
These projections should give lawmakers pause as they consider creating expensive new programs to subsidize the semiconductor industry, expand health-care benefits, and fund new programs to address climate change. The CBO expects that even with the expiration of much of the Tax Cuts and Jobs Act (TCJA) in 2026 and significant new revenues generated by real bracket creep, the gulf between tax revenues and outlays will reach over 10 percent of GDP by 2052.
Meanwhile, the $280 billion in new spending and tax subsidies Congress just authorized in the Chips and Science Act will nearly cancel out the reported $300 billion in deficit reduction that supporters say will be delivered by the Inflation Reduction Act. And this does not consider the harm that the tax increases will do to the recessionary economy. As a result, the combination of both pieces of legislation will make the long-term fiscal picture even worse.
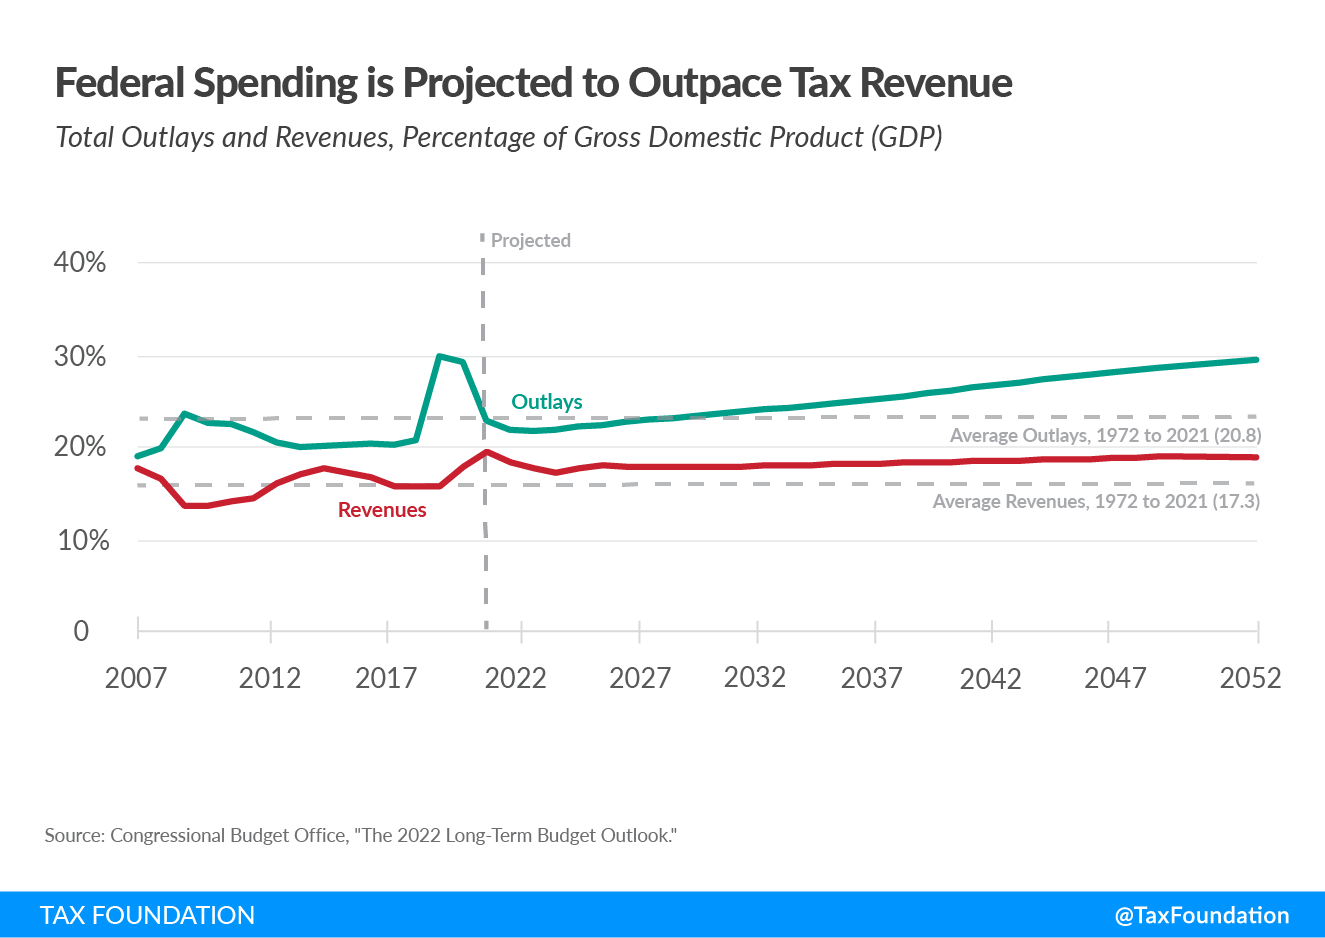
Observation #1: The gap between spending and taxes is growing, even as both are expected to rise above historic averages. Spending is the problem.
As the below chart illustrates, over the past roughly 50 years, 1972 to 2021, the gap between federal spending and tax revenues has averaged 3.5 percent of GDP. Spending has averaged 20.8 percent of GDP, while revenues averaged 17.3. Currently, the gap stands at 3.9 percent of GDP with spending well above historic averages at 23.5 percent of GDP and revenues at a near-record 19.6 percent of GDP.
While the CBO is projecting at best modest growth in tax revenues over the next three decades, it is projecting an almost linear growth in spending that will reach 30 percent of GDP by 2052. The three biggest drivers: net interest payments on the national debt, major health-care programs such as Medicare, and Social Security.
Currently, interest payments on the national debt stand at 1.6 percent of GDP. But CBO projects those payments to rise more than threefold to 7.2 percent of GDP by 2052. Thus, interest payments on the debt would eventually constitute a larger share of GDP than either Medicare or Social Security. The CBO’s estimate could be conservative if interest rates are higher in the long run than currently predicted.
Federal health-care programs are a major driver of future deficit spending. Today, these costs comprise 5.8 percent of GDP (more than Social Security) but are projected to reach 8.8 percent by 2052. Social Security, which now stands at 4.9 percent of GDP, is expected to grow to 6.4 percent over the next 30 years.
By contrast, discretionary spending—everything from national defense to transportation to education funding—is expected to total 6.0 percent of GDP. So by 2052, the federal government’s main functions will be providing health care and retirement benefits to Americans, and paying for past debts, not core functions like national security.
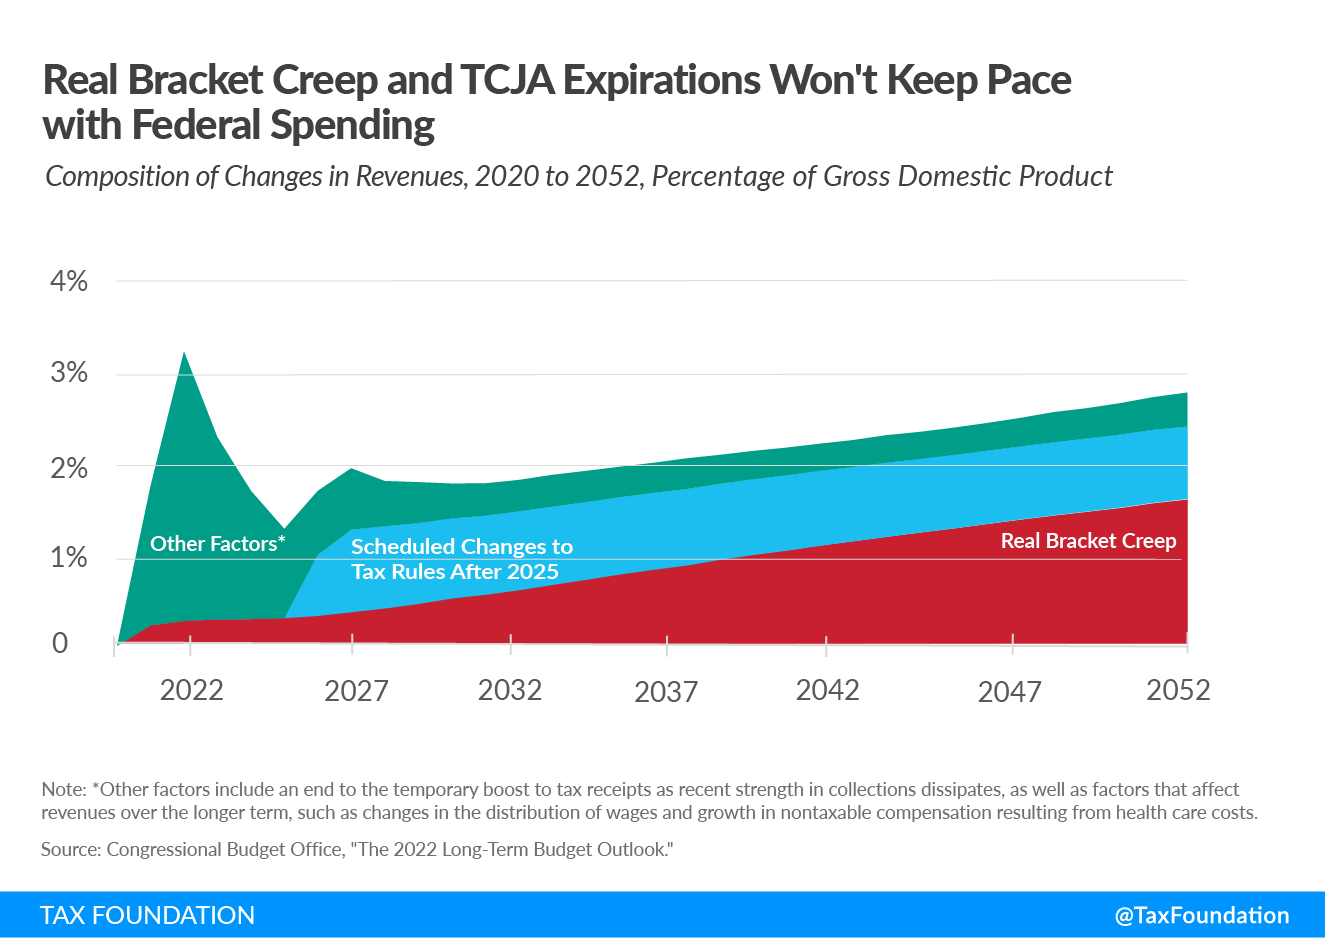
Observation #2: Real bracket creepBracket creep occurs when inflation pushes taxpayers into higher income tax brackets or reduces the value of credits, deductions, and exemptions. Bracket creep results in an increase in income taxes without an increase in real income. Many tax provisions—both at the federal and state level—are adjusted for inflation. and TCJA expiration will boost revenues modestly as a percent of GDP—but not nearly enough to keep up with rampant spending.
One of the biggest surprises considering the current state of the economy is that federal tax revenues are at a near-record level of 19.6 percent of GDP. The only other year in which revenues took more of the nation’s income was 2000, the year of the tech bubble in financial markets. Despite today’s surge in tax collections, the CBO is expecting tax revenues to dip back to their historic average level in 2025 (17.6 percent)—just before the major components of the Tax Cuts and Jobs Act (TCJA) are scheduled to expire—then gradually climbing again, reaching 19.1 percent of GDP by 2052.
The revenues generated by TCJA’s expiration—which mainly impacts the individual components of the plan—are a significant factor in keeping future revenue levels above historic norms. Indeed, the CBO estimates that TCJA’s expiration amounts to a tax increase of about 0.8 percent of GDP through 2052.
Interestingly, a more significant factor contributing to future increases in tax revenues, according to the CBO, is real bracket creep. While much of the tax code, including tax brackets, are indexed to the rate of price inflation, history indicates that wages and salaries rise faster than prices. So although the CBO is projecting that real earnings per worker will grow at roughly 1 percent per year over the next 30 years, this is enough to push tax revenues up as a share of the economy. The effect is gradual, starting at 0.3 percent of GDP, but reaches 1.6 percent by 2052.
The below table illustrates how real bracket creep can increase the amount of income taxed at higher rates while shrinking the amount taxed at lower rates. For example, the CBO estimates that in 2032, some 9 percent of taxable incomeTaxable income is the amount of income subject to tax, after deductions and exemptions. For both individuals and corporations, taxable income differs from—and is less than—gross income. will be taxed at the highest marginal tax rate of 39.6 percent (the top rate after TCJA expiration). However, because of real bracket creep, they project that 11 percent of income will be taxed at the highest rate 20 years later.
Similarly, a sizable number of lower-to-middle-income taxpayers will be paying higher taxes because of real bracket creep. We can see that the share of income taxed in the zero bracket and the share taxed in the 10 to 15 percent brackets both decline between 2032 and 2052 while the share taxed in the 20 to 35 percent brackets increases. This illustrates how real wage growth can lift taxpayers into higher brackets, quietly boosting federal coffers.
| Income Tax Rate | ||||
|---|---|---|---|---|
| 0 | 10 to 15 Percent | 20 to 35 Percent | 39.6 Percent | |
| 2032 | 26% | 37% | 29% | 9% |
| 2052 | 23% | 33% | 33% | 11% |
|
Source: Congressional Budget Office, “The 2022 Long-Term Budget Outlook,” Figure 2-8. |
||||
Observation #3: Congress appears to be worsening the deficit picture with the Chips and Science Act and the InflationInflation is when the general price of goods and services increases across the economy, reducing the purchasing power of a currency and the value of certain assets. The same paycheck covers less goods, services, and bills. It is sometimes referred to as a “hidden tax,” as it leaves taxpayers less well-off due to higher costs and “bracket creep,” while increasing the government’s spending power. Reduction Act.
Meanwhile, Congress just passed the Chips and Science Act which authorizes some $280 billion in new direct subsidies and tax credits for the semiconductor industry and related programs. Some $79 billion of this is for subsidies and tax credits between 2023 and 2027. The remaining $200 billion is authorized primarily for research purposes between 2022 and 2031.
While touted as strengthening the domestic production of computer chips and increasing national security, the bill creates a new “chip” bureaucracy and a new special interest dependent on taxpayer subsidies.
Although the bill’s $79 billion in subsidies and tax credits are authorized through 2027, Congress is prone to extending popular measures, which could likely double the cost of those initiatives over 10 years.
Next, the Senate is poised to debate the Inflation Reduction Act, which contains some $433 billion in new spending over the next decade: $369 billion for “energy security and climate change,” and $64 billion for extending Affordable Care Act (ACA) subsidies for three years.
These new spending measures are said to be offset by $739 billion in new revenues: $313 billion by enacting a new 15 percent minimum tax on corporate book income; $288 billion by allowing Medicare to negotiate prescription drug prices; $124 billion by giving the IRS more money to audit high-income taxpayers; and, $14 billion by closing the so-called carried interest loophole.
These are static estimates, however, and have not been adjusted to account for their potential impact on slowing economic growth, likely overshooting how much the bill will raise in new revenues.
Nonetheless, should the new revenues materialize as claimed, the bill is intended to deliver $300 billion in deficit reduction over the next decade. But nearly all of this deficit reduction will be offset by the $280 billion just authorized for the Chips and Science Act. The net effect on future deficits will be immaterial at best. However, if we assume that the ACA subsidies also are extended for a full 10 years, the combined legislation will surely worsen the long-term fiscal picture.
Conclusion
The latest CBO long-term budget outlook paints a troubling picture of fiscal irresponsibility. Even assuming that tax revenues remain above historic norms the next three decades, future deficits are projected to grow rapidly because of the unconstrained growth of health-care programs, Social Security, and payments on the exploding national debt. Rather than halt this rampant spending, Congress is actively adding programs that will exacerbate these long-term trends. What we need is a serious dose of fiscal sobriety, not a new spending binge.