Last week, the Congressional Budget Office (CBO) published an updated analysis of the distribution of American households’ income and tax burdens for 2017. The new CBO data reinforces existing trends in household income and taxA tax is a mandatory payment or charge collected by local, state, and national governments from individuals or businesses to cover the costs of general government services, goods, and activities. burdens, showing that the federal tax system is progressive and incomes continued to rise in 2017 as part of the broader economic expansion post-Great Recession.
While this is data from before enactment of the Tax Cuts and Jobs Act (TCJA), it can still inform us about the nature of American household income and tax burdens across the distribution.
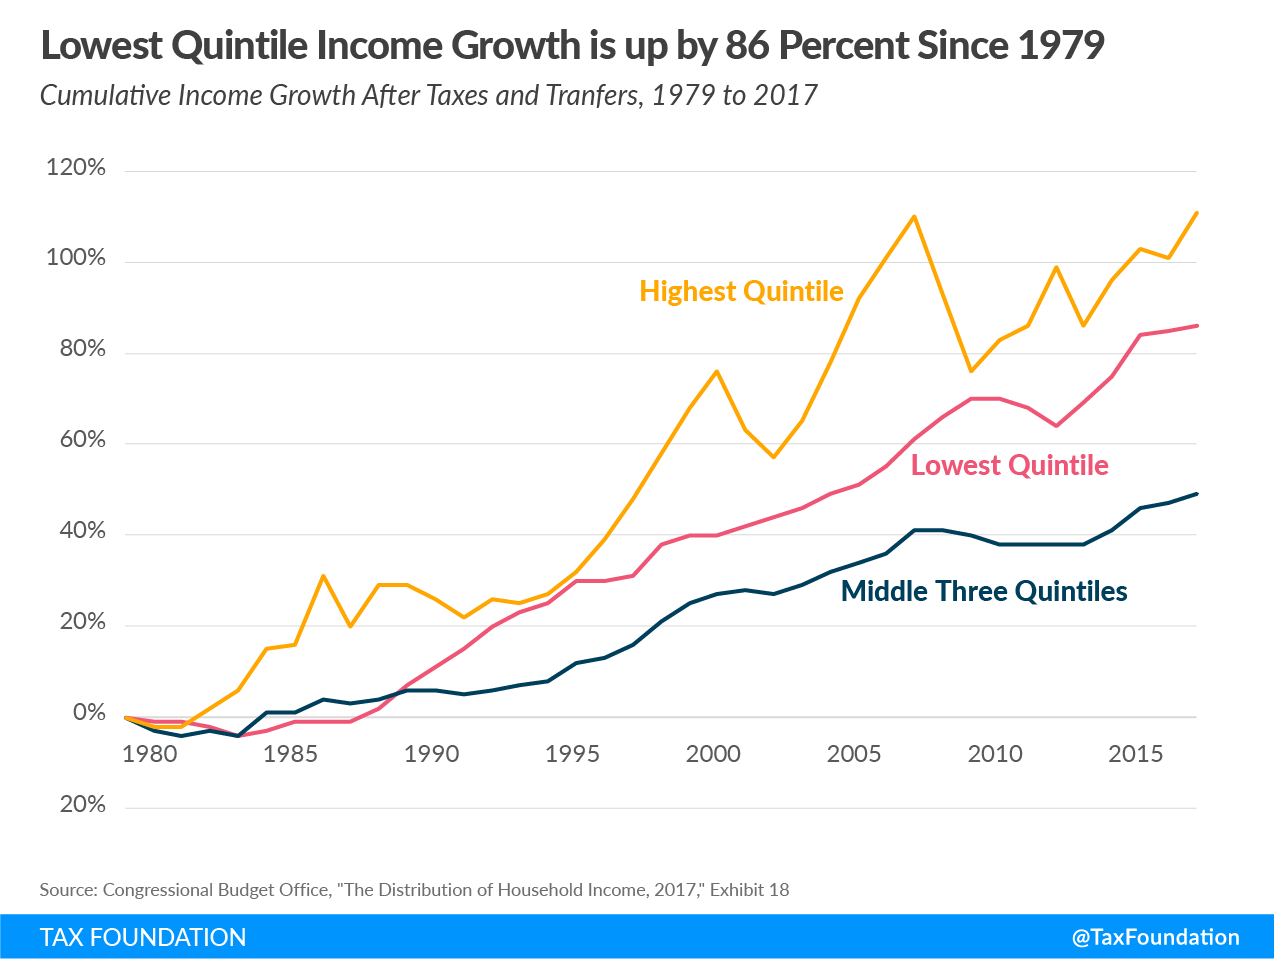
Income growth after taxes and transfers continued upward in 2017 when compared to the three previous years. Since 1979, average incomes in the lowest quintile increased by 86 percent, while average incomes for the middle three quintiles grew by about 50 percent over that time. The highest quintile’s income after taxes and transfers rose by 111 percent since 1979. The CBO data shows that labor income is the major income sources for most taxpayers, while business and investment income is a more important income source for higher earners.
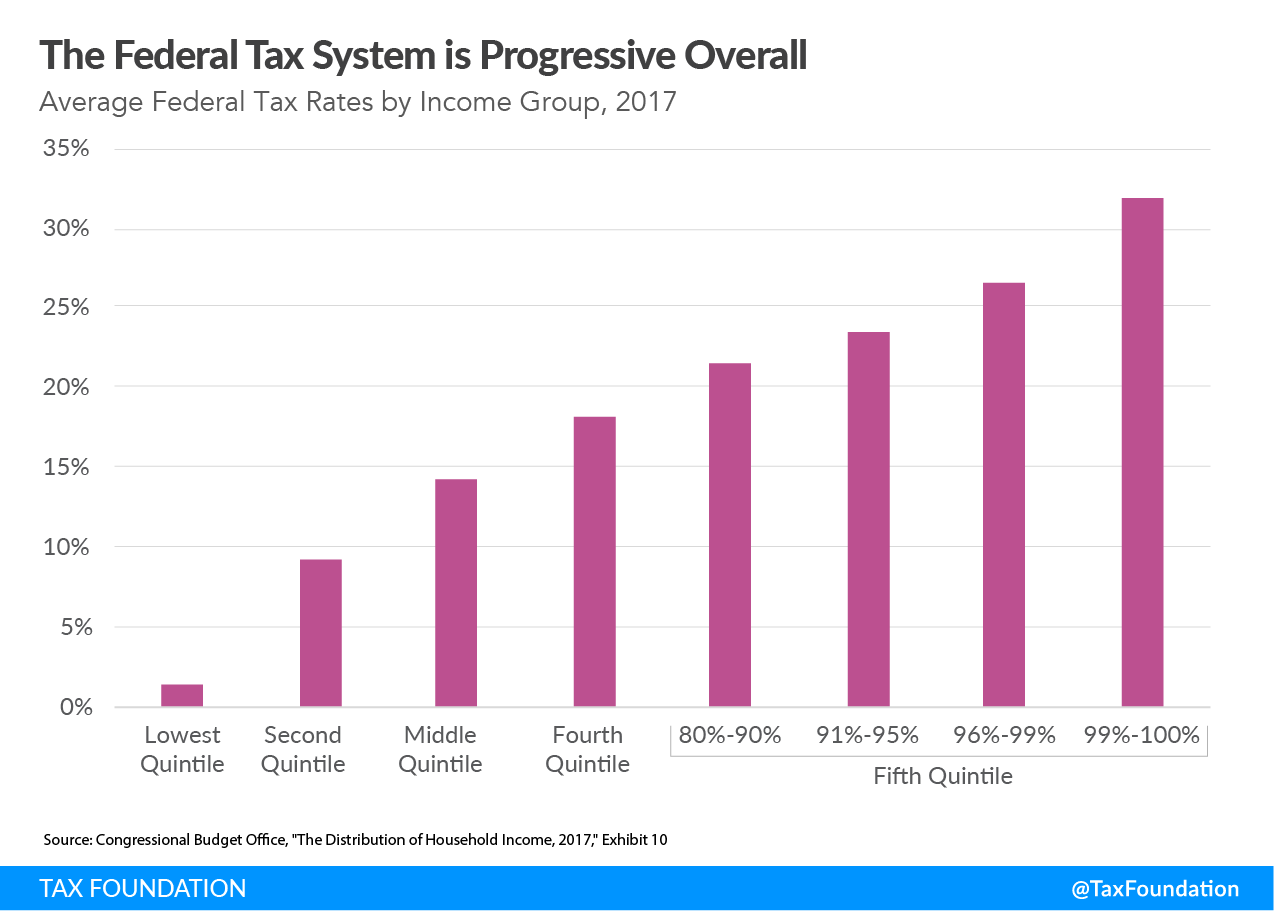
Overall, the federal tax system was progressive in 2017, applying higher effective rates going up the income spectrum. The effective federal tax rate rises from 1.3 percent for the bottom quintile to 31.6 percent for the top one percent.
The federal tax code has become more progressive over time. The effective federal tax rate for the bottom quintile averaged about 10.6 percent in the 1980s but has remained below 3 percent since 2007. In contrast, the effective federal tax rate for the top one percent has remained relatively high over this period, ranging between 25 and 35 percent since 1979.
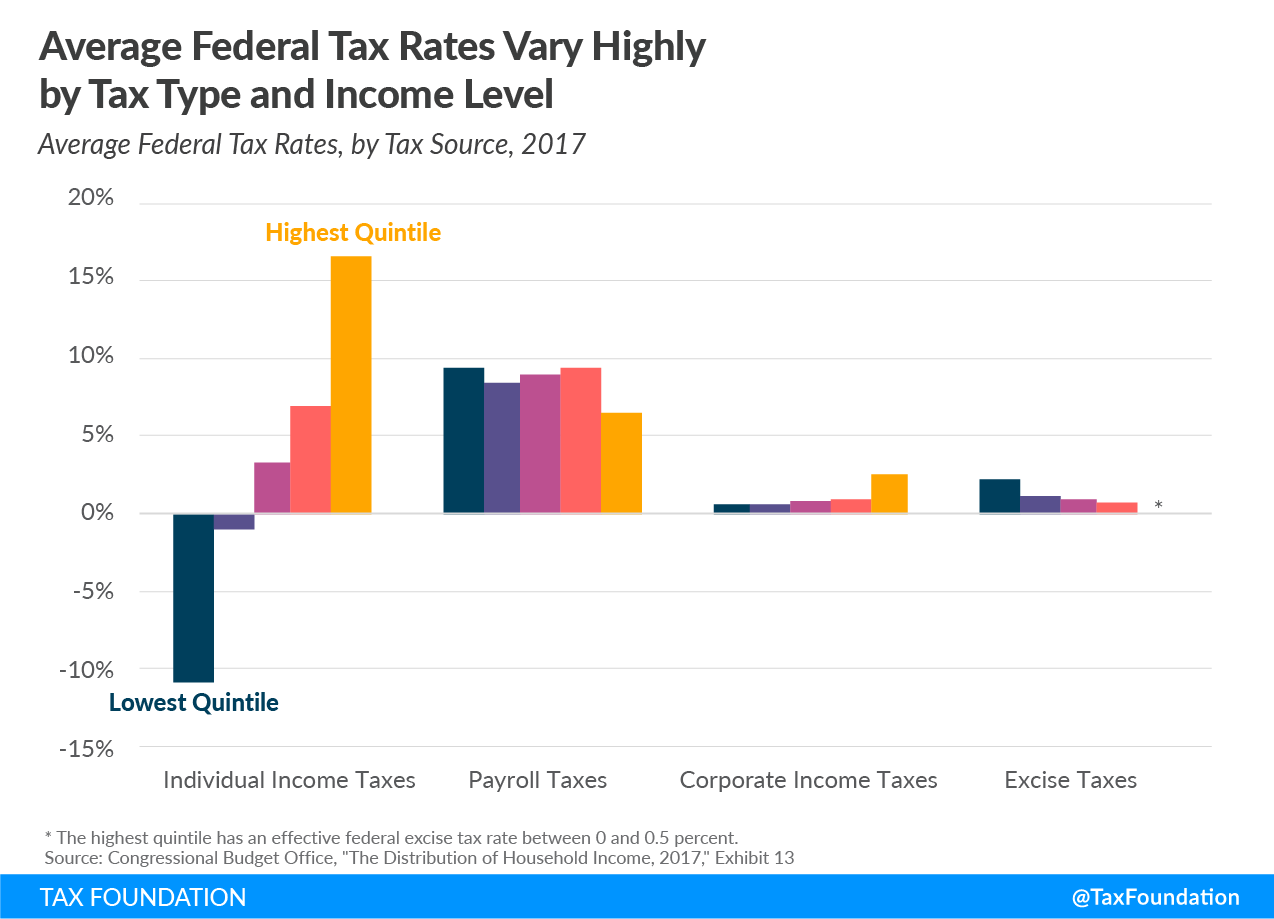
Average federal tax rates vary by revenue source. For example, individual income taxes are highly progressive, providing a negative effective tax rate for those in the bottom 20 percent due to refundable tax credits such as the Earned Income Tax CreditA tax credit is a provision that reduces a taxpayer’s final tax bill, dollar-for-dollar. A tax credit differs from deductions and exemptions, which reduce taxable income rather than the taxpayer’s tax bill directly. (EITC) and the Child Tax Credit (CTC). These credits provide refunds to filers who do not have tax liability to offset, creating a negative effective income tax rate. In fact, the lowest quintile’s average federal tax rate was -10.9 percent in 2017. In contrast, those in the top 20 percent paid an effective 16.6 percent income tax rate.
Payroll taxes, on the other hand, tend to be more evenly applied, though somewhat regressive, ranging from 9.4 percent for those in the lowest quintile to 6.5 percent for those in the top 20 percent. Excise taxes are regressive, as those in the lower quintiles pay higher effective rates than higher earners.
Corporate income taxes are borne across the income distribution, but effective rates are slightly higher for higher earners, who tend to own more corporate equities than those who earn less.
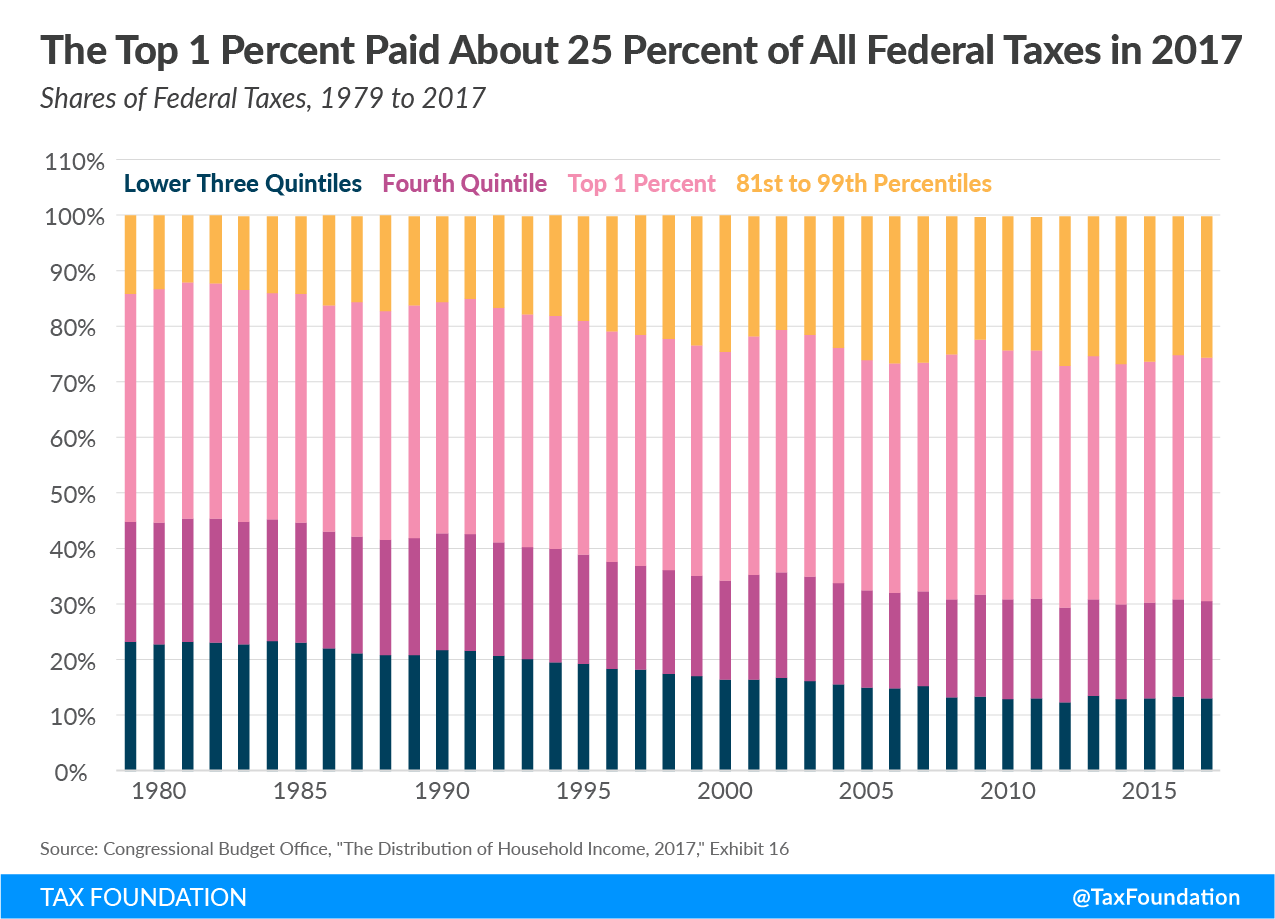
Reflecting the increasing progressivity of the federal tax code, the share of federal taxes paid by high earners has increased in recent decades. The top one percent paid 25.3 percent of all federal taxes in 2017, up from an average of 14.3 percent in the 1980s.
By contrast, the share of federal taxes paid by the bottom 60 percent fell from an average of 22.3 percent in the 1980s to 13.1 percent in 2017.
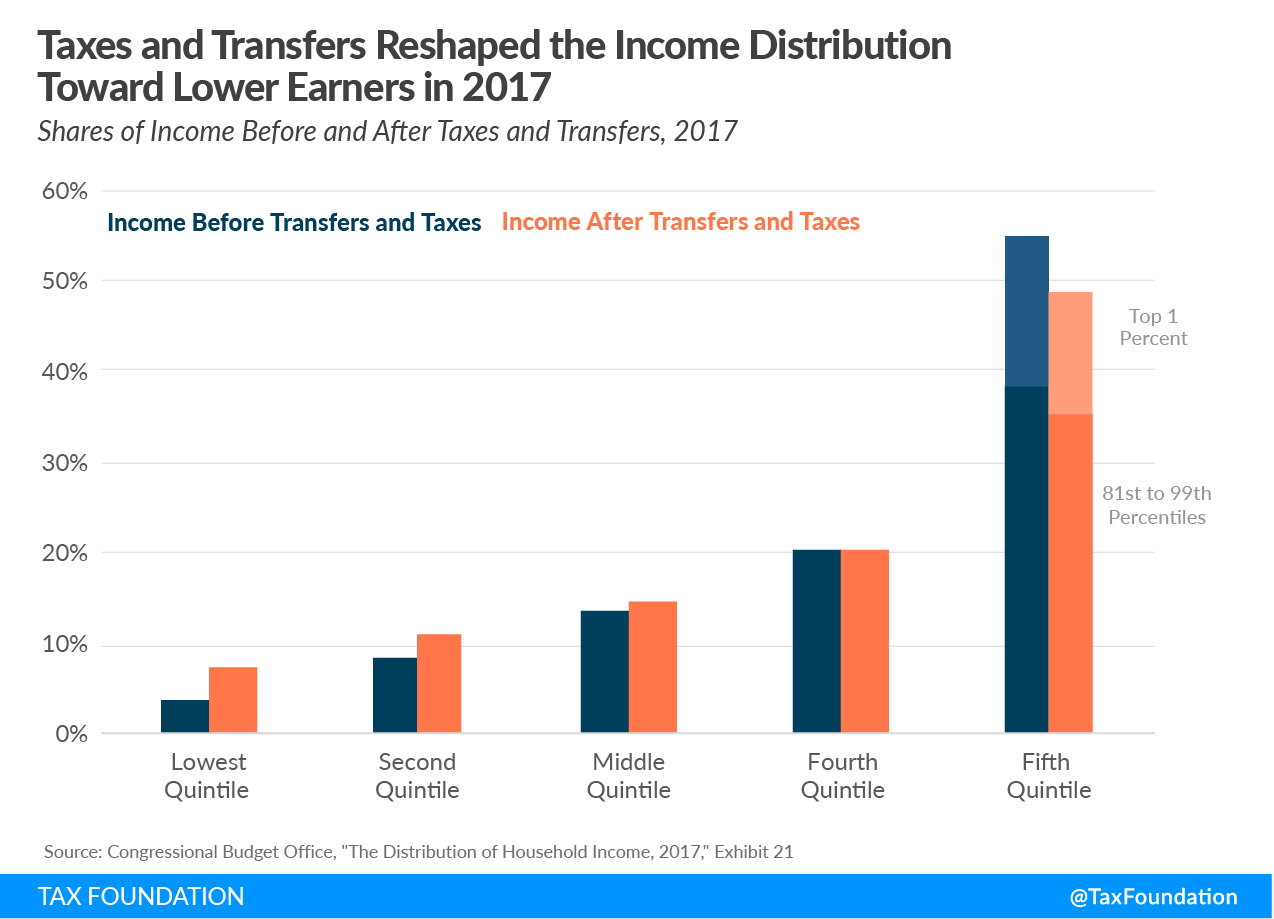
The progressive nature of the federal tax system combined with transfers to low-income Americans creates a wedge between income shares before and after transfers and taxes (see Chart 5). In 2017, Americans in the highest income quintile saw a decrease in their income share from 38.5 percent to 35.1 percent; those in the lowest quintile saw an increase in their income share from 3.7 percent to 7.5 percent, largely due to refundable tax credits and other means-tested transfers.
This data shows how the federal tax system and other means-tested transfers change the distribution of household income. Contrary to the perceptions of some, the data indicate that (1) income earned after taxes and transfers has increased over the past several decades for all income groups; (2) the federal tax system is increasingly progressive; and (3) that system relies heavily on higher earners to raise revenue for government services and means-tested transfers. These facts should be kept in mind when considering policy proposals that would increase tax burdens or reshape the distribution of existing taxation.
Share this article