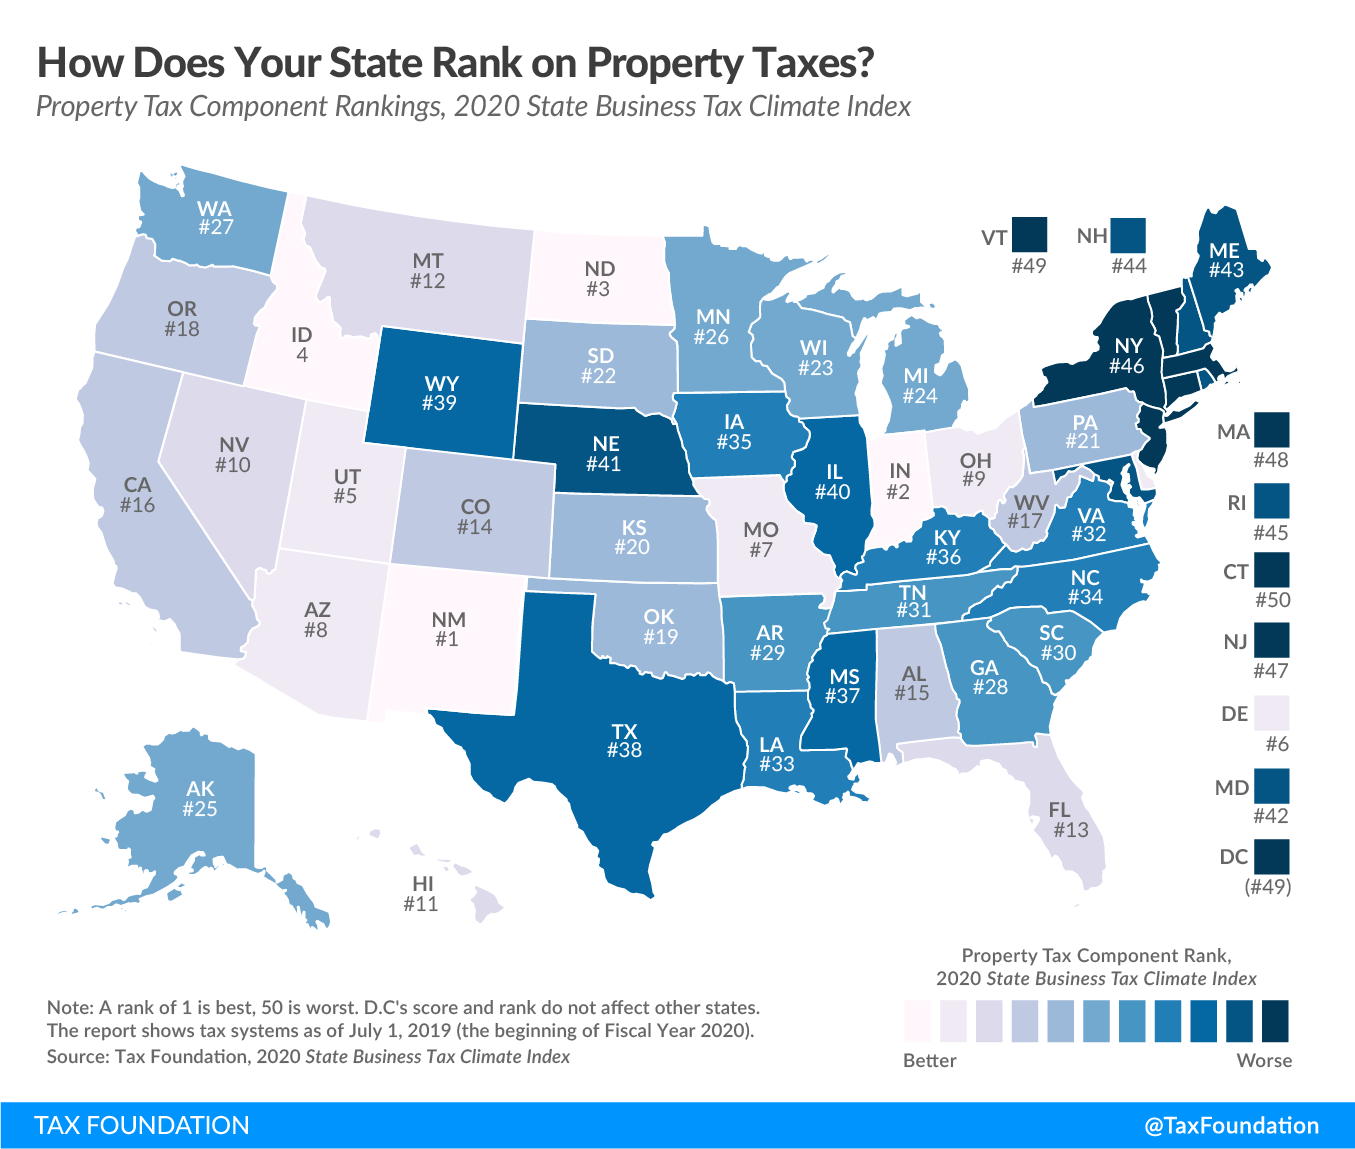
Today’s map shows states’ rankings on the property tax component of the 2020 State Business Tax Climate Index. The Index’s property tax component evaluates state and local taxes on real and personal property, net worth, and asset transfers. The property taxA property tax is primarily levied on immovable property like land and buildings, as well as on tangible personal property that is movable, like vehicles and equipment. Property taxes are the single largest source of state and local revenue in the U.S. and help fund schools, roads, police, and other services. component accounts for 16.6 percent of each state’s overall Index score.
Property taxes matter to businesses for several reasons. First, businesses own a significant amount of real property, and taxA tax is a mandatory payment or charge collected by local, state, and national governments from individuals or businesses to cover the costs of general government services, goods, and activities. rates on commercial property are often higher than the rates on comparable residential property. Many states and localities also levy taxes not only on the land and buildings a business owns but also on tangible property, such as machinery, equipment, and office furniture, as well as intangible property like patents and trademarks. Across the nation, property taxes impose one of the most substantial state and local tax burdens most businesses face. In fiscal year 2018, taxes on real, personal, and utility property accounted for 38 percent of all taxes paid by businesses to state and local governments, according to the Council on State Taxation.
Although taxes on real property tend to be unpopular with the public, a well-structured property tax generally conforms to the benefit principle (the idea in public finance that taxes paid should relate to benefits received) and is more transparent than most other taxes.
Taxes on intangible property, wealth, and asset transfers, on the other hand, are harmful and distortive. States that levy such taxes—including capital stock taxes, inventory and intangible property taxes, and estate, inheritance, gift, and real estate transfer taxes—are less economically attractive, as they create disincentives for investment and encourage businesses to make choices based on the tax code that they would not make otherwise. Businesses with valuable trademarks may seek to avoid headquartering in states with intangible property taxes, and shipping and distribution networks might be shaped by the presence or absence of inventory taxes.
States are in a better position to attract business investment when they maintain competitive real property tax rates and avoid harmful taxes on tangible personal property, intangible property, wealth, and asset transfers. This year, the states with the best scores on the property tax component are New Mexico, Indiana, North Dakota, Idaho, Utah, and Delaware. States with the worst scores in this component are Connecticut, Vermont, Massachusetts, New Jersey, New York, and Rhode Island, plus the District of Columbia.
To gauge whether your state’s property tax structure has become more or less competitive in recent years, see the table below.
|
Note: A rank of 1 is best, 50 is worst. All scores are for fiscal years. DC’s score and rank do not affect other states. Source: Tax Foundation. |
|||||
| State | 2017 Rank | 2018 Rank | 2019 Rank | 2020 Rank | Change from 2019 to 2020 |
|---|---|---|---|---|---|
| Alabama | 18 | 12 | 16 | 15 | 1 |
| Alaska | 24 | 38 | 25 | 25 | 0 |
| Arizona | 6 | 6 | 6 | 8 | -2 |
| Arkansas | 25 | 22 | 29 | 29 | 0 |
| California | 17 | 13 | 15 | 16 | -1 |
| Colorado | 16 | 14 | 14 | 14 | 0 |
| Connecticut | 50 | 49 | 50 | 50 | 0 |
| Delaware | 11 | 20 | 7 | 6 | 1 |
| Florida | 13 | 10 | 13 | 13 | 0 |
| Georgia | 23 | 23 | 27 | 28 | -1 |
| Hawaii | 9 | 16 | 11 | 11 | 0 |
| Idaho | 3 | 3 | 5 | 4 | 1 |
| Illinois | 41 | 45 | 40 | 40 | 0 |
| Indiana | 4 | 4 | 3 | 2 | 1 |
| Iowa | 35 | 39 | 35 | 35 | 0 |
| Kansas | 21 | 19 | 20 | 20 | 0 |
| Kentucky | 37 | 36 | 36 | 36 | 0 |
| Louisiana | 32 | 30 | 33 | 33 | 0 |
| Maine | 43 | 41 | 42 | 43 | -1 |
| Maryland | 44 | 42 | 43 | 42 | 1 |
| Massachusetts | 47 | 46 | 48 | 48 | 0 |
| Michigan | 26 | 21 | 24 | 24 | 0 |
| Minnesota | 29 | 28 | 26 | 26 | 0 |
| Mississippi | 36 | 35 | 37 | 37 | 0 |
| Missouri | 7 | 7 | 8 | 7 | 1 |
| Montana | 12 | 9 | 12 | 12 | 0 |
| Nebraska | 40 | 40 | 41 | 41 | 0 |
| Nevada | 10 | 8 | 10 | 10 | 0 |
| New Hampshire | 42 | 44 | 44 | 44 | 0 |
| New Jersey | 49 | 50 | 47 | 47 | 0 |
| New Mexico | 1 | 1 | 1 | 1 | 0 |
| New York | 45 | 47 | 46 | 46 | 0 |
| North Carolina | 33 | 32 | 34 | 34 | 0 |
| North Dakota | 2 | 2 | 2 | 3 | -1 |
| Ohio | 8 | 11 | 9 | 9 | 0 |
| Oklahoma | 14 | 15 | 19 | 19 | 0 |
| Oregon | 19 | 18 | 17 | 18 | -1 |
| Pennsylvania | 22 | 33 | 22 | 21 | 1 |
| Rhode Island | 46 | 43 | 45 | 45 | 0 |
| South Carolina | 27 | 24 | 30 | 30 | 0 |
| South Dakota | 20 | 25 | 21 | 22 | -1 |
| Tennessee | 31 | 29 | 31 | 31 | 0 |
| Texas | 38 | 37 | 38 | 38 | 0 |
| Utah | 5 | 5 | 4 | 5 | -1 |
| Vermont | 48 | 48 | 49 | 49 | 0 |
| Virginia | 30 | 31 | 32 | 32 | 0 |
| Washington | 28 | 27 | 28 | 27 | 1 |
| West Virginia | 15 | 17 | 18 | 17 | 1 |
| Wisconsin | 34 | 26 | 23 | 23 | 0 |
| Wyoming | 39 | 34 | 39 | 39 | 0 |
| District of Columbia | 48 | 46 | 49 | 49 | 0 |
To learn more about how we determined these rankings, read our full methodology here.
Note: This map is part of a series in which we will examine each of the five major components of our 2020 State Business Tax Climate Index.
Taxes make more sense with us in your inbox.
Subscribe to our newsletter for tax insights that cut through the noise—and make sense of it.
Sign Up