Latest Updates
- Our unemployment benefit claims tracker was archived at the end of June 2020.
- Weekly initial unemployment benefit claims added for the week ending June 20, 2020.
- Weekly initial unemployment benefit claims added for the week ending June 13, 2020.
According to Thursday’s data release, another 1,457,373 people filed initial regular unemployment benefit claims during the week ending June 20, the eleventh week of a decline in the rate of new claims, but still among the highest levels in U.S. history. (New claims peaked at 6,211,399 for the week ending April 4.) The total number of new and continued claims now stands at 19,378,655, slightly lower than the 19,885,932, in the system last week but a marked decline from the peak of 24,975,778 four weeks ago.
The Department of Labor is now reporting Pandemic Unemployment Assistance (PUA) claims as well, which are claims made by certain self-employed individuals, including subcontractors and gig economy workers, who have lost work due to the crisis and would not normally be eligible for unemployment compensation. The new data show that 11,774,521 people have applied for or are already receiving pandemic unemployment assistance. Counting federal employees, workshare, and other smaller unemployment compensation categories, this brings the total number of Americans receiving benefits to nearly 33 million, but this is almost certainly an underestimate, as PUA claims data remain incomplete.
Prior to the current crisis, the highest one-week unemployment claims as a percentage of everyone in the unemployment insurance system (those currently in “covered” employment plus those claiming benefits) was 1.36 percent, in January 1975. During the Great Recession, the one-week peak was 0.68 percent in January 2009. The peak during the current crisis, reached the week ending April 4, was 3.89 percent.
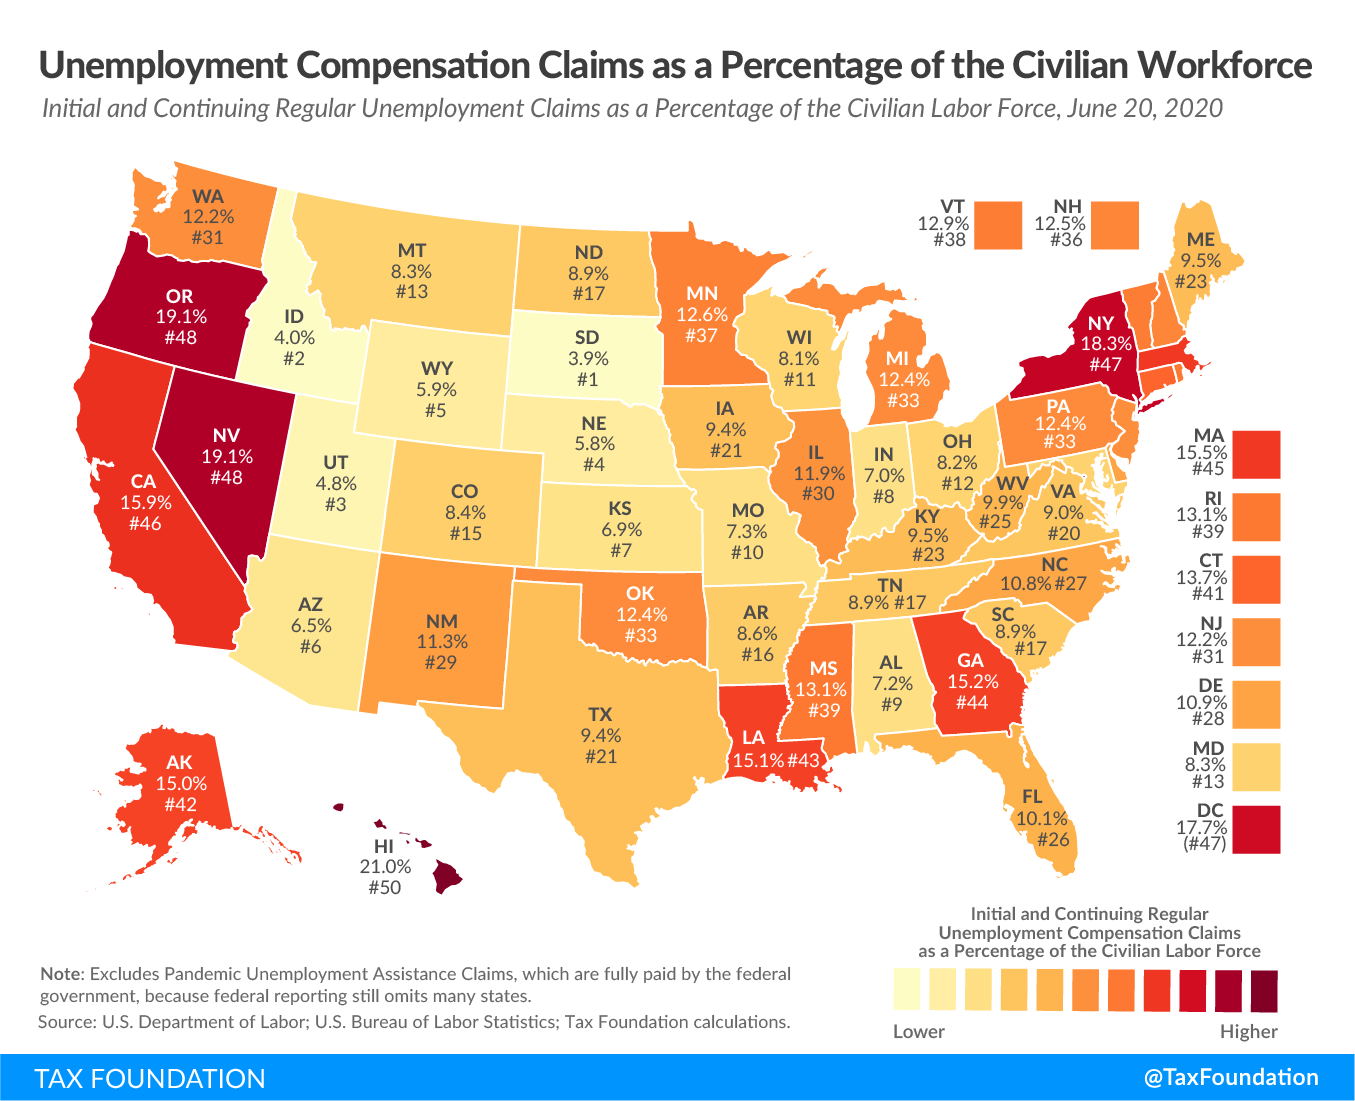
Approximately 11.7 percent of the U.S. civilian labor force has now applied for or is receiving unemployment compensation benefits (through June 6, the latest data). Counting pandemic claims, over 18.9 percent of the U.S. workforce has applied for or is receiving benefits, and this number is almost certainly too low, as federal data on pandemic claims still omits some states entirely. The previous high was 7.9 percent early in 1975 during a recessionA recession is a significant and sustained decline in the economy. Typically, a recession lasts longer than six months, but recovery from a recession can take a few years. , with a Great Recession peak of 4.8 percent between February and April 2009. Entering March 2020, unemployment claims as a percentage of the civilian labor force stood at 1.4 percent.
The map below only includes regular unemployment claims since reporting of pandemic claims is still too inconsistent to allow comparisons.
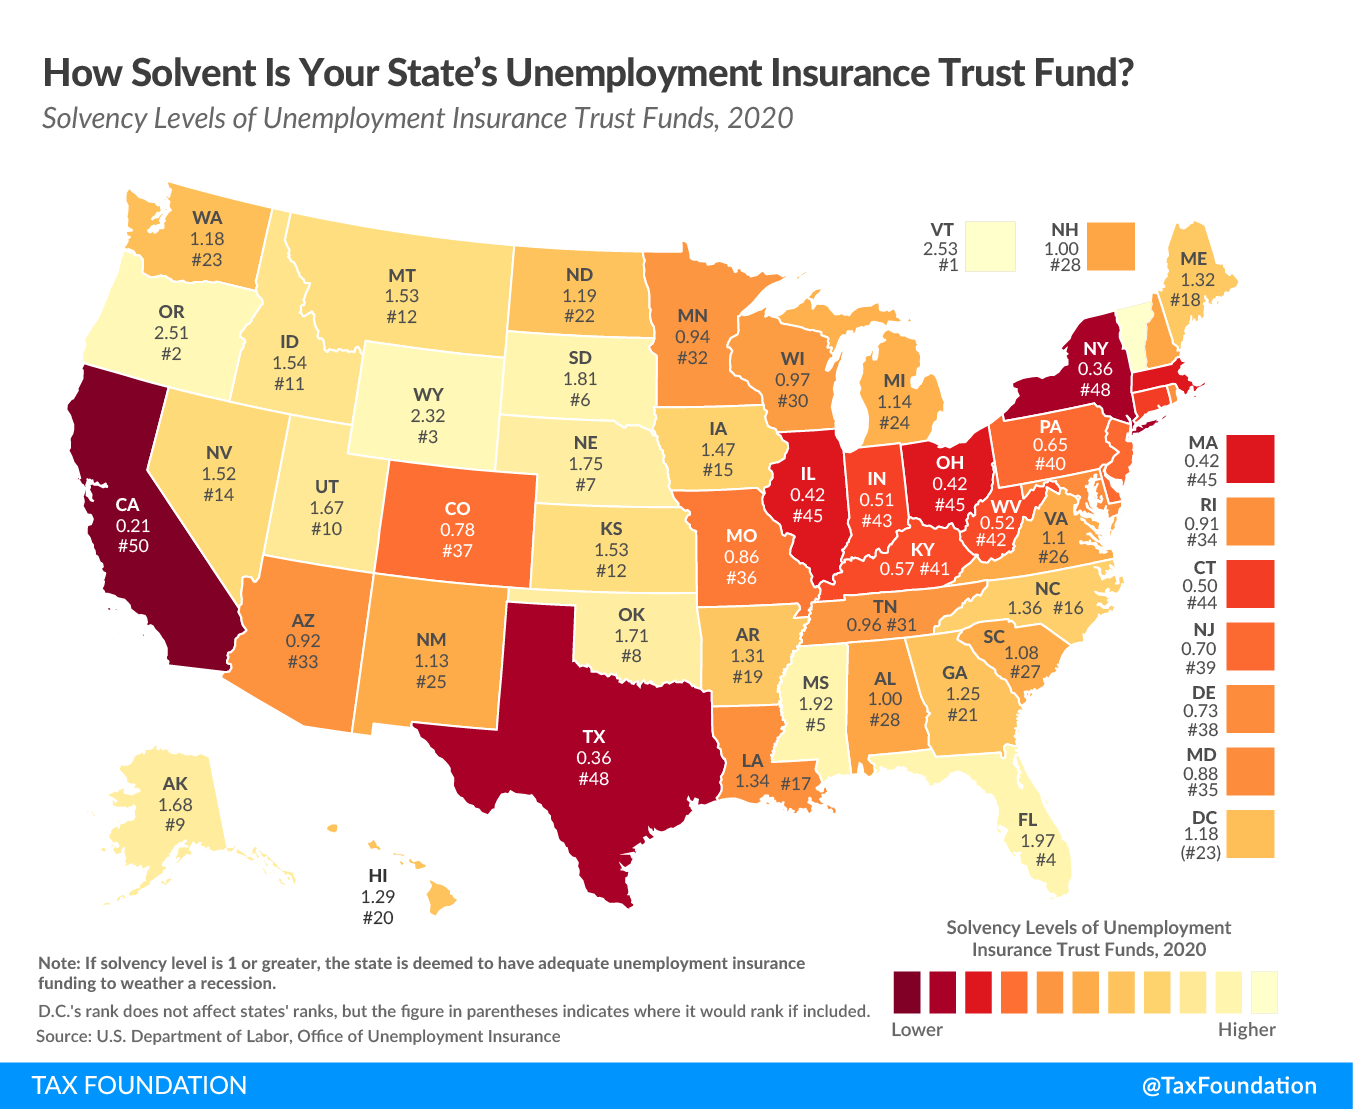
Unfortunately, many states entered the crisis with woefully inadequate unemployment compensation trust funds.
According to the Treasury Department, eleven states—California, Colorado, Connecticut, Hawaii, Illinois, Kentucky, Massachusetts, New York, Ohio, Texas, and West Virginia—have already been approved for federal loans (called Title XII Advances) in anticipation of the exhaustion of their trust funds, with five (California, Illinois, New York, Ohio, and Texas) already using those advances to pay out benefit claims. States must repay these advances (with interest starting in 2021), and if they still have outstanding balances after two years, in-state businesses will face higher federal unemployment insurance taxes to compensate for the state being in arrears.
At the same time, however, under guidance from the Treasury Department, some states have begun using funding from the $150 billion Coronavirus Relief Fund (CRF) under the CARES Act to cover unemployment benefit claims arising from the pandemic. States recently deposited their first-quarter unemployment insurance (UI) taxA tax is a mandatory payment or charge collected by local, state, and national governments from individuals or businesses to cover the costs of general government services, goods, and activities. revenues, moreover, providing a substantial infusion of revenue into their funds.
The revenue boost will not last. The way most states structure their UI taxes, most of the revenue is collected for wages paid in the first quarter of the year, making the recent revenue boosts an annual, not a regular, adjustment. Using the CRF to cover weekly payments, however, is a significant lifeline for states, where declines in weeks of reserves have slowed even as more claims enter the system and can in fact be expected to level off for a while.
States are now processing and paying out claims from self-employed filers (normally ineligible for unemployment compensation) under the Pandemic Unemployment Assistance (PUA) program as well. These claims are fully federally funded and do not impact states’ trust funds.
Mandatory business closures and shelter-in-place orders have radically accelerated job losses compared to the steadier pace of layoffs in prior recessions, meaning these claims likely represent a far greater share of the ultimate total than did any week’s claims during the Great Recession. But the numbers are still staggering, with every likelihood of sobering numbers in coming weeks as well.
Our interactive tool allows you to see how the most recent week’s initial unemployment compensation claims in each state compare to average and peak weekly claims during the Great Recession. Many states are woefully unprepared for the magnitude of the challenge ahead. Entering the crisis, 21 states’ unemployment compensation trust funds were below the minimum recommended solvency level to weather a recession. Six states had less than half the minimum recommended amount, representing 37 percent of the U.S. population.
As more firms lay off employees and unemployment increases, states’ unemployment insurance taxes will rise on businesses that can least afford to pay. As states receive federal assistance to aid with unemployment benefits, it may be appropriate to provide some measure of relief to businesses as well, particularly to the extent that their layoffs were precipitated by business closure orders.
Explore your state’s data on our interactive tool below.
| State | Great Recession, Average Weekly Claims | Great Recession, Peak Weekly Claims | 1-Week Initial Claims (ending 6/20) | % Change From Following Week |
|---|---|---|---|---|
| U.S. Total | 482,266 | 956,791 | 1,457,373 | -0.41% |
| Alabama | 6,679 | 20,894 | 18,061 | -1.67% |
| Alaska | 1,730 | 4,160 | 7,050 | 3.72% |
| Arizona | 5,922 | 11,178 | 26,786 | 19.48% |
| Arkansas | 5,077 | 10,489 | 9,135 | -2.62% |
| California | 58,695 | 95,705 | 287,354 | 19.02% |
| Colorado | 3,525 | 7,284 | 9,757 | -6.02% |
| Connecticut | 5,102 | 13,023 | 10,362 | -12.57% |
| Delaware | 1,235 | 3,051 | 2,701 | 7.35% |
| District of Columbia | 426 | 1,287 | 3,004 | -1.99% |
| Florida | 17,967 | 40,403 | 93,394 | 5.95% |
| Georgia | 14,156 | 41,522 | 124,283 | -5.84% |
| Hawaii | 1,793 | 3,211 | 7,238 | -0.14% |
| Idaho | 2,749 | 7,303 | 4,053 | 11.62% |
| Illinois | 17,760 | 34,524 | 46,005 | 2.93% |
| Indiana | 10,891 | 28,616 | 31,885 | 32.76% |
| Iowa | 5,293 | 13,865 | 8,542 | -5.81% |
| Kansas | 3,913 | 18,064 | 9,964 | 20.24% |
| Kentucky | 7,974 | 25,057 | 24,628 | -34.59% |
| Louisiana | 3,783 | 28,080 | 20,196 | -12.65% |
| Maine | 1,678 | 5,634 | 2,835 | -5.91% |
| Maryland | 5,775 | 12,031 | 31,944 | 36.22% |
| Massachusetts | 8,881 | 22,028 | 29,671 | -2.43% |
| Michigan | 22,013 | 76,702 | 18,783 | -11.79% |
| Minnesota | 6,720 | 15,195 | 20,584 | -16.65% |
| Mississippi | 3,477 | 9,420 | 15,140 | -17.75% |
| Missouri | 9,227 | 21,413 | 15,968 | -15.57% |
| Montana | 1,433 | 3,837 | 2,845 | -9.88% |
| Nebraska | 1,637 | 3,780 | 4,441 | -8.77% |
| Nevada | 4,765 | 8,945 | 13,760 | 29.57% |
| New Hampshire | 1,413 | 3,594 | 5,276 | -17.96% |
| New Jersey | 12,255 | 24,095 | 32,396 | 22.54% |
| New Mexico | 1,478 | 3,308 | 5,083 | -0.55% |
| New York | 24,033 | 54,805 | 90,186 | -5.22% |
| North Carolina | 17,175 | 56,647 | 28,463 | -11.57% |
| North Dakota | 610 | 2,332 | 2,002 | -3.42% |
| Ohio | 16,945 | 40,829 | 34,375 | 3.73% |
| Oklahoma | 2,867 | 6,196 | 49,208 | -41.96% |
| Oregon | 9,316 | 20,916 | 15,737 | -36.15% |
| Pennsylvania | 28,262 | 59,669 | 56,089 | 14.01% |
| Puerto Rico | 3,519 | 7,267 | 9,043 | 11.68% |
| Rhode Island | 1,855 | 3,987 | 3,465 | 31.20% |
| South Carolina | 7,730 | 22,548 | 17,098 | -13.88% |
| South Dakota | 463 | 1,382 | 857 | -19.53% |
| Tennessee | 8,398 | 30,753 | 21,155 | 8.97% |
| Texas | 18,092 | 49,398 | 89,241 | -5.79% |
| Utah | 2,112 | 5,205 | 4,961 | 3.29% |
| Vermont | 1,016 | 2,860 | 1,311 | -29.48% |
| Virgin Islands | 65 | 235 | 27 | -49.06% |
| Virginia | 7,098 | 21,862 | 26,072 | -4.10% |
| Washington | 11,091 | 26,075 | 34,809 | 15.20% |
| West Virginia | 1,747 | 4,368 | 3,601 | -16.78% |
| Wisconsin | 16,025 | 35,885 | 25,417 | -0.49% |
| Wyoming | 565 | 1,483 | 1,132 | -26.45% |
| Source: U.S. Bureau of Labor Statistics | ||||
| U.S. Total | 11.7% |
| Alabama | 7.2% |
| Alaska | 15.0% |
| Arizona | 6.5% |
| Arkansas | 8.6% |
| California | 15.9% |
| Colorado | 8.4% |
| Connecticut | 13.7% |
| Delaware | 10.9% |
| District of Columbia | 17.7% |
| Florida | 10.1% |
| Georgia | 15.2% |
| Hawaii | 21.0% |
| Idaho | 4.0% |
| Illinois | 11.9% |
| Indiana | 7.0% |
| Iowa | 9.4% |
| Kansas | 6.9% |
| Kentucky | 9.5% |
| Louisiana | 15.1% |
| Maine | 9.5% |
| Maryland | 8.3% |
| Massachusetts | 15.5% |
| Michigan | 12.4% |
| Minnesota | 12.6% |
| Mississippi | 13.1% |
| Missouri | 7.3% |
| Montana | 8.3% |
| Nebraska | 5.8% |
| Nevada | 19.1% |
| New Hampshire | 12.5% |
| New Jersey | 12.2% |
| New Mexico | 11.3% |
| New York | 18.3% |
| North Carolina | 10.8% |
| North Dakota | 8.9% |
| Ohio | 8.2% |
| Oklahoma | 12.4% |
| Oregon | 19.1% |
| Pennsylvania | 12.4% |
| Puerto Rico | 19.6% |
| Rhode Island | 13.1% |
| South Carolina | 8.9% |
| South Dakota | 3.9% |
| Tennessee | 8.9% |
| Texas | 9.4% |
| Utah | 4.8% |
| Vermont | 12.9% |
| Virgin Islands | |
| Virginia | 9.0% |
| Washington | 12.2% |
| West Virginia | 9.9% |
| Wisconsin | 8.1% |
| Wyoming | 5.9% |
| Source: U.S. Department of Labor; U.S. Bureau of Labor Statistics; Tax Foundation calculations. | |
| Note: Excludes Pandemic Unemployment Assistance Claims, which are fully paid by the federal government, because federal reporting still omits many states. | |
Stay informed on the tax policies impacting you.
Subscribe to get insights from our trusted experts delivered straight to your inbox.
Subscribe