Key Findings
- The TaxA tax is a mandatory payment or charge collected by local, state, and national governments from individuals or businesses to cover the costs of general government services, goods, and activities. Cuts and Jobs Act (TCJA) made changes to both the individual income and corporate income taxA corporate income tax (CIT) is levied by federal and state governments on business profits. Many companies are not subject to the CIT because they are taxed as pass-through businesses, with income reportable under the individual income tax. , while scaling back the estate and gift taxA gift tax is a tax on the transfer of property by a living individual, without payment or a valuable exchange in return. The donor, not the recipient of the gift, is typically liable for the tax. .
- Over the next decade, we estimate that the TCJA will reduce federal revenues by about $1.8 trillion on a conventional basis. In addition, we estimate that the economy would be about 2 percent larger on average than it otherwise would have been between 2018 and 2027.
- Lower tax liabilities and higher output will boost taxpayer after-tax incomeAfter-tax income is the net amount of income available to invest, save, or consume after federal, state, and withholding taxes have been applied—your disposable income. Companies and, to a lesser extent, individuals, make economic decisions in light of how they can best maximize their earnings. , but the impact will differ over time due to many provisions phasing in or expiring over the next decade.
- Using the Tax Foundation model, we estimate the distributional impact of the TCJA for each year over the next decade (2018-2027) on both a conventional and dynamic basis.
- On a conventional basis, the TCJA would result in an increase in after-tax income for taxpayers in all income groups from 2018 to 2025.
- In 2026 and 2027, the expiration of the individual income taxAn individual income tax (or personal income tax) is levied on the wages, salaries, investments, or other forms of income an individual or household earns. The U.S. imposes a progressive income tax where rates increase with income. The Federal Income Tax was established in 1913 with the ratification of the 16th Amendment. Though barely 100 years old, individual income taxes are the largest source of tax revenue in the U.S. cuts will result in a reduction of after-tax income for taxpayers in all income groups relative to prior law on a conventional basis.
- On a dynamic basis, the larger economy will result in higher after-tax incomes. However, the economic impact of the TCJA will be modest in the first few years but increase as the economic effects phase in over time.
Introduction
On December 22, 2017, President Donald Trump signed into law the bill known popularly as the “Tax Cuts and Jobs Act” (TCJA). The TCJA made changes to both the individual income and corporate income tax, while scaling back the estate and gift tax. Over the next decade, we estimate that the TCJA will reduce federal revenues by about $1.8 trillion on a conventional basis. In addition, the TCJA is projected to improve the incentives to work and invest, boosting the size of the economy. We estimate that the economy will be about 2 percent larger than it otherwise would have been between 2018 and 2027.
The reduction in tax liability will boost taxpayers’ after-tax income. However, the tax law’s impact on taxpayers each year over the next decade will vary due to the phase-in and phaseout of many provisions and, most notably, the expiration of most of the individual income tax cuts. While most taxpayers will see a tax cut in 2018, many will end up seeing a tax increase by 2027 if the individual income tax cuts expire as scheduled.
In addition, the larger economy will also mean higher incomes for taxpayers. However, the economic effects of the tax law will take time to materialize. As a result, individuals’ after-tax incomes due to higher wages and capital income will not occur immediately. Rather, they will gradually increase over the next decade.
In this paper, we use the Tax Foundation Taxes and Growth Model to provide detailed estimates of how after-tax incomes will change in each year from 2018 to 2027 for taxpayers in different income groups, both on a conventional basis and on a dynamic basis.
Overview of the Main Provisions of the Tax Cuts and Jobs Act
Individual Income Tax
The TCJA reduced statutory tax rates across the board (except for the 10 percent bracket) while slightly altering the width of tax bracketsA tax bracket is the range of incomes taxed at given rates, which typically differ depending on filing status. In a progressive individual or corporate income tax system, rates rise as income increases. There are seven federal individual income tax brackets; the federal corporate income tax system is flat. for taxpayers with taxable incomeTaxable income is the amount of income subject to tax, after deductions and exemptions. For both individuals and corporations, taxable income differs from—and is less than—gross income. over $200,000.[1] In addition, the TCJA reformed family benefits by doubling the standard deduction to $12,000 ($24,000 married filing jointly), eliminating the deduction for personal exemptions, and increasing the generosity of the Child Tax Credit from $1,000 to $2,000, while capping its refundability at $1,400. The Child Tax CreditA tax credit is a provision that reduces a taxpayer’s final tax bill, dollar-for-dollar. A tax credit differs from deductions and exemptions, which reduce taxable income rather than the taxpayer’s tax bill directly. was also expanded to high-income taxpayers by increasing income at which it begins to phase out from $75,000 ($110,000 married filing jointly) to $200,000 ($400,000 married filing jointly). The TCJA also created a nonrefundable $500 credit for non-child dependents.
The TCJA also broadened the individual income tax baseThe tax base is the total amount of income, property, assets, consumption, transactions, or other economic activity subject to taxation by a tax authority. A narrow tax base is non-neutral and inefficient. A broad tax base reduces tax administration costs and allows more revenue to be raised at lower rates. by eliminating and scaling back several itemized deductions. The state and local tax deductionA tax deduction allows taxpayers to subtract certain deductible expenses and other items to reduce how much of their income is taxed, which reduces how much tax they owe. For individuals, some deductions are available to all taxpayers, while others are reserved only for taxpayers who itemize. For businesses, most business expenses are fully and immediately deductible in the year they occur, but others, particularly for capital investment and research and development (R&D), must be deducted over time. was capped at $10,000. The home mortgage interest deduction was also scaled back so that borrowers can only deduct interest on loans with a principal balance of $750,000 (down from $1,000,000). The TCJA also eliminated the “Pease” limitation on itemized deductions.
The TCJA established a 20 percent deduction of qualified business income from certain pass-through businesses. Specific service industries, such as health, law, and professional services, are excluded. However, joint filers with income below $315,000 and other filers with income below $157,500 can claim the deduction fully on income from service industries. Individuals earning about these thresholds are also subject to additional limitations, meant to prevent abuse of the provision.
The Alternative Minimum Tax was retained, but was scaled back by increasing the exemption level and the income level at which it phases in. The exemption level was increased to $70,300 ($109,400 married filing jointly) and the phaseout of the exemptions begins at $500,000 $1 million for married filing jointly).
Tax parameters will now be adjusted based on chained CPI-U instead of CPI-U. Chained CPI-U measures inflation by considering consumers’ behavior, resulting in a measure of inflationInflation is when the general price of goods and services increases across the economy, reducing the purchasing power of a currency and the value of certain assets. The same paycheck covers less goods, services, and bills. It is sometimes referred to as a “hidden tax,” as it leaves taxpayers less well-off due to higher costs and “bracket creep,” while increasing the government’s spending power. that rises more slowly than CPI-U. As a result, individual income will tend to rise into higher tax brackets, or phase out of tax benefits such as the Child Tax Credit and the Earned Income Tax Credit more quickly.
Corporate Income Tax and other Business Provisions
The TCJA cut the corporate income tax rate from 35 percent to 21 percent and eliminated the corporate alternative minimum tax.
The TCJA also expanded expensing for all businesses (corporations and pass-through businesses) by increasing bonus depreciation from 50 percent to 100 percent for five years, while increasing the expensing cap for Section 179 from $500,000 to $1 million.
The TCJA changed the treatment of the foreign profits of multinational corporations. It introduced a “participation exemption,” which exempts foreign profits paid back to the United States from domestic taxation. It also defined two new categories of foreign income, “Global Intangible Low Tax Income” (GILTI) and “Foreign Derived Intangible Income” (FDII), which are taxed at a lower rate than the statutory corporate tax rate of 21 percent. Lastly, the TCJA introduced a new minimum tax, “The Base Erosion and Anti-Abuse Tax” (BEAT), aimed at preventing multinationals from stripping income from the U.S. tax base with excess payments to foreign-affiliated corporations.
At the same time the TCJA limited the deductibility of net interest expense to 30 percent of earnings before interest, taxes, depreciationDepreciation is a measurement of the “useful life” of a business asset, such as machinery or a factory, to determine the multiyear period over which the cost of that asset can be deducted from taxable income. Instead of allowing businesses to deduct the cost of investments immediately (i.e., full expensing), depreciation requires deductions to be taken over time, reducing their value and discouraging investment. , and amortization (EBITDA) for four years, and 30 percent of earnings before interest and taxes (EBIT) thereafter. It also eliminated net operating loss carrybacks and limited carryforwards to 80 percent of taxable income. It also eliminated the Section 199 deduction for manufacturing income and introduced many miscellaneous base broadeners.
Lastly, the TCJA doubled the estate tax exemption from $5.6 million to $11.2 million.
Many Aspects of the TCJA Will Phase Out or Expire over the Next Decade
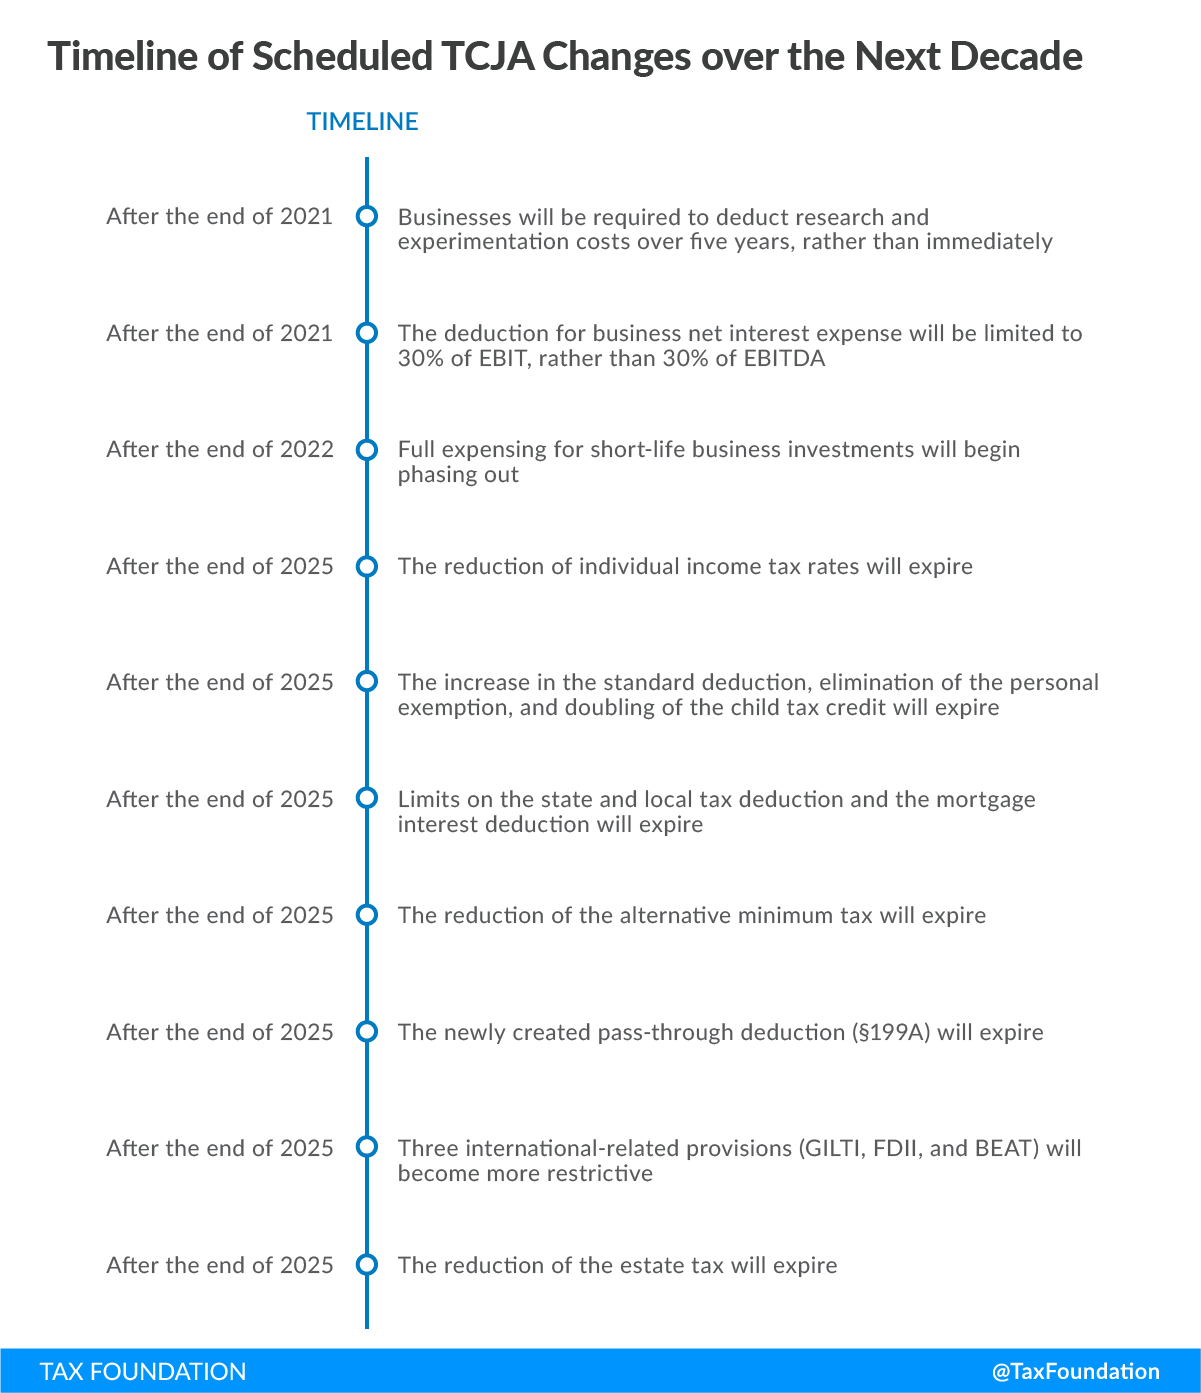
For lawmakers to satisfy Senate budget rules, while still providing a net tax cut during the decade, major portions of the TCJA were set to phase out or expire. These changes have a direct impact on the distribution of the tax changes each year. The timeline below shows how major features of the TCJA are scheduled to change over the next decade.
From 2018 until 2021, all business and individual provisions will be in effect (Figure 1). At the end of 2021, two business base broadeners will be phased in. First, businesses will no longer be able to expense research and development costs. Instead, they will need to amortize those costs over five years. Second, the limitation on interest expense will tighten from 30 percent of EBITDA to 30 percent of EBIT, a narrower definition of corporate income.
At the end of the next year (2022), 100 percent bonus depreciation will begin to phase out, further increasing tax collections from businesses. Bonus depreciationBonus depreciation allows firms to deduct a larger portion of certain “short-lived” investments in new or improved technology, equipment, or buildings in the first year. Allowing businesses to write off more investments partially alleviates a bias in the tax code and incentivizes companies to invest more, which, in the long run, raises worker productivity, boosts wages, and creates more jobs. will slowly phase out between 2023 and 2027, when the depreciation system will revert to MACRS.
At the end of 2025, a significant number of policy changes are scheduled to occur. All three of the new international provisions (GILTI, FDII, and BEAT) will change. All three scheduled changes are set to raise the tax burden on U.S. multinational corporations. The estate tax exemption will revert to pre-TCJA levels. Most significantly, however, is that nearly all the individual income tax cuts will expire. The new statutory tax rates and brackets, the standard deductionThe standard deduction reduces a taxpayer’s taxable income by a set amount determined by the government. It was nearly doubled for all classes of filers by the 2017 Tax Cuts and Jobs Act (TCJA) as an incentive for taxpayers not to itemize deductions when filing their federal income taxes. , the personal exemption, the Child Tax Credit, the Alternative Minimum Tax will all revert to pre-TCJA rates and levels. The only significant individual income tax change that will remain is the use of chained-CPI to adjust tax parameters for inflation.
Figure 1.
The Budgetary and Economic Effect of the TCJA
According to the Tax Foundation Taxes and Growth Model,[2] the Tax Cuts and Jobs Act would reduce federal revenue by $1.8 trillion over the next decade (2018-2027), excluding the revenue impact of the individual mandate repeal (Table 1). Some $1.1 trillion in the revenue loss would be due to a reduction in individual income taxes, $647 billion from the corporate income tax, and the remaining $72 billion from the estate and gift tax.
The revenue impact of the TCJA would begin large in the first few years of the decade and then decline over time as corporate and business-side base broadeners phase in and the impact of 100 percent bonus depreciation phases out. By 2026, with the expiration of the individual income tax cuts, the TCJA would end up raising federal revenue by $16 billion. The corporate income tax would continue to raise less revenue due to the permanent nature of the corporate rate reduction.
| Table 1. 10-Year Static Federal Revenue Estimate, 2018-2027 | |||||||||||
| 2018 | 2019 | 2020 | 2021 | 2022 | 2023 | 2024 | 2025 | 2026 | 2027 | 2018-2027 | |
|---|---|---|---|---|---|---|---|---|---|---|---|
| Individual Income Tax | -$149 | -$148 | -$154 | -$154 | -$163 | -$163 | -$163 | -$164 | $73 | $80 | -$1,105 |
| Corporate Income Tax | -$74 | -$73 | -$103 | -$87 | -$73 | -$57 | -$40 | -$33 | -$57 | -$50 | -$647 |
| Estate and Gift Tax | -$8 | -$8 | -$8 | -$9 | -$9 | -$9 | -$10 | -$11 | $0 | $0 | -$72 |
| Total | -$232 | -$229 | -$265 | -$250 | -$245 | -$229 | -$213 | -$208 | $16 | $30 | -$1,824 |
The Tax Foundation model also projects that the TCJA would boost the size of the economy over the next decade (Table 2). In the first few years, the economic impact will be modest as companies begin to invest more, building the capital stock. In 2018, we project the economy to be 0.3 percent over baseline and by 2020, it will be 1.4 percent over baseline. By 2025, the economy will be 3 percent over baseline—its highest point over the next decade. In 2026, when the individual provisions expire, and 100 percent bonus depreciation has fully phased out, the size of the economy will stop growing in excess of baseline and begin to shrink. By 2027, the size of the economy will be 2.8 percent larger than it otherwise would have been. On average, GDP will be about 2 percent above baseline between 2018 and 2027.
| 2018 | 2019 | 2020 | 2021 | 2022 | 2023 | 2024 | 2025 | 2026 | 2027 | |
|---|---|---|---|---|---|---|---|---|---|---|
| Source: Tax Foundation Taxes and Growth Model, April 2018 | ||||||||||
| GDP | 0.3% | 0.8% | 1.4% | 1.9% | 2.2% | 2.6% | 2.9% | 3.0% | 3.0% | 2.8% |
| Wages | 0.1% | 0.4% | 0.8% | 1.1% | 1.3% | 1.5% | 1.7% | 1.7% | 1.8% | 1.7% |
| Capital Stock | 0.7% | 1.8% | 3.0% | 4.1% | 4.8% | 5.5% | 6.1% | 6.4% | 6.3% | 5.9% |
Conventional Distributional Impact of the Tax Cuts and Jobs Act
On a conventional basis, the TCJA will result in a reduction in tax liability for taxpayers in all income groups for most of the decade. The increase in after-tax income is largest in the first few years of the decade. Over time, however, as major provisions of the TCJA begin to phase out and base broadeners begin to phase in, the size of the tax cut will decline and taxpayers will see smaller increases in after-tax income relative to the baseline. By 2026 and 2027, when the individual provisions have expired, taxpayers in most income groups will see tax increases relative to prior law.
In the first year of the TCJA (2018), after-tax income for taxpayers in all income groups will increase, on average, by 2.3 percent (Table 3). Taxpayers in the bottom quintile (0% to 20%)[3] will see a 0.8 percent increase in after-tax income. Taxpayers in the middle three income quintiles will see an increase in after-tax income between 1.5 and 1.6 percent. This represents an increase in after-tax income of $589 for taxpayers in the middle quintile (40% to 60%). The income group that will see the largest increase in after-tax income in 2018 is the top 1 percent, at 3.8 percent.
In 2022, the total size of the tax cut declines slightly from 2018, but taxpayers in the bottom four quintiles (0% to 20%, 20% to 40%, 40% to 60%, and 60% to 80%) continue to see an increase in after-tax income similar to that of 2018 (between 0.9 percent and 1.7 percent). A noticeable difference in the distribution of the tax burden is the impact on the top 1 percent. In 2022, the top 1 percent’s tax cut will decline from 3.8 percent in 2018 to 2.9 percent. This is due chiefly to the tightening of the interest deduction cap and the amortization of research and development, which reduce the size of the business tax cut.
In later years of the decade (2025), the size of the tax cut for all taxpayers will continue to decline. The average increase in after-tax income for all taxpayers in this year is 1.6 percent, which is a little more than two-thirds the total tax cut in 2018 of 2.3 percent. Taxpayers in the bottom four quintiles continue to see tax cuts on average, but they are smaller than they were in 2022 and 2018. The top 1 percent’s increase in after-tax income declines even more as bonus depreciation is nearly fully phased out.
In 2027, after the major individual provisions have expired, taxpayers, on average, will see a 0.1 percent decline in after-tax income, meaning that on average, taxpayers will be paying more in tax than before passage of the TCJA. Taxpayers in the bottom 20 percent will see a 0.2 percent reduction in after-tax income. Taxpayers in the second quintile (20% to 40%) will see the largest reduction in after-tax income of 0.5 percent (a tax increase of about $116 in 2018 dollars).
| 2018 | 2022 | 2025 | 2027 | |
|---|---|---|---|---|
| Source: Tax Foundation Taxes and Growth Model, April 2018 | ||||
| 0% to 20% | 0.8% | 0.9% | 0.7% | -0.2% |
| 20% to 40% | 1.5% | 1.4% | 1.0% | -0.5% |
| 40% to 60% | 1.6% | 1.6% | 1.3% | -0.1% |
| 60% to 80% | 1.6% | 1.7% | 1.4% | -0.2% |
| 80% to 100% | 2.6% | 2.4% | 1.8% | -0.1% |
| 80% to 90% | 1.6% | 1.7% | 1.4% | 0.0% |
| 90% to 95% | 1.8% | 1.8% | 1.4% | 0.0% |
| 95% to 99% | 2.9% | 2.8% | 2.2% | -0.3% |
| 99% to 100% | 3.8% | 2.9% | 2.1% | -0.1% |
| TOTAL | 2.3% | 2.1% | 1.6% | -0.1% |
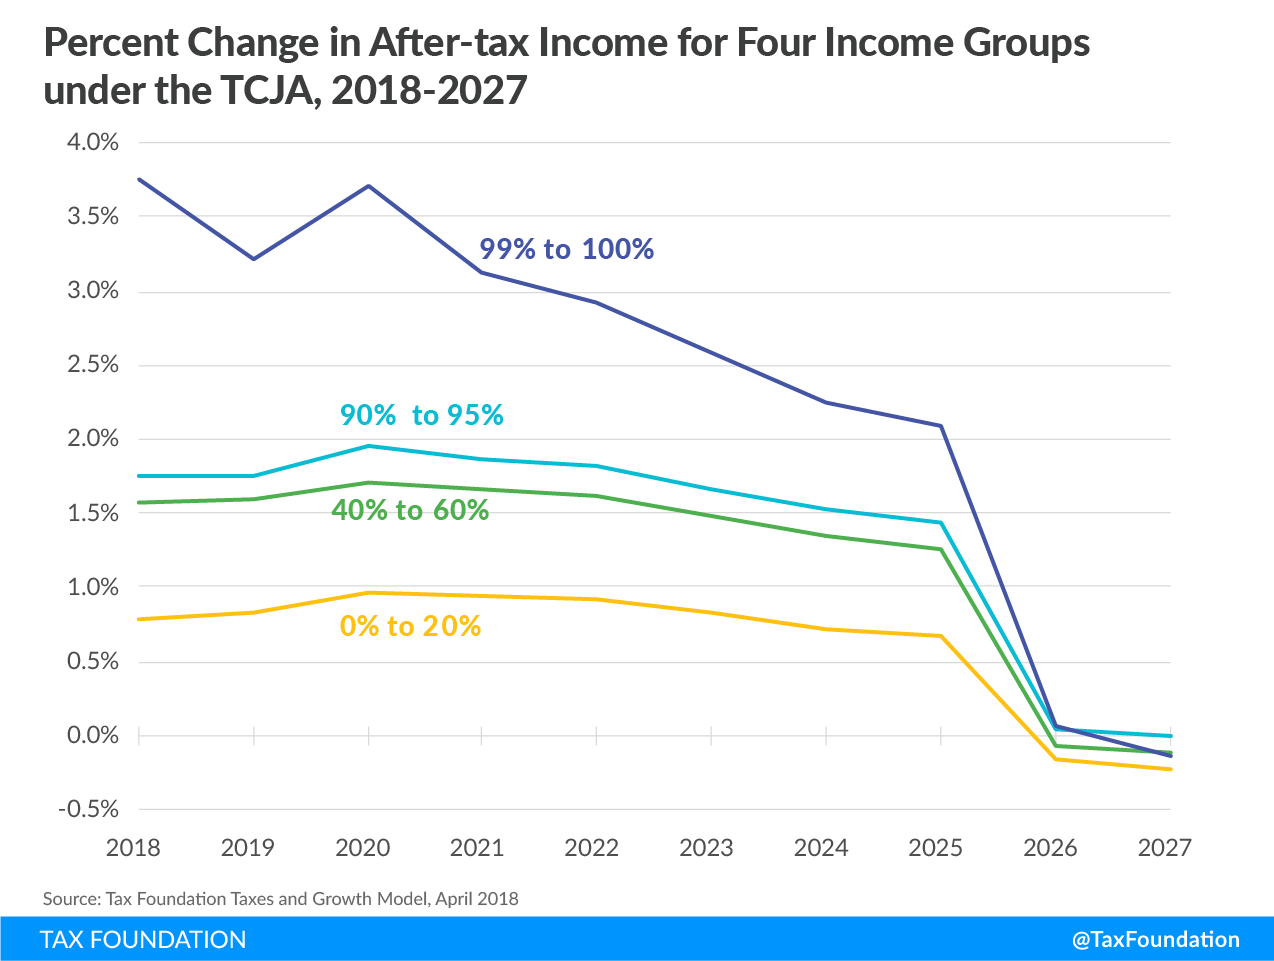
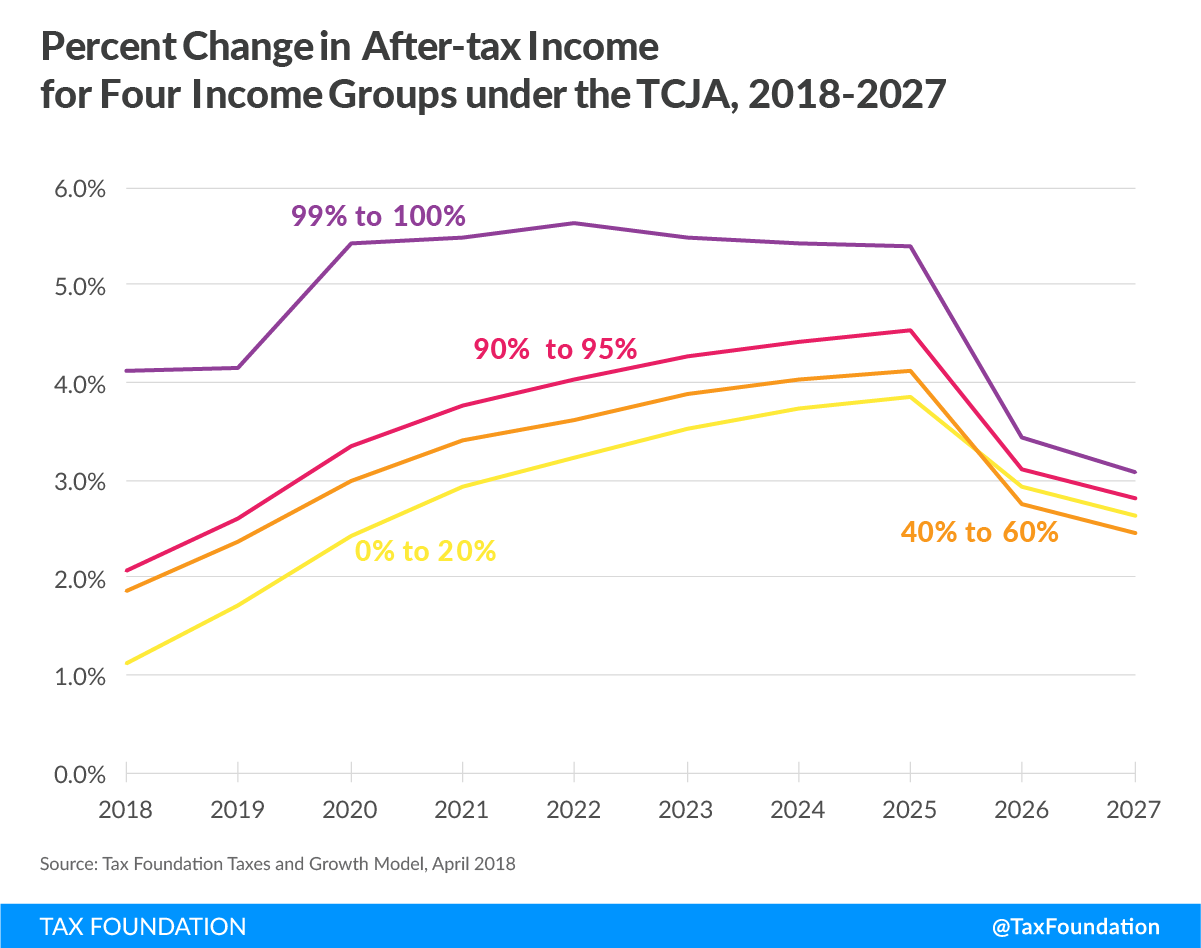
There are two notable trends in the distributional impact of the TCJA (Figure 2). First, the top 1 percent’s increase in after-tax income starts out large at first and declines significantly over the decade. The increase in the top 1 percent’s after-tax income declines from 3.8 percent in 2018 to 1.2 percent in 2025. After the individual provisions expire in 2026, the top 1 percent tax cut declines even further to a 0.1 percent increase in after-tax income. This is driven by the plan’s effect on corporate taxes. The tax cut for corporations starts out large in the first few years and declines over time as base broadeners phase in and other business provisions phase out.
Second, low-, middle-, and upper-income taxpayers’ increase in after-tax income is relatively stable while the individual income tax cuts are in effect. The benefit to these taxpayers only slightly declines between 2018 and 2025 due to the indexation of tax parameters to chained CPI-U. All three of these groups see tax increases or no change relative to previous law after all the individual parameters expire in 2026, however.
Figure 2.
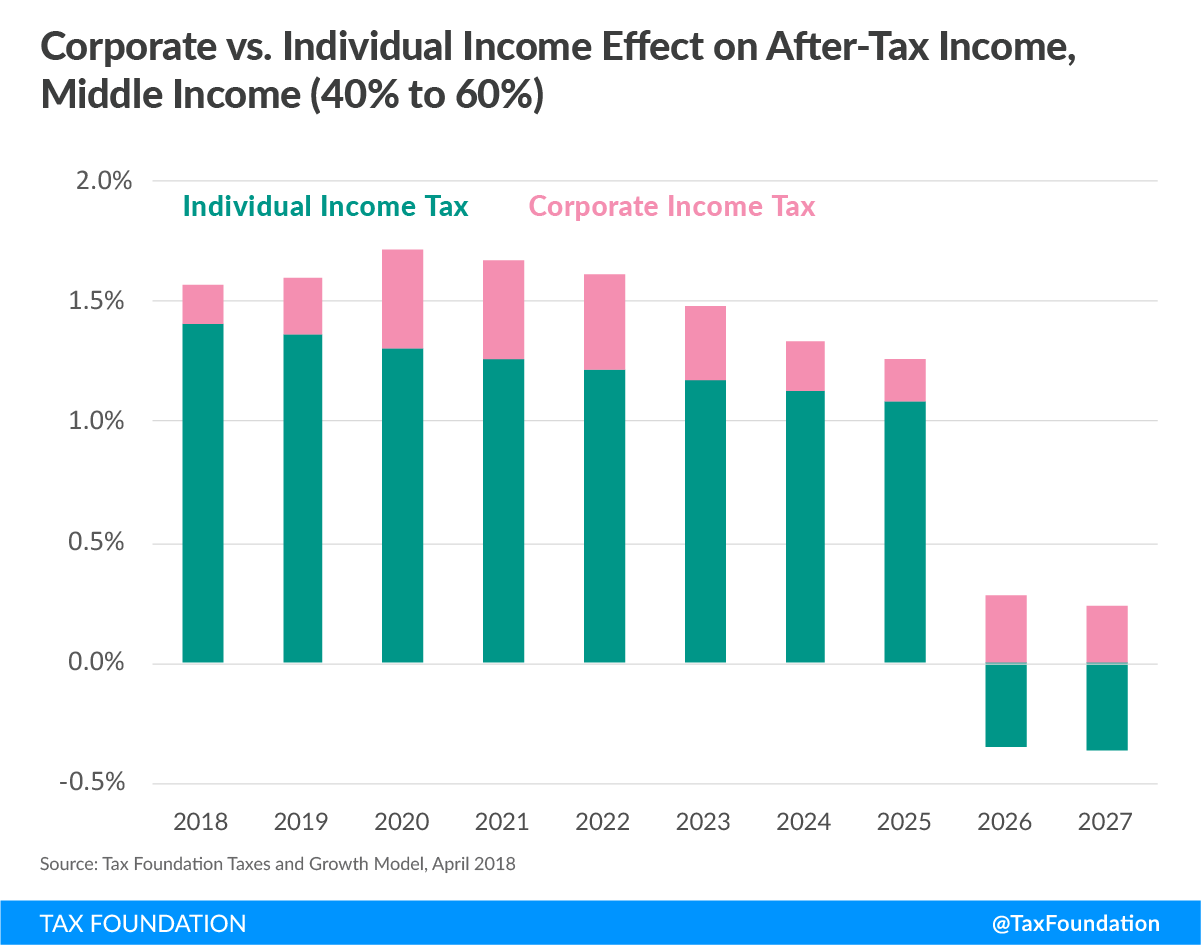
For middle-income taxpayers (those in the 40% to 60% quintile), the majority of the increase in after-tax income, on a conventional basis, for most of the decade, is due to the individual income tax cuts[4] (Figure 3). Between 2018 and 2025, the individual income tax cuts contribute between 1.1 and 1.4 to after-tax income to middle-income taxpayers’ total change in income.. Middle-income taxpayers will also receive benefits from the corporate income tax, but they are smaller than the individual income tax cuts. In 2026 and 2027, when the individual provisions expire, the tax increase from the individual income tax will outweigh the effect of the remaining corporate tax cut for these taxpayers.
Figure 3.
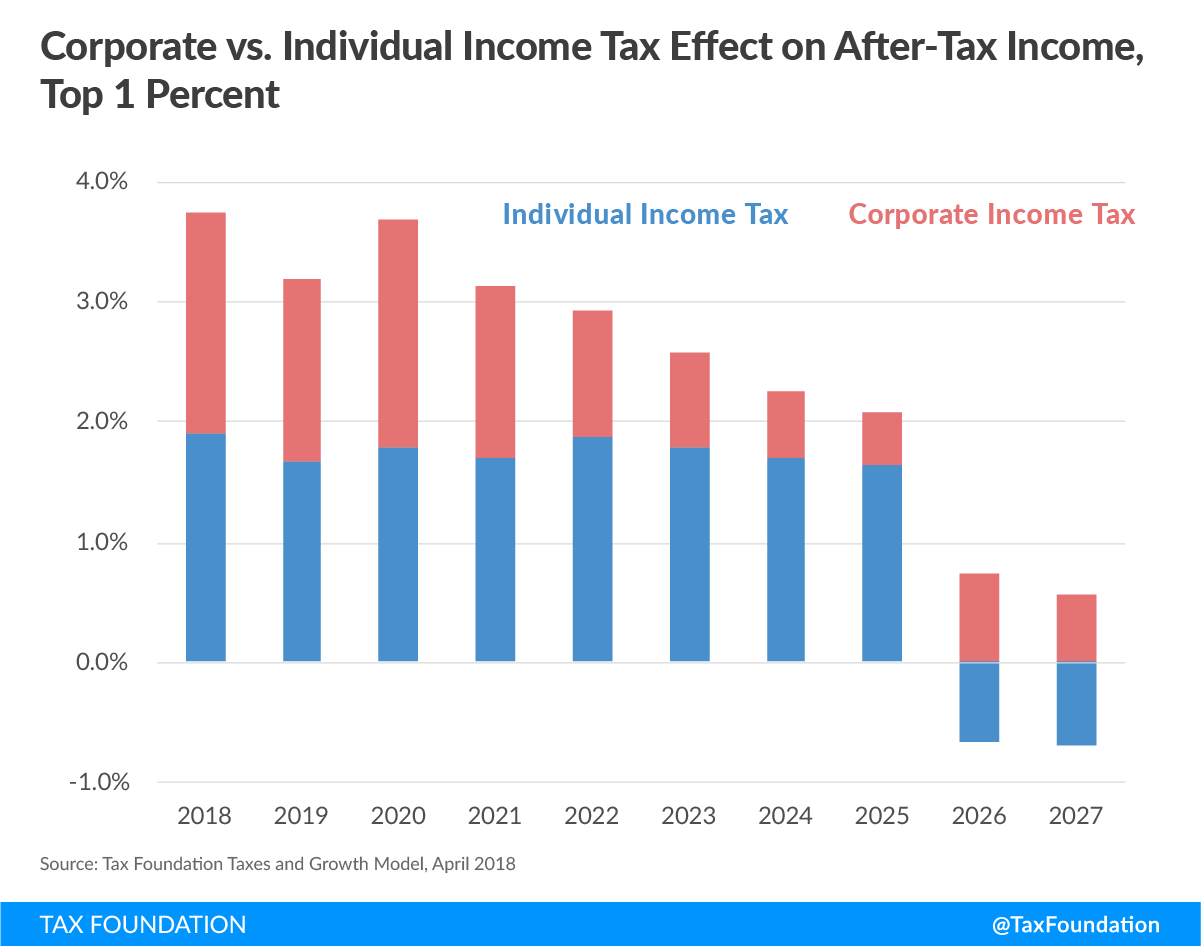
In contrast, the top 1 percent receives a meaningful boost in after-tax income from both the individual income and corporate income tax cuts on a conventional basis (Figure 4). Rather, the top 1 percent’s benefit from the TCJA is primarily through the reduction in the corporate income tax. From 2018 until 2025, before the expiration of the individual provisions of the TCJA, the top 1 percent’s increase in after-tax income from the individual income tax remains around 1.9 to 1.6 percent. In 2026 and 2027, after the individual provisions have expired, the individual income tax ends up reducing the top 1 percent’s after-tax income. In 2026, the corporate tax cut is enough to offset the individual income tax increase for the top 1 percent, but in 2027, the impact of the individual income tax increase completely offsets the impact of the corporate income tax cut.
Figure 4.
Dynamic Distributional Impact of the Tax Cuts and Jobs Act
We project that the TCJA will increase economic output over the next decade. Increased economic output will lead to higher incomes for all taxpayers. As such, our dynamic analysis shows that taxpayers will see an increase in after-tax incomes due to lower tax liabilities and higher incomes.
While the effect of lower tax liabilities on after-tax income is immediate, the increase in pretax income due to the projected larger economy takes time to materialize. As such, dynamic increases in after-tax incomes are only modestly higher than on a conventional basis in the first few years. However, by 2025, we project after-tax incomes to be meaningfully higher on a dynamic basis than on a conventional basis. And even after the expiration of the individual income tax cuts in 2026 and 2027, after-tax income remains above pre-TCJA levels.
In 2018, the dynamic distributional impact of the TCJA will look similar to the conventional impact (Table 4). After-tax incomes will be, on average, 2.6 percent higher on a dynamic basis (about 0.3 percent higher than our conventional estimates). The after-tax income of the bottom 80 percent of taxpayers will increase by 1.1 to 1.9 percent. The top 1 percent’s after-tax income will increase the most, at 4.1 percent.
By 2022, more of the economic effects of the TCJA have phased in. As a result, we project that after-tax incomes would increase by 4.3 percent (compared to the 2.1 percent increase in after-tax income on a conventional basis). In 2025, taxpayer after-tax income peaks at 4.6 percent for all taxpayers. At this point, we project that GDP will be at its highest point during the decade at about 3 percent over baseline. After-tax income for the bottom 80 percent of taxpayers (those in the bottom four quintiles) will increase by between 3.7 percent and 4.2 percent.
In 2027, after the major individual provisions have expired, after-tax income for all taxpayers will be 2.7 percent higher than otherwise. This increase in after-tax income will be due entirely to higher pretax incomes as tax liability will be slightly higher in 2027. We project the economy will be about 2.8 percent larger than it otherwise would have been in the absence of the TCJA.
| Source: Tax Foundation Taxes and Growth Model, April 2018 | ||||
| 2018 | 2022 | 2025 | 2027 | |
|---|---|---|---|---|
| 0% to 20% | 1.1% | 3.2% | 3.9% | 2.6% |
| 20% to 40% | 1.8% | 3.4% | 3.7% | 2.0% |
| 40% to 60% | 1.9% | 3.6% | 4.1% | 2.5% |
| 60% to 80% | 1.9% | 3.7% | 4.2% | 2.4% |
| 80% to 100% | 2.9% | 4.7% | 4.9% | 2.8% |
| 80% to 90% | 1.9% | 3.8% | 4.3% | 2.6% |
| 90% to 95% | 2.1% | 4.0% | 4.5% | 2.8% |
| 95% to 99% | 3.3% | 5.1% | 5.4% | 2.8% |
| 99% to 100% | 4.1% | 5.6% | 5.4% | 3.1% |
| TOTAL | 2.6% | 4.3% | 4.6% | 2.7% |
Overall, the after-tax incomes of taxpayers in most income groups will steadily rise over the next decade on a dynamic basis (Figure 5). Low-, middle-, and upper-middle-income taxpayers will see their after-tax income steadily rise over the decade until 2025. In 2026, after-tax incomes will fall slightly due to the expirations of the individual provisions of the TCJA. However, in both 2026 and 2027, after-tax incomes will still be higher than they otherwise would have been, on a dynamic basis.
Figure 5.
Conclusion
The Tax Cuts and Jobs Act cut individual and corporate income taxes. As a result, taxpayers, of every income level, will receive a tax cut in 2018 and for most of the next decade. The size of that tax cut will vary over the decade because the TCJA is scheduled to phase in certain base broadeners and phase out other provisions. Most notably, the individual income tax cuts are scheduled to expire, meaning that by the end of the decade taxpayers could see tax increases relative to previous law. However, the TCJA is also projected to boost the size of the economy. This means that taxpayers will also see higher pretax income in the form of higher wages and capital income. The higher pretax incomes will take time to materialize but will remain for at least two years after the individual income tax cuts are scheduled to expire.
Methodology
The Tax Foundation uses its General Equilibrium Model to simulate the effects of government tax and spending policies on the economy and on government revenues and budgets.[5] The model can produce both conventional and dynamic estimates of tax policy. For distributional analyses, the Tax Foundation typically measures the long-run change in the distribution of the tax burden. As such, we focus on the tax burden of individuals after a law has fully phased in, ignoring changes in tax liabilities that may occur on an annual basis. Our analyses typically focus on the percent change in after-tax income. This measures the change in living standards, or the amount of income taxpayers have available to consume.
For this analysis, we expanded the scope of our distributional tables to include the effect of phase-ins and phaseouts of provisions and economic effects that occur over the standard 10-year budget window. The result is a series of distributional tables that capture the annual change in tax liability and income for taxpayers, each year over the next 10 years.
For our conventional estimates, we hold the size of the economy constant and distribute changes in each tax to taxpayers based on our standard methodology for each year over the budget window. The individual income tax is borne entirely by those who pay it. Payroll taxes (both employer and employee-side) are fully borne by workers. The corporate tax is borne by both capital and labor and split evenly in the long run. To capture the dynamics of a corporate tax change over time, we phased in labor’s share of the corporate tax from 10 percent in the first year (90 percent to capital) to 50 percent (50 percent for capital) in the fifth year.
For dynamic estimates, we distribute both the change in tax liabilities to taxpayers plus any changes in income that arise from changes in economic output. For the most part, we distribute the tax burden using the same method we employ for the conventional tables.
To distribute the corporate income tax on a dynamic basis, we follow the same principle we use to distribute the corporate tax on a conventional basis. As such, the corporate tax falls on two types of corporate profits: super-normal returns (and the returns to land) and “normal” returns to investing. Like our conventional estimates, we distribute the portion of the corporate tax (50 percent) that falls on super-normal returns and land to taxpayers in proportion to their reported capital gains and dividend income.
In contrast to our conventional analysis, we do not distribute the tax on normal returns directly to taxpayers with wage income. Rather, the extent to which the corporate tax falls on normal returns, it impacts the incentive to invest and, thus, has an impact on the capital stock, worker productivity, and wages. This impact of the corporate tax is taken care of naturally within the dynamic model when we gross up taxpayer incomes due to higher output.
For this analysis, we also accounted for the tax windfall for old capital. When the corporate income tax rate is cut, it immediately provides a windfall gain to owners of existing capital. As such, the after-tax return on existing investment immediately increases. However, this benefit to existing capital is temporary. The higher after-tax return on investment encourages companies to invest more. The additional capital stock will drive down the after-tax return towards its original level and as it does, takes back the benefit initially provided to old capital. Once the economy has fully adjusted to the tax change, the after-tax return on physical capital has returned to its original level, implying that old physical capital benefits from the initial corporate tax rate reduction.[6]
Below is an example dynamic analysis of a 5-percentage point reduction in the corporate tax rate. The table shows the dynamic impact of the corporate income tax rate in three pieces: 1) the tax impact on super-normal returns, the returns on existing capital, and the returns to land, 2) the growth effects, or the tax impact on the normal returns to investment, and 3) the total dynamic distributional effect of the corporate rate cut. The table also includes the “split” of the tax on a dynamic basis between capital and labor as a percent of the conventionally-measured corporate tax cut and its total impact.
The first section of the table shows the distributional impact of a 5-percentage point reduction on the portion of the corporate income tax attributable to super-normal returns, the returns on land, and old capital—the portion of the corporate tax that is less sensitive to taxation and thus falls on owners of capital.[7] Due to the significantly skewed distribution of capital income, this portion of the corporate income tax is highly progressive. As such, the benefits attributable to this income chiefly benefit high-income taxpayers. For most of the decade, the top 20 percent of taxpayers receive a 0.9 percent increase in after-tax income compared to taxpayers in the bottom 80 percent, who receive a 0.1 percent increase in after-tax income. The amount going to the top declines, however, in the last year of the decade as after-tax returns are driven back closer to their original level, reducing the benefit to owners of old capital.
The second section of the table shows the increase in after-tax income due to the reduction of taxes on the normal return to investment, or the growth effects of the corporate tax. In the Tax Foundation model, the growth effects of the corporate tax are distributed to the factors on production (owners of capital and workers) based on their factor shares. Factor shares in the Tax Foundation model are fixed at 33 percent to capital and 66 percent to labor. As the table shows, the growth effects of the corporate tax are relatively flat across the income spectrum, showing a roughly proportional increase in after-tax income for each income group of about 0.1 percent in the first year (2019). The size of the impact, however, grows as corporations continue to invest and build the capital stock. By 2028, taxpayers in all groups see an increase in after-tax income, due exclusively to growth, from between 0.8 percent and 1 percent.
The third section of the table shows the overall dynamic distributional impact of a 5 percentage-point reduction in the corporate tax rate. It also shows the revenue impact of the corporate income tax in terms of after-tax income, the total impact (revenue and economic impact), and the share of the growth and revenue going to owners of capital and workers.
Overall, the dynamic distributional impact of the corporate tax over the decade has three main characteristics.
First, the benefit of a corporate rate cut skews to higher-income taxpayers. Taxpayers in the top 20 percent receive a larger increase in after-tax income than taxpayers in the bottom 20 percent, especially in the first few years. This is driven by the reduction in taxes on super-normal returns, the returns to land, and the windfall to old capital, which is skewed toward the top.
Second, the more the corporate income tax rate cut boosts economic output, the more it boosts wages and benefits taxpayers in the bottom 80 percent. In the first few years after a corporate rate reduction, companies have not fully put into service new investments. As such, the boost to wages is minor at first. By 2028, the economic effect of the corporate rate reduction has more fully phased in. As such, the boost to the after-tax income for taxpayers in the bottom 80 percent has grown to between 0.9 percent and 1 percent.
Third, the total benefit of the corporate rate cut in terms of increases in after-tax income exceeds the initial size of the corporate tax cut. Theoretically, this result makes sense. To the extent that the corporate income tax creates deadweight loss in excess of the revenue it collects, the total impact on after-tax incomes will exceed the initial revenue impact of the tax. In the table below, we show that between 2019 and 2028, the total impact of a 5-percentage point corporate rate cut on after-tax income, as a percent of the initial corporate tax cut, is between 111.0 percent in 2019 and 159.8 percent in 2028. This means that in 2028, after-tax incomes will be $1.59 higher for each dollar lost by the federal government.
| Source: Tax Foundation Taxes and Growth Model, April 2018 | ||||
| Section 1. Tax on Super-normal Returns | ||||
|---|---|---|---|---|
| 2019 | 2022 | 2025 | 2028 | |
| 0% to 20% | 0.1% | 0.1% | 0.1% | 0.1% |
| 20% to 40% | 0.1% | 0.1% | 0.1% | 0.1% |
| 40% to 60% | 0.1% | 0.1% | 0.1% | 0.1% |
| 60% to 80% | 0.1% | 0.1% | 0.1% | 0.1% |
| 80% to 100% | 0.9% | 0.9% | 0.9% | 0.8% |
| 80% to 90% | 0.2% | 0.2% | 0.2% | 0.1% |
| 90% to 95% | 0.2% | 0.2% | 0.2% | 0.2% |
| 95% to 99% | 0.5% | 0.5% | 0.5% | 0.4% |
| 99% to 100% | 2.3% | 2.4% | 2.4% | 2.0% |
| TOTAL | 0.5% | 0.5% | 0.6% | 0.5% |
| Section 2. Growth Impact (Tax on Normal Returns) | ||||
| 2019 | 2022 | 2025 | 2028 | |
| 0% to 20% | 0.1% | 0.4% | 0.6% | 0.9% |
| 20% to 40% | 0.1% | 0.3% | 0.6% | 0.8% |
| 40% to 60% | 0.1% | 0.4% | 0.6% | 0.8% |
| 60% to 80% | 0.1% | 0.4% | 0.6% | 0.8% |
| 80% to 100% | 0.1% | 0.4% | 0.7% | 0.9% |
| 80% to 90% | 0.1% | 0.4% | 0.6% | 0.8% |
| 90% to 95% | 0.1% | 0.4% | 0.7% | 0.9% |
| 95% to 99% | 0.1% | 0.4% | 0.7% | 0.9% |
| 99% to 100% | 0.1% | 0.4% | 0.7% | 1.0% |
| TOTAL | 0.1% | 0.4% | 0.6% | 0.9% |
| Section 3. Total Effect | ||||
| 2019 | 2022 | 2025 | 2028 | |
| 0% to 20% | 0.2% | 0.5% | 0.8% | 1.0% |
| 20% to 40% | 0.2% | 0.4% | 0.6% | 0.8% |
| 40% to 60% | 0.2% | 0.4% | 0.7% | 0.9% |
| 60% to 80% | 0.2% | 0.4% | 0.7% | 0.9% |
| 80% to 100% | 1.0% | 1.3% | 1.6% | 1.7% |
| 80% to 90% | 0.3% | 0.5% | 0.8% | 1.0% |
| 90% to 95% | 0.3% | 0.6% | 0.9% | 1.1% |
| 95% to 99% | 0.6% | 0.9% | 1.2% | 1.3% |
| 99% to 100% | 2.4% | 2.8% | 3.2% | 3.0% |
| TOTAL | 0.6% | 0.9% | 1.2% | 1.3% |
| Total Size of Corporate Tax Cut (% of after-tax income) | 0.6% | 0.7% | 0.9% | 0.8% |
| Share to Capital | 92.3% | 75.0% | 64.4% | 55.4% |
| Share to Labor | 18.7% | 51.9% | 73.9% | 104.4% |
| Total Impact on Income as a % of Initial Corporate Tax Cut | 111.0% | 126.9% | 138.4% | 159.8% |
Differences with Joint Committee on Taxation and Uncertainty in Modeling Estimates
Late last year, the Joint Committee on Taxation (JCT) released both revenue and distributional analyses of the Tax Cuts and Jobs Act. These estimates are similar to Tax Foundation estimates but included a few notable differences to our revenue and distributional analyses.[8] Differences in estimates can arise from differences in our models, baseline data, assumptions about the incidence of different taxes, the timing of tax revenue, and how individuals respond to tax changes.
There are three primary sources of uncertainty in modeling the provisions of the Tax Cuts and Jobs Act: the significance of deficit effects, the timing of economic effects, and expectations regarding the extension of temporary provisions.
Some economic models assume that there is a limited amount of saving available to the United States to fund new investment opportunities when taxes on investment are reduced, and that when the federal budget deficit increases, the amount of available saving for private investment is “crowded out” by government borrowing, which reduces the long-run size of the U.S. economy. While past empirical work has found evidence of crowd-out, the estimated impact is usually small. Furthermore, global savings remains high, which may explain why interest rates remain low despite rising budget deficits. We assume that global saving is available to assist in the expansion of U.S. investment, and that a modest deficit increase will not meaningfully crowd out private investment in the United States.
We are also forced to make certain assumptions about how quickly the economy would respond to lower tax burdens on investment. There is an inherent level of uncertainty here that could impact the timing of revenue generation within the budget window.[9]
Finally, we assume that temporary tax changes will expire on schedule, and that business decisions will be made in anticipation of this expiration. To the extent that investments are made in the anticipation that temporary expensing provisions might be extended, economic effects could exceed our projections.
Appendix
Full Distributional Tables
| Conventional | 2018 | 2019 | 2020 | 2021 | 2022 | 2023 | 2024 | 2025 | 2026 | 2027 |
| 0% to 20% | 0.8% | 0.8% | 1.0% | 0.9% | 0.9% | 0.8% | 0.7% | 0.7% | -0.2% | -0.2% |
| 20% to 40% | 1.5% | 1.5% | 1.6% | 1.5% | 1.4% | 1.3% | 1.1% | 1.0% | -0.4% | -0.5% |
| 40% to 60% | 1.6% | 1.6% | 1.7% | 1.7% | 1.6% | 1.5% | 1.3% | 1.3% | -0.1% | -0.1% |
| 60% to 80% | 1.6% | 1.6% | 1.8% | 1.8% | 1.7% | 1.6% | 1.5% | 1.4% | -0.1% | -0.2% |
| 80% to 100% | 2.6% | 2.4% | 2.7% | 2.3% | 2.4% | 2.1% | 1.9% | 1.8% | 0.0% | -0.1% |
| 80% to 90% | 1.6% | 1.7% | 1.8% | 2.0% | 1.7% | 1.6% | 1.5% | 1.4% | 0.1% | 0.0% |
| 90% to 95% | 1.8% | 1.8% | 2.0% | 1.9% | 1.8% | 1.7% | 1.5% | 1.4% | 0.0% | 0.0% |
| 95% to 99% | 2.9% | 2.8% | 3.1% | 2.9% | 2.8% | 2.5% | 2.3% | 2.2% | -0.2% | -0.3% |
| 99% to 100% | 3.8% | 3.2% | 3.7% | 3.1% | 2.9% | 2.6% | 2.3% | 2.1% | 0.1% | -0.1% |
| TOTAL | 2.3% | 2.2% | 2.5% | 2.2% | 2.1% | 1.9% | 1.7% | 1.6% | 0.0% | -0.1% |
| Dynamic | ||||||||||
| 0% to 20% | 1.1% | 1.7% | 2.4% | 2.9% | 3.2% | 3.5% | 3.7% | 3.9% | 2.9% | 2.6% |
| 20% to 40% | 1.8% | 2.3% | 2.8% | 3.2% | 3.4% | 3.6% | 3.7% | 3.7% | 2.3% | 2.0% |
| 40% to 60% | 1.9% | 2.4% | 3.0% | 3.4% | 3.6% | 3.9% | 4.0% | 4.1% | 2.7% | 2.5% |
| 60% to 80% | 1.9% | 2.4% | 3.0% | 3.5% | 3.7% | 4.0% | 4.1% | 4.2% | 2.7% | 2.4% |
| 80% to 100% | 2.9% | 3.3% | 4.2% | 4.3% | 4.7% | 4.8% | 4.9% | 4.9% | 3.1% | 2.8% |
| 80% to 90% | 1.9% | 2.4% | 3.1% | 3.7% | 3.8% | 4.1% | 4.2% | 4.3% | 2.9% | 2.6% |
| 90% to 95% | 2.1% | 2.6% | 3.4% | 3.8% | 4.0% | 4.3% | 4.4% | 4.5% | 3.1% | 2.8% |
| 95% to 99% | 3.3% | 3.7% | 4.6% | 4.9% | 5.1% | 5.3% | 5.3% | 5.4% | 3.1% | 2.8% |
| 99% to 100% | 4.1% | 4.2% | 5.4% | 5.5% | 5.6% | 5.5% | 5.4% | 5.4% | 3.4% | 3.1% |
| TOTAL | 2.6% | 3.0% | 3.8% | 4.1% | 4.3% | 4.4% | 4.5% | 4.6% | 3.0% | 2.7% |
| Static | 2018 | 2019 | 2020 | 2021 | 2022 | 2023 | 2024 | 2025 | 2026 | 2027 |
| 0 – 5,000 | 0.6% | 0.7% | 0.9% | 0.9% | 0.8% | 0.7% | 0.5% | 0.5% | 0.4% | 0.3% |
| 5,000 – 10,000 | 0.7% | 0.7% | 0.9% | 0.9% | 0.9% | 0.8% | 0.7% | 0.7% | 0.1% | 0.1% |
| 10,000 – 20,000 | 0.9% | 1.0% | 1.1% | 1.1% | 1.0% | 1.0% | 0.9% | 0.8% | -0.2% | -0.3% |
| 20,000 – 30,000 | 1.3% | 1.4% | 1.5% | 1.4% | 1.4% | 1.3% | 1.1% | 1.1% | -0.4% | -0.5% |
| 30,000 – 40,000 | 1.7% | 1.7% | 1.8% | 1.8% | 1.7% | 1.6% | 1.4% | 1.4% | -0.3% | -0.4% |
| 40,000 – 50,000 | 1.7% | 1.8% | 1.9% | 1.9% | 1.8% | 1.7% | 1.6% | 1.5% | -0.2% | -0.2% |
| 50,000 – 75,000 | 1.7% | 1.7% | 1.8% | 1.8% | 1.7% | 1.6% | 1.5% | 1.4% | -0.2% | -0.2% |
| 75,000 – 100,000 | 1.8% | 1.8% | 1.9% | 1.9% | 1.8% | 1.7% | 1.6% | 1.5% | -0.1% | -0.2% |
| 100,000 – 150,000 | 1.5% | 1.6% | 1.7% | 1.6% | 1.6% | 1.4% | 1.3% | 1.2% | -0.3% | -0.4% |
| 150,000 – 200,000 | 1.9% | 1.8% | 2.0% | 1.9% | 1.8% | 1.7% | 1.5% | 1.4% | 0.0% | -0.1% |
| 200,000 – 250,000 | 2.1% | 2.1% | 2.3% | 2.1% | 2.0% | 1.8% | 1.6% | 1.5% | -0.1% | -0.1% |
| 250,000 – 500,000 | 4.1% | 3.9% | 4.2% | 3.9% | 3.7% | 3.5% | 3.2% | 3.1% | -0.2% | -0.3% |
| 500,000 – 1,000,000 | 3.9% | 3.5% | 4.0% | 3.5% | 3.3% | 3.0% | 2.6% | 2.5% | 0.6% | 0.4% |
| > 1,000,000 | 3.6% | 3.1% | 3.7% | 3.0% | 2.8% | 2.4% | 2.1% | 1.9% | 0.5% | 0.2% |
| TOTAL FOR ALL | 2.3% | 2.2% | 2.5% | 2.2% | 2.1% | 1.9% | 1.7% | 1.6% | 0.0% | -0.1% |
| Dynamic | ||||||||||
| 0 – 5,000 | 1.1% | 1.9% | 3.0% | 3.6% | 4.0% | 4.5% | 4.8% | 5.0% | 4.8% | 4.4% |
| 5,000 – 10,000 | 1.0% | 1.6% | 2.4% | 3.0% | 3.3% | 3.6% | 3.9% | 4.0% | 3.5% | 3.1% |
| 10,000 – 20,000 | 1.2% | 1.8% | 2.4% | 2.9% | 3.2% | 3.4% | 3.6% | 3.7% | 2.8% | 2.5% |
| 20,000 – 30,000 | 1.6% | 2.1% | 2.7% | 3.1% | 3.3% | 3.6% | 3.7% | 3.8% | 2.5% | 2.2% |
| 30,000 – 40,000 | 2.0% | 2.5% | 3.1% | 3.5% | 3.7% | 3.9% | 4.1% | 4.1% | 2.6% | 2.4% |
| 40,000 – 50,000 | 2.0% | 2.5% | 3.2% | 3.6% | 3.8% | 4.1% | 4.3% | 4.3% | 2.8% | 2.5% |
| 50,000 – 75,000 | 2.0% | 2.5% | 3.1% | 3.5% | 3.8% | 4.0% | 4.2% | 4.3% | 2.8% | 2.5% |
| 75,000 – 100,000 | 2.0% | 2.6% | 3.2% | 3.7% | 3.9% | 4.1% | 4.3% | 4.4% | 2.8% | 2.6% |
| 100,000 – 150,000 | 1.8% | 2.3% | 3.0% | 3.4% | 3.7% | 3.9% | 4.0% | 4.1% | 2.7% | 2.4% |
| 150,000 – 200,000 | 2.2% | 2.7% | 3.4% | 3.8% | 4.1% | 4.3% | 4.4% | 4.5% | 3.1% | 2.8% |
| 200,000 – 250,000 | 2.5% | 2.9% | 3.8% | 4.1% | 4.3% | 4.5% | 4.6% | 4.7% | 3.1% | 2.8% |
| 250,000 – 500,000 | 4.4% | 4.8% | 5.7% | 5.9% | 6.1% | 6.2% | 6.2% | 6.2% | 3.0% | 2.7% |
| 500,000 – 1,000,000 | 4.2% | 4.5% | 5.7% | 5.7% | 5.9% | 5.9% | 5.8% | 5.8% | 3.9% | 3.5% |
| > 1,000,000 | 4.0% | 4.1% | 5.5% | 5.4% | 5.6% | 5.5% | 5.4% | 5.4% | 3.5% | 3.2% |
| TOTAL FOR ALL | 2.6% | 3.0% | 3.8% | 4.1% | 4.3% | 4.4% | 4.5% | 4.6% | 3.0% | 2.7% |
| Individual | 2018 | 2019 | 2020 | 2021 | 2022 | 2023 | 2024 | 2025 | 2026 | 2027 |
| 0% to 20% | 0.6% | 0.6% | 0.6% | 0.6% | 0.6% | 0.6% | 0.5% | 0.5% | -0.4% | -0.4% |
| 20% to 40% | 1.4% | 1.3% | 1.2% | 1.2% | 1.1% | 1.0% | 0.9% | 0.9% | -0.7% | -0.7% |
| 40% to 60% | 1.4% | 1.4% | 1.3% | 1.3% | 1.2% | 1.2% | 1.1% | 1.1% | -0.3% | -0.4% |
| 60% to 80% | 1.4% | 1.4% | 1.3% | 1.3% | 1.3% | 1.3% | 1.2% | 1.2% | -0.4% | -0.4% |
| 80% to 100% | 1.7% | 1.6% | 1.7% | 1.5% | 1.7% | 1.6% | 1.6% | 1.5% | -0.5% | -0.5% |
| 80% to 90% | 1.4% | 1.3% | 1.3% | 1.5% | 1.3% | 1.3% | 1.2% | 1.2% | -0.3% | -0.3% |
| 90% to 95% | 1.4% | 1.4% | 1.3% | 1.3% | 1.3% | 1.3% | 1.3% | 1.2% | -0.3% | -0.3% |
| 95% to 99% | 2.3% | 2.2% | 2.2% | 2.1% | 2.1% | 2.1% | 2.0% | 1.9% | -0.6% | -0.6% |
| 99% to 100% | 1.9% | 1.7% | 1.8% | 1.7% | 1.9% | 1.8% | 1.7% | 1.6% | -0.7% | -0.7% |
| TOTAL | 1.6% | 1.5% | 1.5% | 1.4% | 1.5% | 1.4% | 1.4% | 1.3% | -0.5% | -0.5% |
| Corporate | 2018 | 2019 | 2020 | 2021 | 2022 | 2023 | 2024 | 2025 | 2026 | 2027 |
| 0% to 20% | 0.2% | 0.2% | 0.4% | 0.4% | 0.3% | 0.3% | 0.2% | 0.2% | 0.2% | 0.2% |
| 20% to 40% | 0.2% | 0.2% | 0.4% | 0.4% | 0.4% | 0.3% | 0.2% | 0.2% | 0.3% | 0.2% |
| 40% to 60% | 0.2% | 0.2% | 0.4% | 0.4% | 0.4% | 0.3% | 0.2% | 0.2% | 0.3% | 0.2% |
| 60% to 80% | 0.2% | 0.2% | 0.4% | 0.4% | 0.4% | 0.3% | 0.2% | 0.2% | 0.3% | 0.3% |
| 80% to 100% | 0.9% | 0.8% | 1.1% | 0.9% | 0.7% | 0.5% | 0.4% | 0.3% | 0.5% | 0.4% |
| 80% to 90% | 0.3% | 0.3% | 0.5% | 0.5% | 0.5% | 0.3% | 0.2% | 0.2% | 0.3% | 0.3% |
| 90% to 95% | 0.4% | 0.4% | 0.6% | 0.6% | 0.5% | 0.4% | 0.3% | 0.2% | 0.4% | 0.3% |
| 95% to 99% | 0.7% | 0.6% | 0.9% | 0.8% | 0.6% | 0.5% | 0.3% | 0.3% | 0.4% | 0.4% |
| 99% to 100% | 1.8% | 1.5% | 1.9% | 1.4% | 1.0% | 0.8% | 0.5% | 0.4% | 0.7% | 0.6% |
| TOTAL | 0.7% | 0.7% | 1.0% | 0.8% | 0.7% | 0.5% | 0.3% | 0.3% | 0.5% | 0.4% |
| Individual | 2018 | 2019 | 2020 | 2021 | 2022 | 2023 | 2024 | 2025 | 2026 | 2027 |
| 0 – 5,000 | 0.2% | 0.2% | 0.2% | 0.2% | 0.2% | 0.2% | 0.2% | 0.2% | 0.1% | 0.1% |
| 5,000 – 10,000 | 0.5% | 0.5% | 0.5% | 0.5% | 0.5% | 0.5% | 0.5% | 0.6% | 0.0% | 0.0% |
| 10,000 – 20,000 | 0.8% | 0.8% | 0.7% | 0.7% | 0.7% | 0.7% | 0.7% | 0.7% | -0.4% | -0.4% |
| 20,000 – 30,000 | 1.2% | 1.2% | 1.1% | 1.1% | 1.0% | 1.0% | 1.0% | 0.9% | -0.5% | -0.5% |
| 30,000 – 40,000 | 1.5% | 1.5% | 1.4% | 1.4% | 1.3% | 1.3% | 1.2% | 1.2% | -0.4% | -0.4% |
| 40,000 – 50,000 | 1.6% | 1.5% | 1.5% | 1.5% | 1.4% | 1.4% | 1.3% | 1.3% | -0.3% | -0.3% |
| 50,000 – 75,000 | 1.5% | 1.4% | 1.4% | 1.4% | 1.3% | 1.3% | 1.3% | 1.2% | -0.3% | -0.3% |
| 75,000 – 100,000 | 1.5% | 1.5% | 1.5% | 1.4% | 1.4% | 1.4% | 1.3% | 1.3% | -0.3% | -0.3% |
| 100,000 – 150,000 | 1.2% | 1.2% | 1.1% | 1.1% | 1.1% | 1.1% | 1.0% | 1.0% | -0.5% | -0.5% |
| 150,000 – 200,000 | 1.4% | 1.4% | 1.3% | 1.3% | 1.3% | 1.2% | 1.2% | 1.2% | -0.3% | -0.3% |
| 200,000 – 250,000 | 1.6% | 1.5% | 1.5% | 1.4% | 1.4% | 1.4% | 1.3% | 1.3% | -0.5% | -0.5% |
| 250,000 – 500,000 | 3.1% | 3.0% | 3.0% | 2.9% | 3.0% | 2.9% | 2.8% | 2.8% | -0.8% | -0.9% |
| 500,000 – 1,000,000 | 2.4% | 2.2% | 2.3% | 2.2% | 2.3% | 2.2% | 2.1% | 2.0% | -0.4% | -0.4% |
| > 1,000,000 | 1.7% | 1.5% | 1.6% | 1.5% | 1.7% | 1.6% | 1.5% | 1.5% | -0.7% | -0.8% |
| TOTAL FOR ALL | 1.6% | 1.5% | 1.5% | 1.4% | 1.5% | 1.4% | 1.4% | 1.3% | -0.5% | -0.5% |
| Corporate | 2018 | 2019 | 2020 | 2021 | 2022 | 2023 | 2024 | 2025 | 2026 | 2027 |
| 0 – 5,000 | 0.5% | 0.5% | 0.7% | 0.7% | 0.6% | 0.4% | 0.3% | 0.2% | 0.3% | 0.3% |
| 5,000 – 10,000 | 0.2% | 0.2% | 0.4% | 0.4% | 0.3% | 0.3% | 0.2% | 0.1% | 0.1% | 0.1% |
| 10,000 – 20,000 | 0.2% | 0.2% | 0.4% | 0.4% | 0.3% | 0.3% | 0.2% | 0.1% | 0.1% | 0.1% |
| 20,000 – 30,000 | 0.1% | 0.2% | 0.4% | 0.4% | 0.4% | 0.3% | 0.2% | 0.2% | 0.1% | 0.1% |
| 30,000 – 40,000 | 0.2% | 0.2% | 0.4% | 0.4% | 0.4% | 0.3% | 0.2% | 0.2% | 0.1% | 0.1% |
| 40,000 – 50,000 | 0.2% | 0.2% | 0.4% | 0.4% | 0.4% | 0.3% | 0.2% | 0.2% | 0.1% | 0.1% |
| 50,000 – 75,000 | 0.2% | 0.3% | 0.4% | 0.4% | 0.4% | 0.3% | 0.2% | 0.2% | 0.1% | 0.1% |
| 75,000 – 100,000 | 0.2% | 0.3% | 0.5% | 0.5% | 0.4% | 0.3% | 0.2% | 0.2% | 0.2% | 0.1% |
| 100,000 – 150,000 | 0.3% | 0.4% | 0.6% | 0.5% | 0.5% | 0.4% | 0.3% | 0.2% | 0.2% | 0.2% |
| 150,000 – 200,000 | 0.5% | 0.5% | 0.7% | 0.6% | 0.5% | 0.4% | 0.3% | 0.2% | 0.3% | 0.3% |
| 200,000 – 250,000 | 0.6% | 0.6% | 0.8% | 0.7% | 0.6% | 0.5% | 0.3% | 0.3% | 0.4% | 0.3% |
| 250,000 – 500,000 | 0.9% | 0.9% | 1.2% | 0.9% | 0.7% | 0.6% | 0.4% | 0.3% | 0.6% | 0.5% |
| 500,000 – 1,000,000 | 1.5% | 1.4% | 1.7% | 1.3% | 1.0% | 0.8% | 0.5% | 0.4% | 1.0% | 0.8% |
| > 1,000,000 | 1.9% | 1.6% | 2.0% | 1.5% | 1.1% | 0.8% | 0.6% | 0.5% | 1.2% | 1.0% |
| TOTAL FOR ALL | 0.7% | 0.7% | 1.0% | 0.8% | 0.7% | 0.5% | 0.3% | 0.3% | 0.5% | 0.4% |
Notes
[1] For more details on the TCJA see “Preliminary Details and Analysis of the Tax Cuts and Jobs Act,” Tax Foundation, Dec. 18, 2017, https://taxfoundation.org/final-tax-cuts-and-jobs-act-details-analysis/.
[2] Stephen J. Entin, Huaqun Li, and Kyle Pomerleau, “Overview of the Tax Foundation’s General Equilibrium Model,” Tax Foundation, April 2018 Update,” /wp-content/uploads/2018/04/TaxFoundaton_General-Equilibrium-Model-Overview1.pdf.
[3] The income (adjusted gross incomeFor individuals, gross income is the total pre-tax earnings from wages, tips, investments, interest, and other forms of income and is also referred to as “gross pay.” For businesses, gross income is total revenue minus cost of goods sold and is also known as “gross profit” or “gross margin.” ) breakpoints in 2018: 0% to 20%: <$15,344, 20% to 40%: $15,344 – $27,750, 40% to 60%: $27,750 – $43,800, 60% to 80%: $43,800 – $70,168, 80% to 100%: >$70,168, 80% to 90%: $70,168 – $99,773, 90% to 95%: $99,773 – $139,936, 95% to 99%: $139,936 – $345,877, 99% to 100%: >$345,877.
[4] Including the impact of the Section 199A deduction for pass-through businesses.
[5] Stephen J. Entin, Huaqun Li, and Kyle Pomerleau, “Overview of the Tax Foundation’s General Equilibrium Model; April 2018 Update.”
[6] For standard, long-run Tax Foundation distributional analyses, the tax windfall for old capital is ignored.
[7] This portion of the corporate tax is distributed to taxpayers in proportion to their reported capital gains and dividend income.
[8] The Joint Committee on Taxation, “Estimated Budget Effects Of The Conference Agreement For H.R.1, The ‘Tax Cuts And Jobs Act,’” https://www.jct.gov/publications.html?func=startdown&id=5053, and “Distributional Effects Of The Conference Agreement For H.R.1, The ‘Tax Cuts And Jobs Act,’” https://www.jct.gov/publications.html?func=startdown&id=5054.
[9] For this analysis, we used the same assumptions we made in our previous TCJA analysis: “Preliminary Details and Analysis of the Tax Cuts and Jobs Act,” Tax Foundation.
Share this article