Prepared Statement of Scott Hodge, TaxA tax is a mandatory payment or charge collected by local, state, and national governments from individuals or businesses to cover the costs of general government services, goods, and activities. Foundation President. Hearing on Distribution and Efficiency of Spending in the Tax Code Before the U.S. Senate Budget Committee
March 9, 2011
Mr. Chairman and members of the Committee:
I am Scott Hodge, president of the Tax Foundation. Thank you for the opportunity to speak to you today regarding the distributional and economic issues surrounding tax expenditures in the federal budget.
Founded in 1937, the Tax Foundation is the nation’s oldest organization dedicated to promoting economically sound tax policy at the federal, state, and local levels of government. We are a non-partisan 501(c)(3) organization.
For nearly 75 years, the Tax Foundation’s research has been guided by the immutable principles of economically sound tax policy that were first outlined by Adam Smith: Taxes should be neutral to economic decision making; they should be simple, transparent, and stable; and they should promote economic growth.
In other words, the ideal tax system should do only one thing: raise a sufficient amount of revenues to fund government activities with the least amount of harm to the economy. As Jean Baptiste Colbert famously wrote, “The art of taxation consists in so plucking the goose as to obtain the largest amount of feathers with the least amount of hissing.”
By all accounts, the U.S. is far from that ideal. According to the National Taxpayer Advocate, tax complexity is the number one issue facing taxpayers and the IRS today. The main cause of that complexity has been the proliferation of credits, deductions, and preferences built into the tax code.
Introduction
Over the past two decades, lawmakers have increasingly asked the tax code to direct all manner of social and economic objectives, such as encouraging people to: buy hybrid vehicles, turn corn into gasoline, save more for retirement, purchase health insurance, buy a home, replace the home’s windows, adopt children, put them in daycare, take care of Grandma, buy bonds, spend more on research, purchase school supplies, go to college, invest in historic buildings, and the list goes on.
In too many respects, the IRS has become an extension of, or rather a substitute for, every other cabinet agency, from Energy and Education to HHS and HUD. But perhaps the most troubling development in recent years is that the efforts of lawmakers to use the tax code to help low- and middle-income taxpayers have knocked millions of taxpayers off the tax rolls and turned the IRS into an extension of the welfare state.
Today, a record number of Americans—52 million, or 36 percent of all filers—have no direct connection with the basic cost of government because they pay no income taxes. If we add this group to the people who have some income but don’t file a tax return, the ranks of American households outside the income tax system rise to 48 percent.[1]
Indeed, many of these 52 million tax filers now look to the IRS as a source of income thanks to the more than $100 billion in refundable tax credits paid to people who have no income tax liability.
As a result of removing millions of people from the bottom of the tax rolls, we have dramatically reduced the number of people with “skin in the game.” Indeed, the top 1 percent of taxpayers now pays a greater share of the income tax burden than the bottom 90 percent combined.
Sadly, individuals are not the only taxpayers looking to the IRS as a source of income. The proliferation of tax credits aimed at promoting technologies such as renewable energy and fuel-efficient products has addicted many companies and industries to IRS handouts. In a recent case, one-third of the profits of a major appliance company were attributable to energy production credits.
Ironically, but perhaps not surprisingly, the sectors suffering the biggest financial crises today—health care, housing, and state and local governments—all receive the most subsidies through the tax code. The cure for what ails these industries is to be weaned off the tax code, not given more subsidies through such things as the First Time Homebuyer’s Credit, Premium Assistance credits, or more tax-free bonds.
Washington can actually do more for the American people by doing less. The solution lies in fundamental tax reform. Indeed, as the plan authored by Erskine Bowles and Alan Simpson (co-chairmen of President Obama’s National Commission on Fiscal Responsibility and Reform), demonstrated, Americans could enjoy much lower tax rates, and the government could raise the same amount of revenue if most—if not all—tax expenditures were eliminated.
That said, the primary goal of fundamental tax reform should not be raising more money for government. The primary goal should be improving the nation’s long-term economic growth and lifting living standards.
Economists at the OECD have determined that high corporate and personal income tax rates are the most harmful taxes for long-term economic growth. Unfortunately, the U.S. has one of the highest corporate income taxes among industrialized nations and one of the most progressive personal income tax systems.
Cutting these rates while broadening the tax baseThe tax base is the total amount of income, property, assets, consumption, transactions, or other economic activity subject to taxation by a tax authority. A narrow tax base is non-neutral and inefficient. A broad tax base reduces tax administration costs and allows more revenue to be raised at lower rates. would greatly improve the nation’s prospects for long-term GDP growth. The benefits of higher economic growth will accrue to taxpayers and Uncle Sam alike.
What Are Tax Expenditures?
According to the Joint Committee on Taxation, “tax expenditures include any reductions in income tax liabilities that result from special tax provisions or regulations that provide tax benefits to particular taxpayers.”[2] These special preferences are called tax expenditures because some people consider them the equivalent of direct spending through the tax code.
However, aside from the refundable cash outlay portion of some credits, tax expenditures are really not the same as direct spending. Instead, they are an attempt to achieve certain public policy goals by inducing or incenting taxpayers with the prospect of a lower tax bill. Essentially, lawmakers are trying to get taxpayers to achieve these policy objectives by using their own money, not “the government’s.”
To be sure, many people improperly view the forgone revenue from tax expenditures as “the government’s money.” By this view, what the tax code allows taxpayers to keep through tax preferences has thus been “spent” in the same manner as a government program.
But there is a very real moral and functional difference between the government taking $1,000 from a taxpayer and giving it to the Department of Energy for switch grass research, and a tax preference which allows that taxpayer to keep $1,000 of his own money because he purchased new windows for his home. The tax creditA tax credit is a provision that reduces a taxpayer’s final tax bill, dollar-for-dollar. A tax credit differs from deductions and exemptions, which reduce taxable income rather than the taxpayer’s tax bill directly. may be poor tax policy, but the transaction is clearly one that the taxpayer chose of his own accord. The government did not actively take his money and give it to Home Depot for the new windows.
How Many Tax Expenditures Are There?
While estimates of tax expenditures vary, there is no doubt that their numbers have grown in recent years. Table 1 in the Appendix to this report illustrates the growth in the number of tax expenditures according to a recent analysis by economists at the OECD. In 2002, the OECD identified 135 separate tax preferences in the U.S. tax code. By 2010, the number had increased to 164, a jump of 21 percent.
The biggest growth in tax expenditures was in the area of industry-specific provisions, where the number jumped from 35 to 54 between 2004 and 2008. The majority of these new industry-specific provisions were targeted to businesses involved in renewable energy and energy efficiency.

Which Are the Largest Categories of Tax Expenditures?
According to the President’s FY 2011 budget documents, corporate and individual tax expenditures will total more than $1 trillion this year. The vast majority of these tax preferences, roughly $900 billion, operate through the individual side of the tax code.
Both the Joint Committee on Taxation and the Treasury caution against viewing the estimated cost of tax expenditures as the amount that could be raised if the preferences were eliminated. Eliminating a preference causes numerous behavioral and substitution effects that are not captured in these budgetary estimates. Thus, eliminating a provision could raise substantially less new revenue than the budgetary cost associated with it.
With that cautionary note in mind, Figure 1 shows the composition of the largest categories of tax expenditures in FY 2011. By far the largest of these, at $174 billion, is the tax exclusion for employer-provided health insurance. The next largest category, at $135 billion, is for the collection of tax exclusions for pensions, 401(k)s, Individual Retirement Accounts, and Keogh plans.
For the sake of comparability, we’ve included the actual outlay cost of the refundable portion of tax credits even though they are not included in the overall cost of traditional tax expenditures. However, as we will discuss later, they are among the fastest-growing tax preferences and now comprise the third-largest category of preferences in the tax code with an actual cost of $108 billion in 2011.
The amount of corporate “loopholes” is actually much less than what is commonly thought. Overall, the roughly 80 separate corporate tax preferences have a combined budgetary cost of roughly $102 billion in FY 2011, only slightly larger than the cost of the mortgage interest deductionThe mortgage interest deduction is an itemized deduction for interest paid on home mortgages. It reduces households’ taxable incomes and, consequently, their total taxes paid. The Tax Cuts and Jobs Act (TCJA) reduced the amount of principal and limited the types of loans that qualify for the deduction. alone.
As Figure 1 shows, the mortgage interest deduction confers roughly $89 billion in benefits to homeowners and the housing industry each year. State and local governments receive about $87 billion in benefits through the combined effects of the deduction for state and local taxes and through tax-exempt bonds. Lastly, charities benefit from about $46 billion in budgetary resources each year.
Tax Expenditures and Distributional Issues
One of the dominant issues in any discussion of tax expenditures is who benefits from them. Because the value of a tax deductionA tax deduction allows taxpayers to subtract certain deductible expenses and other items to reduce how much of their income is taxed, which reduces how much tax they owe. For individuals, some deductions are available to all taxpayers, while others are reserved only for taxpayers who itemize. For businesses, most business expenses are fully and immediately deductible in the year they occur, but others, particularly for capital investment and research and development (R&D), must be deducted over time. depends upon the taxpayer’s marginal tax rateThe marginal tax rate is the amount of additional tax paid for every additional dollar earned as income. The average tax rate is the total tax paid divided by total income earned. A 10 percent marginal tax rate means that 10 cents of every next dollar earned would be taken as tax. , many of the largest and best known tax preferences, such as the mortgage interest deduction, do tend to benefit upper-income taxpayers. However, over the past 20 years or so, lawmakers have increasingly turned to using tax credits to benefit low- and middle-income taxpayers. This has had the unintended consequence of removing millions of taxpayers from the tax rolls altogether.
Setting aside for the moment the question of the true economic incidence of tax expenditures (i.e. who ultimately benefits from them), the major individual tax expenditures are largely claimed on the returns of upper-income taxpayers. For example, according to the Joint Committee on Taxation, 64 percent of the benefits of the mortgage interest deduction flow to taxpayers earning over $100,000, while 81 percent of the benefits of the deduction for state and local taxes (income, property, and sales) went to the same group.[3] Many rightfully argue that these provisions effectively subsidize high-tax communities at the expense of low-tax communities or subsidize homeowners at the expense of renters.
Similarly, JCT found that 80 percent of the benefits of the charitable deduction went to taxpayers earning over $100,000. To be sure, Americans earning under $100,000 give billions each year to charity, but because they are not among the roughly one-third of taxpayers who itemize on their tax returns, the tax code does not reward them for their generosity.
The Growth of the Nonpaying Population
While the tax code’s benefits to high-income taxpayers are well documented, less attention has been given to the growth in tax benefits targeted to low- and middle-income taxpayers. Since the early 1990s, lawmakers have increasingly used the tax code instead of government spending programs to help low-income and middle-class taxpayers. In terms of tax revenue, the most significant of these socially targeted credits was the $500 per-child tax credit enacted in 1997. The 2001 and 2003 tax bills doubled the value of the credit to $1,000 and added a refundable component.

Most tax credits can only reduce the amount a taxpayer owes to zero, but the EITC and the child tax credit are also refundable, meaning that taxpayers are eligible to receive a check even if they have paid no income tax during the year. Those tax returns have become, in effect, a claim form for a subsidy delivered through the tax system in much the same way that a traditional government program sends out a welfare check or a farm support check.
In 2008, according to the most recent IRS data available, 25 million tax filers received $51.6 billion in EITC benefits. Of this amount, $50.5 billion was refundable in excess of their income tax liability. Also in 2008, some 25.3 million filers received $30.7 billion in child tax credit benefits, with more than 18 million of these filers getting $20.5 billion in refundable checks. Many families are eligible for both the EITC and the child credit. These are not refunds of overpaid tax; they are payments to people who have already gotten back everything that was withheld from their paychecks during the year.
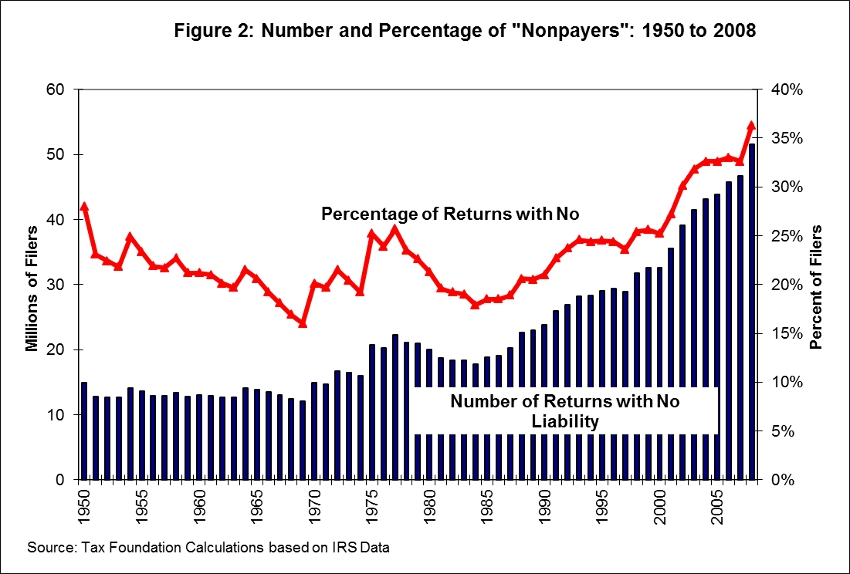
Figure 2 shows the fluctuation in the number and percentage of nonpayers since 1950 and how that has soared over the past decade.[4] The percentage of tax returns with no liability was fairly low in the 1960s and again in the early 1980s. The recent growth in the number of nonpayers was accelerated by two major tax changes enacted during the 1990s, followed by the Bush tax cuts in 2001 and 2003, and then the Economic Stimulus Act of 2008, which included a tax rebate of $300 per person, $600 per couple.
In 2008, these tax rebates boosted the number of nonpayers to nearly 52 million, or roughly 36 percent of all tax filers. Moreover, the rebates boosted the maximum income for nonpayers to more than $56,700. In the absence of the rebates, the threshold would have been roughly $44,500.
When the final IRS data is tallied for tax years 2009 and 2010, it is likely that the number of nonpayers could approach 40 percent due to President Obama’s making-work-pay credit, first-time homebuyer credit, and American Opportunity tax credit. As a rule of thumb, we can now expect that the typical family of four earning up to $50,000 will owe no income taxes.[5]
Refundable Credits Soar
|
Table 1: Outlay Components of Tax Credits in 2011 and 2016 |
||
|
Tax Provision |
Outlay Component 2011 ($Billions) |
Outlay Component 2016 ($Billions) |
|
Earned Income Tax Credit |
$54.96 |
$44.91 |
|
Child Tax Credit |
24.17 |
24.17 |
|
Making Work Pay |
20.49 |
0 |
|
Health Coverage Tax Credit |
0.15 |
0.15 |
|
Adoption Credit |
0.41 |
0 |
|
Build America Bonds |
2.59 |
2.45 |
|
Premium Assistance Tax Credit |
0 |
43.84 |
|
Small Business Credit |
0.18 |
0.32 |
|
Energy Production Grants |
4.2 |
0.62 |
|
Credit for holding clean renewable energy bonds |
0.02 |
0.03 |
|
Qualified energy conservation bonds |
0.05 |
0.06 |
|
Recovery Zone Bonds |
0.12 |
0.13 |
|
Credit for holders of zone academy bonds |
0.02 |
0.03 |
|
Qualified school construction bonds |
0.85 |
1.02 |
|
Total = |
$108.21 |
$117.73 |
Since it was enacted in 1913, the income tax code has contained provisions—such as the standard deductionThe standard deduction reduces a taxpayer’s taxable income by a set amount determined by the government. It was nearly doubled for all classes of filers by the 2017 Tax Cuts and Jobs Act (TCJA) as an incentive for taxpayers not to itemize deductions when filing their federal income taxes. , personal exemption, and dependent exemption—that exempted low-income workers from tax or greatly reduced their income tax burden. But starting with the earned income tax credit (EITC), and then the child tax credit, the IRS was required to send a “refund” check to taxpayers even though they had no income tax liability.
As Figure 3 shows, the amount of refundable checks sent by the IRS to nonpayers has doubled in real terms between 1996 and 2008, growing from $36 billion to over $72 billion. These credits are so generous, that the Joint Committee on taxation estimates that in 2009, they exceeded the employee share of payroll taxes for 23 million tax filers and exceeded the employer’s share of payroll taxes for 15.5 million filers.[6]
In recent years, more and more tax provisions are resulting in a cash outlay from the IRS. As Table 1 shows, in 2011 there are 13 tax provisions that will result in $108 billion in outlays. In five years, after the Premium Assistance Credit takes effect in 2014, tax outlays will top $117 billion.
Tax Expenditures and Progressivity
There is a common belief that because so many tax expenditures benefit upper-income taxpayers, the “rich” are not paying their fair share of taxes. Nothing could be further from the truth.

Indeed, because of the expansion of tax benefits aimed at low- and middle-income households, the OECD finds that the U.S. has the most progressive income tax system of any industrialized country. What that means is that the top 10 percent of U.S. taxpayers pay a larger share of the income tax burden than do the wealthiest decile in any other industrialized country, including traditionally “high-tax” countries such as France, Italy, and Sweden.[7]
Meanwhile, because of the generosity of such preferences as the EITC and child credit, low-income Americans have the lowest income tax burden of any OECD nation. Indeed, the study reports that while most countries rely more on cash transfers than taxes to redistribute income, the U.S. stands out as “achieving greater redistribution through the tax system than through cash transfers.”[8]
The share of the income tax burden borne by America’s wealthiest taxpayers has been growing steadily for more than two decades. Figure 4 compares the share of income taxes paid by the top 1 percent of taxpayers to the share paid by the bottom 90 percent of taxpayers.
The chart shows that, as of 2008, the top 1 percent of taxpayers paid 38 percent of all income taxes, while the bottom 90 percent of taxpayers paid just 30 percent of the income tax burden. By any measure, this is the sign of a very progressive taxA progressive tax is one where the average tax burden increases with income. High-income families pay a disproportionate share of the tax burden, while low- and middle-income taxpayers shoulder a relatively small tax burden. system.
Measuring the Distribution of Both Taxes and Spending
While the topic of this hearing is the distribution and efficiency of tax expenditures, it is a mistake to focus solely on the distributional effects of tax policy without considering the distributional effects of spending. After all, federal spending is intended to achieve various policy objectives and benefit different groups of Americans in different ways. Thus, it is important to look at the progressivity of the entire fiscal system, not just the tax side.
In an important 2009 study, in order to gain a better understanding of the overall amount of redistribution that occurs through both tax and spending policies, Tax Foundation economists measured how much families at various income levels paid in taxes versus how much they received in spending benefits. The results of this analysis show that federal tax and spending policies are very heavily tilted to the poor and middle-class, even before considering the Obama administration’s major policy initiatives such as health care reform. For 2010, the Tax Foundation report found that the bottom 60 percent of American families received more in government spending than they paid in taxes.
Not surprisingly, as Figure 5 shows, government spent $10.44 on the lowest-income families for every dollar they paid in taxes. Remarkably, families in the middle-income group received $1.15 for every dollar they paid in taxes.

By contrast, the top 40 percent of families paid more in taxes as a group than they received in government spending benefits. The highest-income families received 43 cents in government spending for every dollar they pay in taxes, even though they are assumed in this study to disproportionately benefit from public goods such as national defense.
Overall, federal tax and spending policies combined to redistribute more than $824 billion from the top 40 percent of families to the bottom 60 percent of families in 2010. In other words, the entire federal fiscal system is very progressive and redistributive.
Tax Expenditures Are the Cause of Today’s Financial Crises
Today, the biggest financial crises facing working families and the economy are health care, housing, and state and local government finances. Ironically, these are the areas in which government is already the most involved.
For example, the tax preference for employer-provided health insurance creates a classic third-party payer problem in which patient-consumers are disconnected from the cost of service. The cost of health care is soaring because we have an unlimited demand for health care since someone else is paying the bills. The market forces that deliver quality goods at low prices for everything from toasters to automobiles have been disrupted in the health care system because it is tax preferred. The recent health care reform legislation will make this problem worse, not better.
Housing suffers a similar problem because of the plethora of tax and spending subsidies intended to promote home ownership. Professor Dennis J. Ventry, Jr. of the UC Davis School of Law, calls the mortgage interest deduction (MID) the “accidental deduction,” because the authors of the original tax code never intended the deduction for personal interest expenses to subsidize home ownership.[9]
Economists find that the MID gets capitalized into the price of homes and may amplify price volatility,[10] which offsets whatever effect it has on promoting home ownership. The actual economic benefits of those capitalized costs tend to flow to the home builders and realtors, who have naturally been the most vocal opponents of eliminating the MID. One study determined that the MID is “an ineffective policy to promote homeownership and improve social welfare.”[11]
While the lion’s share of the blame for the current housing crisis properly rests with government-sponsored enterprises Fannie Mae and Freddie Mac, the MID certainly played a role in encouraging some families to purchase homes that they really could not have afforded otherwise. Canada does not have a mortgage interest deduction, yet its rate of homeownership is equal to that in the U.S. Even the Washington Post has editorialized that it is time to “[t]rim the excessive tax subsidy for real estate.”[12]
The deduction for state and local taxes and the tax subsidies for municipal bonds allow local governments to raise taxes and pass as much as one-third of those costs to Uncle Sam. This is especially true for high-cost, high-tax suburban communities. Ironically, the state and local tax deduction is the primary reason more and more taxpayers in these high-tax urban areas—largely in so-called Blue States—are being ensnared in the Alternative Minimum Tax. The AMT is not an issue for taxpayers in lower-tax states and communities.
One study found that the state and local tax deduction leads to higher local tax revenues “by increasing the rate of local property taxation.” Specifically, the authors found “that if deductibility were eliminated, the mean property taxA property tax is primarily levied on immovable property like land and buildings, as well as on tangible personal property that is movable, like vehicles and equipment. Property taxes are the single largest source of state and local revenue in the U.S. and help fund schools, roads, police, and other services. rate in our sample of 82 communities would fall by 0.00715 ($7.15 per thousand dollars of assessed property), or 21.1 percent of the mean tax rate.”[13]
In the same way that the MID encourages some families to purchase larger, more expensive homes than they otherwise could afford, federal tax subsidies for state and local activities may encourage some governments to buy more government than their taxpayers could otherwise afford. In recent years, state and local debt has grown significantly as a share of GDP according to Steven Malanga, a fellow with the Manhattan Institute. He estimates that:
Over the last decade, through good times and bad, total state and local debt has soared from $1.5 trillion in 2000 to $2.4 trillion (in current dollars). When that debt is added to other growing obligations that governments are racking up, using techniques like not paying their bills on time, state and local liabilities have increased from 15 percent of GDP in 2000 to an estimated 22 percent this year. In 1980, they were 12 percent.[14]
It is very likely that these governments would not have borrowed as much as they did were it not for the fact that tax-free municipal bonds allow them to pass some of that cost off to the federal government.
Dependent Corporate Interests
History shows that lawmakers need to be very cautious about trying to use targeted tax preferences to promote specific industries or technologies because these preferences can create a dependent class of industries in the same way that refundable tax programs such as the EITC and child credit can create a dependent class of families.
The recent tax policies aimed at promoting renewable energy sources and more efficient appliances provide two good examples. Many recent news reports have documented the fragility of the wind and solar power industry without federal tax subsidies. During last December’s debate over the extension of the energy investment credit, the CEO of the American Wind Energy Association warned that without the tax credit the prospects for the industry would be “flatline or down.”[15]
The Washington Post reports that the wind industry “has had its production tax credits lapse three times—in 1999, 2001 and 2003. According to the American Wind Energy Association, new installed wind capacity declined 93, 73 and 77 percent, respectively.”[16] In other words, without the tax subsidy, there is no investment.
According to a recent Bloomberg story, the tax incentives for the production of energy-efficient appliances have also resulted in very unintended consequences:
Whirlpool Corp. will claim $300 million this year in U.S. tax credits for making energy-efficient appliances, collecting almost four times the government’s estimate for what all companies would receive from the tax incentive.
The credit will generate about one-third of Whirlpool’s earnings this year, according to the company’s projections.
Company filings show that as of Dec. 31, 2010, Whirlpool had $555 million in stockpiled business credits and $2 billion in tax losses. Both can typically be used to offset up to 20 years of future income and taxes.[17]
When Congress created the tax credit in 2005 to encourage the production of energy-efficient appliances, it seems unlikely that lawmakers envisioned that it could someday comprise one-third of a company’s profits. For Whirlpool, the energy credit is an income subsidy in the same manner as the EITC subsidizes the income of a poor family.
Ironically, the stockpiling of tax credits can turn some companies into opponents of corporate tax reform. That is because these credits are booked as “assets” on the company’s balance sheet and have a value linked to the corporate tax rate of 35 percent. Should the corporate tax rate be lowered, to say 25 percent, then the value of those assets will fall by about one-third, which directly impacts the book value of the company. Since no CEO wants that, they have an incentive to lobby on behalf of higher corporate tax rates.
Tax Reform Is the Solution
In its 2010 Annual Report to Congress, the National Taxpayer Advocate identified tax complexity as the most serious problem facing taxpayers and the IRS, and urged lawmakers to simplify the system.[18]
Simply complying with the tax code costs taxpayers an estimated $163 billion each year. About 62 percent of all taxpayers use tax return preparers, but the percentage climbs to about 73 percent for those claiming the EITC.[19] Moreover, the complexity of EITC eligibility is a contributing factor to the estimated $10 billion to $12 billion in erroneous overpayments out of nearly $44 billion of total EITC claims in 2006.[20]
According to a recent Tax Foundation study, the “deadweight” costs, or excess burden, of the current individual income taxAn individual income tax (or personal income tax) is levied on the wages, salaries, investments, or other forms of income an individual or household earns. The U.S. imposes a progressive income tax where rates increase with income. The Federal Income Tax was established in 1913 with the ratification of the 16th Amendment. Though barely 100 years old, individual income taxes are the largest source of tax revenue in the U.S. is not inconsequential, amounting to roughly 11 to 15 percent of total income tax revenues. This means that in the course of raising roughly $1 trillion in revenue through the individual income tax, an additional burden of $110 to $150 billion is imposed on taxpayers and the economy.[21]
New revenues should not be the primary goal of reform. To be sure, with the deficit now topping $1.5 trillion, many lawmakers may look at eliminating tax “loopholes” and simplifying the tax code as an opportunity to raise more revenues. This should not be the primary goal of tax reform. The primary goal should be to promote long-term economic growth and better living standards for the American people. If the byproduct of increased economic growth is more tax revenues, then that is a win-win.
Clearly, eliminating “loopholes” and other distortionary tax provisions can wring some of the deadweight losses out of the economy. But the key to promoting long-term growth is cutting top tax rates. A recent study by economists at the OECD found that corporate income taxes are the most harmful tax for long-term economic growth and that high personal income taxes were found to be the second-most harmful for long-term growth.
Not only does the U.S. have the most progressive income tax system among OECD nations, it also has the second-highest corporate income taxA corporate income tax (CIT) is levied by federal and state governments on business profits. Many companies are not subject to the CIT because they are taxed as pass-through businesses, with income reportable under the individual income tax. rate in the OECD. These high taxes on corporate and personal income are jeopardizing the country’s long-term prospects for growth. Cutting both personal and corporate income tax rates while eliminating tax expenditures would result in both improved GDP growth and a more efficient tax system.
According to OECD economists, cutting the top personal tax rate can “raise productivity in industries with potentially high rates of enterprise creation.”[22] In other words, lower marginal rates can increase entrepreneurship and risk taking. Moreover, they find that “lowering statutory corporate tax rates can lead to particularly large productivity gains in firms that are dynamic and profitable, i.e. those that can make the largest contribution to GDP growth.”
There are any number of plans that would greatly simplify the tax code, including the flat taxAn income tax is referred to as a “flat tax” when all taxable income is subject to the same tax rate, regardless of income level or assets. , Rep. Paul Ryan’s “Roadmap,” the FairTax, and the Bradford X-tax. A good illustration of how far tax rates can be lowered by eliminating some or all of the tax expenditures in the code is the “Zero Plan” drafted by the chairmen of President Obama’s National Commission on Fiscal Responsibility and Reform, Erskine Bowles and Alan Simpson.[23]
As the table from the Bowles/Simpson report shows, below, eliminating all tax expenditures could lower the top corporate tax rate from 35 percent to 26 percent and the top individual rate from 35 percent to 23 percent. This would also allow the lowest tax rate to be reduced from 10 percent to 8 percent. [24]

With these optimal rates in mind, the plan shows lawmakers and taxpayers the cost of putting various credits and deductions back into the tax base. The more tax preferences you put back into the code, the higher the rates have to be to raise the same amount of revenues.
For example, keeping the child tax credit and the EITC would boost the bottom individual rate from 8 percent to 9 percent and the top rate from 23 to 24 percent. Every rate would have to go up another 3 percentage points should lawmakers want to keep the child credit and EITC while slightly scaling back the MID, health exclusion, and retirement benefits. The rates would have to go up another percentage point if all of these major provisions were kept unchanged in the current tax code.
While these are difficult trade-offs to be sure, the goal of the process is to wring as much inefficiency out of the tax system as possible while rewarding taxpayers with lower rates and a simpler, less complicated tax code.
Cautions and Caveats
Not every tax expenditureTax expenditures are a departure from the “normal” tax code that lower the tax burden of individuals or businesses, through an exemption, deduction, credit, or preferential rate. Expenditures can result in significant revenue losses to the government and include provisions such as the earned income tax credit (EITC), child tax credit (CTC), deduction for employer health-care contributions, and tax-advantaged savings plans. listed by either the JCT or the Treasury should be put on the chopping block. Some measures listed as tax expenditures under the current tax code would be the norm under an ideal tax system.
For example, bonus depreciationBonus depreciation allows firms to deduct a larger portion of certain “short-lived” investments in new or improved technology, equipment, or buildings in the first year. Allowing businesses to write off more investments partially alleviates a bias in the tax code and incentivizes companies to invest more, which, in the long run, raises worker productivity, boosts wages, and creates more jobs. and other accelerated depreciationDepreciation is a measurement of the “useful life” of a business asset, such as machinery or a factory, to determine the multiyear period over which the cost of that asset can be deducted from taxable income. Instead of allowing businesses to deduct the cost of investments immediately (i.e., full expensing), depreciation requires deductions to be taken over time, reducing their value and discouraging investment. measures are currently listed as tax preferences. Most economists would argue that the ideal tax system would allow for full expensingFull expensing allows businesses to immediately deduct the full cost of certain investments in new or improved technology, equipment, or buildings. It alleviates a bias in the tax code and incentivizes companies to invest more, which, in the long run, raises worker productivity, boosts wages, and creates more jobs. of business investment, so bonus depreciation should be seen as closer to the ideal than as a tax preference.
Similarly, the preferential rates for capital gains and dividend income are currently seen as tax expenditures. But an ideal tax system would not double-tax corporate income as is currently the case with capital gains and dividends. The flat tax, for example, would not tax capital gains or dividend income since that income is already taxed once at the corporate level.
The current system also treats the deferral of tax on profits earned abroad as a tax expenditure. These profits have already been taxed by the host country where they were earned and should not be taxed a second time when they are brought home to the U.S. Ideally, America should be moving toward a territorial system of taxation of foreign profits, as have the majority of our major trading partners. The United Kingdom and Japan are the two most recent competitors to move toward such a system.
The Research and Development tax credit is a trickier issue. On the one hand, a neutral tax system would not preference specific business activities such as research and development over other investments. However, many economists believe that in the absence of such a preference, the free market would under-invest in R&D and the economy would suffer. Moreover, most of our major economic competitors have generous incentives for R&D, so to eliminate this incentive from our system may be likened to unilateral disarmament.
Conclusion
The U.S. tax system is in desperate need of simplification and reform. The relentless growth of credits and deductions over the past 20 years has made the IRS a super-agency, engaged in policies as unrelated as delivering welfare benefits to subsidizing the manufacture of energy efficient refrigerators. I would argue that were we starting from scratch, these would not be the functions we would want a tax collection agency to perform.
While tax cuts will always curry more favor with voters than new spending programs, Washington needs to call a truce to using the tax code for social or economic goals. The consequence of trying to micromanage the economy as well as individual citizens’ behavior through the tax code is a narrow tax base and unnecessarily high tax rates. These high rates are endangering America’s global competitiveness and undermining the nation’s long-term economic growth.
Fundamental tax reform can restore the nation’s competitiveness and put us on a growth path for the future. Not only will this improve living standards in America, but it will improve the nation’s fiscal health. That is a win-win for everyone.
Thank you very much. I would welcome any questions you may have.
Appendix 1: How Do U.S. Tax Expenditures Compare to Other Nations?
Compared to other industrialized nations, the U.S. is well above average in terms of the percentage of budgetary resources going toward tax expenditures. As Figure 2 below shows, tax expenditures in the U.S. equal roughly 34 percent of total government tax and non-tax receipts. By contrast, tax expenditures in Germany, Korea, the Netherlands, and Spain, total less than 15 percent of government receipts. On the other end of the spectrum, Canadian tax expenditures equal 44 percent of government receipts, while in the U.K., tax expenditures equal 35 percent of receipts.

Appendix Table 1: Tax Expenditures in OEDC Countries
Tax Expenditures in OECD Countries – OECD © 2009 – ISBN 9789264076891
Source: http://dx.doi.org/10.1787/747140815638
Version 1 – Last updated: 10-Nov-2009
Number of tax expenditures in the United States % of GDP
With reclassifications by author
| 2002 † | 2003 | 2004 | 2005 | 2006 | 2007 | 2008 | 2009‡ | 2010‡ | |
| Purpose of Tax Expenditure, Income Tax* | |||||||||
| General Tax Relief | 0 | 0 | 0 | 0 | 0 | 0 | 0 | 0 | 0 |
| Low-Income Non-Work Related | 11 | 11 | 11 | 11 | 11 | 11 | 11 | 11 | 11 |
| Retirement | 11 | 11 | 11 | 10 | 10 | 10 | 10 | 10 | 10 |
| Work Related | 10 | 9 | 9 | 9 | 9 | 9 | 10 | 10 | 10 |
| Education | 14 | 15 | 15 | 16 | 16 | 16 | 16 | 16 | 16 |
| Health | 8 | 8 | 8 | 8 | 8 | 9 | 9 | 9 | 9 |
| Housing | 8 | 8 | 9 | 9 | 9 | 9 | 11 | 11 | 11 |
| General Business Incentives | 16 | 16 | 16 | 17 | 18 | 18 | 18 | 18 | 18 |
| R&D | 2 | 2 | 2 | 2 | 2 | 2 | 2 | 2 | 2 |
| Specific Industry Relief | 34 | 35 | 35 | 43 | 50 | 52 | 54 | 54 | 54 |
| Intergovernmental Relations | 3 | 3 | 3 | 3 | 3 | 3 | 3 | 3 | 3 |
| Charity | 4 | 4 | 4 | 4 | 4 | 4 | 5 | 5 | 5 |
| Other | 3 | 3 | 3 | 3 | 4 | 4 | 4 | 4 | 4 |
| Total | 124 | 125 | 126 | 135 | 144 | 147 | 153 | 153 | 153 |
| CAPITAL INCOME TAXATION | |||||||||
| Accelerated Depreciation | 2 | 2 | 2 | 2 | 2 | 2 | 2 | 2 | 2 |
| Interest | 1 | 1 | 1 | 1 | 1 | 1 | 1 | 1 | 1 |
| Dividends | 1 | 1 | 1 | 1 | 1 | 1 | 1 | 1 | 1 |
| Capital Gains | 3 | 3 | 3 | 3 | 3 | 3 | 3 | 3 | 3 |
| Subtotal | 7 | 7 | 7 | 7 | 7 | 7 | 7 | 7 | 7 |
| Total | 131 | 132 | 133 | 142 | 151 | 154 | 160 | 160 | 160 |
| Make Work Pay Provisions | 4 | 4 | 4 | 4 | 4 | 4 | 4 | 4 | 4 |
| Total | 135 | 136 | 137 | 146 | 155 | 158 | 164 | 164 | 164 |
| Non-Income Tax Related | 0 | 0 | 0 | 0 | 0 | 0 | 0 | 0 | 0 |
| Grand Total | 135 | 136 | 137 | 146 | 155 | 158 | 164 | 164 | 164 |
| Structural Items | 1 | 1 | 1 | 1 | 1 | 1 | 1 | 1 | 1 |
| Income Tax Expenditures by Type* | |||||||||
| Credits | 28 | 28 | 28 | 31 | 35 | 36 | 38 | 38 | 38 |
| Deductions, Exemptions, and Exclusions | 80 | 81 | 82 | 88 | 91 | 92 | 96 | 96 | 96 |
| Deferrals | 22 | 22 | 22 | 22 | 24 | 25 | 25 | 25 | 25 |
| Reduced Rates | 5 | 5 | 5 | 5 | 5 | 5 | 5 | 5 | 5 |
† In fiscal years: fiscal year 2006 is from October 1st 2005 to September 30th 2006.
‡ Projection
* Classification of tax expenditures by purpose and by type is to some degree arbitrary.
Sources: Budget of the U.S. Government, Fiscal Years 2009 and 2010, Analytical Perspectives, Chapter 19, Table 19-1
Appendix Table 2: Nonpayers by State in 2008
|
Total Filers |
Filers with a Tax Liability |
Filers with No Tax Liability |
Percentage of Filers with No Liability |
Rank (Most to Least) |
|
|
US Total |
143,490,468 |
95,520,933 |
51,045,911 |
36% |
|
|
Mississippi |
1,254,942 |
719,916 |
567,195 |
45% |
1 |
|
Georgia |
4,255,054 |
2,598,415 |
1,753,675 |
41% |
2 |
|
Arkansas |
1,223,637 |
755,772 |
498,682 |
41% |
3 |
|
New Mexico |
923,431 |
573,865 |
372,148 |
40% |
4 |
|
Alabama |
2,076,195 |
1,288,134 |
833,877 |
40% |
5 |
|
South Carolina |
2,047,201 |
1,273,969 |
818,631 |
40% |
6 |
|
Louisiana |
1,983,957 |
1,250,519 |
780,097 |
39% |
7 |
|
Texas |
10,792,258 |
6,822,725 |
4,226,513 |
39% |
8 |
|
Florida |
8,875,483 |
5,645,900 |
3,468,156 |
39% |
9 |
|
Idaho |
666,723 |
423,714 |
258,528 |
39% |
10 |
|
Tennessee |
2,842,898 |
1,814,965 |
1,100,304 |
39% |
11 |
|
North Carolina |
4,180,091 |
2,664,444 |
1,607,594 |
38% |
12 |
|
Utah |
1,145,303 |
730,938 |
432,744 |
38% |
13 |
|
Arizona |
2,714,182 |
1,756,481 |
1,010,982 |
37% |
14 |
|
Kentucky |
1,869,439 |
1,218,223 |
694,890 |
37% |
15 |
|
California |
16,478,215 |
10,809,941 |
6,083,777 |
37% |
16 |
|
Oklahoma |
1,605,411 |
1,051,298 |
591,878 |
37% |
17 |
|
Montana |
477,153 |
314,174 |
174,568 |
37% |
18 |
|
Indiana |
3,019,320 |
1,992,138 |
1,083,040 |
36% |
19 |
|
Michigan |
4,626,365 |
3,059,154 |
1,659,010 |
36% |
20 |
|
Missouri |
2,739,220 |
1,832,981 |
963,611 |
35% |
21 |
|
West Virginia |
785,966 |
527,282 |
275,876 |
35% |
22 |
|
New York |
9,203,531 |
6,233,030 |
3,223,814 |
35% |
23 |
|
Oregon |
1,753,860 |
1,182,640 |
608,311 |
35% |
24 |
|
Nevada |
1,272,433 |
854,584 |
441,251 |
35% |
25 |
|
Illinois |
6,112,426 |
4,128,709 |
2,100,258 |
34% |
26 |
|
South Dakota |
389,575 |
266,064 |
131,608 |
34% |
27 |
|
Kansas |
1,328,944 |
905,922 |
446,675 |
34% |
28 |
|
Nebraska |
857,622 |
591,594 |
282,150 |
33% |
29 |
|
Maine |
633,674 |
443,576 |
206,378 |
33% |
30 |
|
Vermont |
320,162 |
224,748 |
103,669 |
32% |
31 |
|
Hawaii |
656,452 |
459,268 |
211,696 |
32% |
32 |
|
Pennsylvania |
6,130,055 |
4,264,743 |
1,975,694 |
32% |
33 |
|
Ohio |
5,562,764 |
3,876,376 |
1,789,893 |
32% |
34 |
|
Wisconsin |
2,767,859 |
1,940,996 |
873,884 |
32% |
35 |
|
Colorado |
2,340,854 |
1,654,661 |
731,210 |
31% |
36 |
|
Iowa |
1,415,088 |
1,000,188 |
441,887 |
31% |
37 |
|
Rhode Island |
510,709 |
361,016 |
159,378 |
31% |
38 |
|
Delaware |
425,490 |
303,666 |
129,186 |
30% |
39 |
|
New Jersey |
4,304,848 |
3,077,401 |
1,301,727 |
30% |
40 |
|
Virginia |
3,727,792 |
2,674,714 |
1,120,668 |
30% |
41 |
|
Minnesota |
2,569,679 |
1,850,504 |
764,698 |
30% |
42 |
|
Washington |
3,185,705 |
2,302,518 |
939,240 |
29% |
43 |
|
Maryland |
2,776,026 |
2,012,029 |
811,278 |
29% |
44 |
|
North Dakota |
322,761 |
235,533 |
92,955 |
29% |
45 |
|
Wyoming |
274,041 |
201,684 |
77,085 |
28% |
46 |
|
New Hampshire |
668,971 |
497,127 |
184,299 |
28% |
47 |
|
Connecticut |
1,742,470 |
1,296,183 |
474,410 |
27% |
48 |
|
Massachusetts |
3,197,925 |
2,387,861 |
866,220 |
27% |
49 |
|
Alaska |
359,709 |
290,564 |
74,876 |
21% |
50 |
|
District of Columbia |
302,531 |
223,339 |
84,641 |
28% |
|
|
* Source: Tax Foundation calculations based on IRS data. |
[1] Roberton Williams, “Why Nearly Half of Americans Pay No Federal Income Tax,” Tax Notes, June 7, 2010, p. 1149.
[2] “Background Information on Tax Expenditure Analysis and Historical Survey of Tax Expenditure Estimates,” Joint Committee on Taxation, February 28, 2011, p. 2.
[3] “Estimates of Federal Tax Expenditures for Fiscal Years 2010-2014,” Joint Committee on Taxation, U.S. Government Printing Office, December 15, 2010, p. 55-56.
[4] Individual Income Tax Returns, Tax Year 2008 Preliminary Data: Selected Income and Tax Items, by Size of Adjusted Gross IncomeFor individuals, gross income is the total pre-tax earnings from wages, tips, investments, interest, and other forms of income and is also referred to as “gross pay.” For businesses, gross income is total revenue minus cost of goods sold and is also known as “gross profit” or “gross margin.” . Internal Revenue Service. http://www.irs.gov/pub/irs-soi/08in01pl.xls. These preliminary data represent estimates of income and tax items based on a sample of individual income tax returns filed between January and late September of a given processing year. These returns are then weighted to represent a full year of taxpayer reporting. In general, some of the returns processed during the remainder of the year may have somewhat different characteristics compared to these earlier ones. Therefore, these preliminary data are best utilized by comparisons made to the preliminary estimates from the prior year. When available, the estimates from the Complete Year Data should be used in place of the preliminary data.
[5] Scott A. Hodge, “Record Numbers of People Paying No Income Tax; Over 50 million “Nonpayers” Include Families Making over $50,000,” Tax Foundation Fiscal Fact No. 214, p. 4.
[6] Joint Committee on Taxation, Letter to Representative Dave Camp and Senator Kent Conrad, May 28, 2010.
[7] “Growing Unequal? Income Distribution and Poverty in OECD Countries,” Organization for Economic Cooperation and Development, 2008. p. 112.
http://dx.doi.org/10.1787/422013187855. Here income taxes refer to both personal and social insurance taxes.
[9] Dennis J. Ventry, Jr., “The Accidental Deduction: A History and Critique of the Tax Subsidy for Mortgage Interest,” UC Davis Legal Studies Research Paper Series, Research Paper No. 196, November 2009.
[10] Dan Andrews, “Real House Prices in OECD Countries: The Role of Demand Shocks and Structural and Policy Factors,” OECD Economics Department Working Papers, No. 831, OECD Publishing, 2010.
[11] Christian A. L. Hilber and Tracy M. Turner, “The mortgage interest deduction and its impact on homeownerhip decisions,” August 2010.
[12] “Trim the excessive tax subsidy for real estate,” Washington Post, January 1, 2011.
[13] Douglas Holtz-Eakin and Harvey S. Rosen, “Federal Deductibility and Local Property Tax Rates,” NBER Working Paper Series, Vol. w2427, December 1990.
[14] Steven Malanga, “The Muni-Bond Debt Bomb. . . and how to dismantle it,” City Journal, Summer 2010, Vol. 20, No. 3. http://www.city-journal.org/2010/20_3_muni-bonds.html
[15] “The Wind Subsidy Bubble,” Wall Street Journal, December 20, 2010.
[16] Anita Huslin, “Energy Boost: Solar and Wind Businesses Powered by Tax Breaks,” Washington Post, April 14, 2008.
[17] Richard Rubin, “Whirlpool Stockpiles Energy Credits, Reducing Future Tax Bills,” Bloomberg, February 22, 2011.
[18] National Taxpayer Advocate’s 2010 Annual Report to Congress.
http://www.irs.gov/advocate/article/0,,id=233846,00.html
[19] National Taxpayer Advocate, Report to Congress: Fiscal 2010 Objectives, June 30, 2009, p. xxii.
http://www.irs.gov/pub/irs-utl/fy2010_objectivesreport.pdf
[21] Robert C. Carroll, “The Excess Burden of Taxes and the Economic Cost of High Tax Rates,” Tax Foundation Special Report No. 170, August 14, 2009.
[22] “Tax Policy Reform and Economic Growth,” OECD Tax Policy Studies. No. 20., OECD Publishing, 2010, p. 24.
[23] This example is for illustrative purposes only. The Zero Plan did set aside $80 billion per year for deficit reduction and treat capital gains and dividends as ordinary income. The Tax Foundation does not support these aspects of the plan.
[24] National Commission on Fiscal Responsibility and Reform. “Co-Chair’s Report,” November 11, 2010.
http://www.fiscalcommission.gov/sites/fiscalcommission.gov/files/documents/CoChair_Draft.pdf