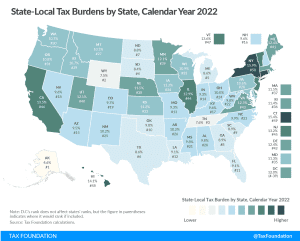
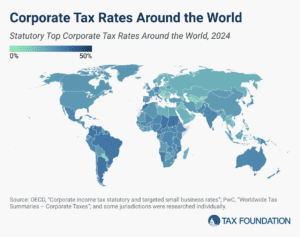
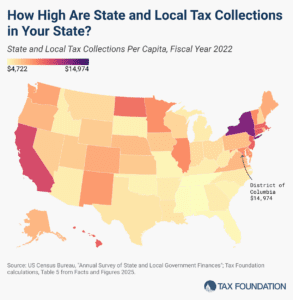
May 15, 2012 Tax Foundation Data on Business Taxes Print this page Subscribe Support our work U.S. Business Tax Rates Fall Behind By Standing Still (Corporate Tax Rates in U.S. vs. OECD Average, 1981-2009) This graph says it all: Over the past 28 years, as business tax rates in other OECD countries have fallen, the U.S. rate has risen. OECD Nations Continue Cutting Corporate Tax Rates While U.S. Stands Still Federal Plus Provincial/State Corporate Tax Rates for OECD Countries, 2008-2009 National and State Corporate Income Tax Rates, U.S. States and OECD Countries, 2009 You’ll be surprised to see just how many U.S. states have higher combined (federal rate plus state rate) business taxes than any other OECD country. Business Taxes Paid by Congressional District How much does the average resident of your congressional district pay in business taxes? To find out, type the last name of your representative into the search box at the top of this chart and hit ENTER. Or open the Excel or PDF file (attachments are at the bottom of the page) and search for your representative. Business Tax Burden by Metropolitan Statistical Area (MSA), 2005 How much does the average resident of your metropolitan area pay in business taxes? To find out, type the name of your city or metropolitan area into the search box at the top of this chart and hit ENTER. (Only Metropolitan Statistical Areas, as defined by the Office of Management and Budget, are included in this chart.) Or open the Excel file (attachments are at the bottom of the page) and sort the chart by state to see all the metropolitan statistical areas in your state. National-Level Statutory Corporate Tax Rates, 2008 This chart shows the U.S. federal business tax rate compared to other countries’ national rates. State Corporate Income Tax Rates, 2000-2011 Find out how much your state taxes business. Federal Corporate Income Tax Rates, Income Years 1909-2008 The very first federal corporate income tax had a rate of only 1 percent. This chart tracks the history of the rate over nearly a century. State Business Tax Climate Index Rankings, 2003-2009 Which states are best for business? The Tax Foundation’s State Business Tax Climate Index ranks the states on various factors that affect their business-friendliness, including the corporate income tax. The full publication is available here, and this chart shows the rankings for all states for the past five years. State Business Tax Climate Index—Corporate Tax Index, 2009 State and Local Corporate Income Tax Collections Per Capita, Fiscal Year 2008 State Corporate Income Tax Collections Per Capita, Fiscal Year 2009 Fraction of Each Quintile’s Total Tax Burden Accounted for by Each Type of Tax, Calendar Year 2004 Across the income spectrum, households pay corporate taxes even if they don’t realize it. This chart shows what percentage of each household’s total tax burden is paid in federal business taxes. Average Dollar Tax Burdens by Type of Federal Tax, Per Household, Calendar Year 2004 This chart shows how much the average high-income household, middle-income household and r low-income household pays in business taxes as a dollar amount compared to other types of tax. Topics