Key Findings
- Since the 1970s, saving policy in the U.S. has primarily revolved around boosting retirement saving and other narrowly defined categories of saving, such as for health care and education, through complex rules and limitations that primarily benefit high-income earners.
- The approach leaves many categories of saving at a disadvantage and subject to double taxationDouble taxation is when taxes are paid twice on the same dollar of income, regardless of whether that’s corporate or individual income. through the income taxA tax is a mandatory payment or charge collected by local, state, and national governments from individuals or businesses to cover the costs of general government services, goods, and activities. , such as saving for emergencies, buying a home, starting a family or a business, or any of the other reasons people choose to save for the future.
- Other countries, such as Canada and the UK, have found a simpler solution that is more widely available and useful, boosting savings and financial security for households across the income scale. Universal savings accounts (USAs) are tax-advantaged savings vehicles with unrestricted use of funds, allowing participants to save for any reason without penalty or excessive paperwork.
- We simulate a Canada-style USA in the U.S., paid for by removing the tax advantages of health savings accounts (HSAs). We find this reform would be fiscally responsible, reducing deficits in the short run, while simplifying the tax code, reducing compliance costs, shifting the benefits toward low- and middle-income households, and boosting financial security for these households over the long run.
Introduction
Over the last few years, American households have been on a financial roller-coaster, having gone through the pandemic shutdown of the economy followed by massive amounts of government relief payments and fiscal stimulus, a surge in inflationInflation is when the general price of goods and services increases across the economy, reducing the purchasing power of a currency and the value of certain assets. The same paycheck covers less goods, services, and bills. It is sometimes referred to as a “hidden tax,” as it leaves taxpayers less well-off due to higher costs and “bracket creep,” while increasing the government’s spending power. , high interest rates, and an ongoing affordability crisis. Households initially responded by saving more, i.e., reducing consumption and saving the relief payments, but that “excess saving” has now been fully depleted, according to researchers at the Federal Reserve.[1] The average household saving rate has dropped to 3.2 percent as of March 2024, well below the pre-pandemic average and below rates found in many other developed countries.[2] As of 2022, the real (inflation-adjusted) value of financial assets for the median household remains lower than it was 20 years ago and has dropped roughly in half for the bottom 40 percent of households, according to the Federal Reserve’s Survey of Consumer Finances.[3]
Americans, particularly in younger generations, are increasingly relying on credit cards and other forms of debt to bridge the gap in their finances, and delinquency rates are trending up.[4] Older Americans, especially those with lower incomes, are tapping retirement savings to cover expenses, with one recent study projecting that the combination of high inflation and lower saving rates will reduce the financial wealth of lower-income retirees and near-retirees by about 20 percent by 2025.[5]
According to the Federal Reserve, the portion of Americans who have emergency savings to cover at least three months of expenses dropped from 59 percent in 2021 to 54 percent in 2022 and 2023.[6] Another recent survey indicates most Americans do not feel financially secure, including the vast majority of low- and middle-income earners, citing high inflation, high interest rates, and insufficient savings for emergencies as major areas of concern.[7]
Some researchers wonder what will happen now to consumer spending.[8] Another important question is what will happen to the financial security of U.S. households, particularly if high interest rates persist, the economy slows down, and unemployment rises? In the next economic downturn, it is unlikely the federal government will have the fiscal capacity to issue trillions of dollars of relief payments without sparking another surge in inflation, as the federal government’s fiscal outlook has worsened considerably since the pandemic.[9]
Over the long run, the most effective and sustainable way to improve financial security and upward mobility is through policies that lead to greater household saving and wealth accumulation at all levels of income. However, the current federal tax code generally discourages saving, since the income tax applies once to wages and then again to the return on wages that are saved. By contrast, there is no additional tax on wages that are consumed rather than saved. To offset this effect, the tax code contains a patchwork of preferences for saving with complicated rules that generally benefit higher-income households.[10]
Current law provides at least 11 different types of tax-advantaged saving vehicles, each with a variety of rules and limitations: four main types of retirement saving provisions, three more for saving related to education and disabilities, three more for saving related to health and dependent care, and one for saving related to emergencies (a new addition as part of the recently passed Secure 2.0 legislation).[11]
Other countries have found a simpler solution that is more widely available and useful, boosting savings for households across the income scale. Universal savings accounts (USAs) are tax-advantaged savings vehicles with unrestricted use of funds, allowing participants to save for a variety of reasons including retirement, education, housing, health, unemployment, and emergencies.
For example, Canada provides tax-free savings accounts (TFSAs) to anyone 18 or older with an annual contribution of up to CAD 7,000 (about $5,200), and any unused contributions from one year can be carried forward to the next year. Contributions are made with after-tax dollars, earnings grow tax-free, and withdrawals can be made at any time for any reason without penalty. The United Kingdom provides a similarly structured tax-advantaged saving option called individual savings accounts (ISAs) with an annual contribution limit of GBP 20,000 (about $25,000). Both programs are used widely across the income spectrum.[12]
In this study, we review the current law tax-advantaged saving options and their effects, then analyze in more detail the experience of USAs in Canada and the UK. Lastly, we use the Tax Foundation Taxes and Growth Model to simulate a policy in the U.S. of a Canada-style USA financed by ending tax preferences for contributions to health savings accounts, finding this would increase tax revenue over the next decade, simplify the tax code, shift benefits to lower-income households, and boost saving among low- and middle-income households.
Current Law Tax-Advantaged Saving Options Are Overly Complex and Restrictive
In the U.S. under current law, the most widely utilized tax-advantaged saving accounts are aimed at retirement, such as 401(k)s offered by employers and individual retirement accounts (IRAs). First established in the 1970s (1974 for IRAs and 1978 for 401[k]s), now just over half (54 percent) of the population of non-retired adults have a 401(k) or other defined contribution (DC) plan such as a 403(b), and about one-third have an IRA.[13] The rules for these saving options are complex and varied, but the tax advantages generally come in two forms:
- Contributions to traditional retirement accounts are excluded from taxable incomeTaxable income is the amount of income subject to tax, after deductions and exemptions. For both individuals and corporations, taxable income differs from—and is less than—gross income. up to an annual limit (in 2024, generally $23,000 for 401(k)s and $7,000 for IRAs), returns accumulate on a tax-deferred basis, and withdrawals are included in taxable income.
- Contributions to Roth versions of these accounts are included in taxable income but returns accumulate on a tax-free basis as withdrawals are excluded from taxable income.
The tax advantages for these two account types are generally equivalent under fixed tax rates and effectively remove the income tax’s additional layer of tax on income that is saved for retirement under the qualifying rules and limitations.[14] Scholars debate the degree to which these tax advantages have boosted saving in aggregate as opposed to merely shifting it from taxable saving accounts, but most studies do find on net a substantial increase in saving particularly among low-income earners who have access to and use these accounts.[15]
The problem with these retirement saving options is they are overly complex; they target only one of the many types of saving and are subject to a maze of limitations, restrictions, and trade-offs. There are a multitude of rules that determine allowable contributions for these accounts, including catch-up contributions for older workers and various income limitations, as well as rules that govern employer matching contributions, qualified withdrawals (generally for retirement based on age but there are many exceptions), penalties for non-qualified early withdrawals (generally 10 percent), loans from these accounts, rollovers (transfers of funds from one retirement account to another), and required minimum distributions in retirement.[16]
The rules for these options also change periodically. Most recently, they changed considerably due to the Secure 2.0 legislation in 2022, which, among other things, raised the age for required minimum distributions, allowed additional catch-up contributions for older workers, adopted automatic enrollment for certain retirement accounts, loosened restrictions and penalties on withdrawals and loans in cases of federally declared disasters and emergencies, increased the savers credit for contributions by low-income earners, and introduced a new type of emergency savings account tied to an existing defined contribution retirement account and subject to several limitations.[17]
The various limitations and complexity of these retirement accounts reduce their appeal. Low-income households in particular do not widely use them, and it is not at all clear that the Secure 2.0 changes will substantially change that.[18]
According to the latest surveys from the Bureau of Labor Statistics (BLS) on employer-sponsored DC retirement plans, access and participation are substantially lower among workers in low-income occupations and at smaller companies.[19] The latest data from 2022 indicates that while most workers (60 percent or more) have access to DC plans, and more than 70 percent of those with access participate, only a small minority of low-income earners have access to and participate in these plans.[20] For example, 43 percent of people in the lowest quarter of the wage distribution have access to a DC plan, and of those, 49 percent participate. Among the lowest 10 percent of wage earners, 35 percent have access to a DC plan, and of those, 45 percent participate.
According to IRS data from 2018, 42 percent of tax filers overall contributed to a DC plan, but less than 10 percent of those with wage income of $10,000 or less, and about 20 percent of those with wages between $15,000 and $20,000, did so. In contrast, more than 75 percent contributed among those with $100,000 or more in wages.[21]
A similarly skewed distribution of utilization occurs with IRAs, though at lower levels across all income levels. According to IRS data from 2020, about 10 percent of all tax filers eligible to contribute to an IRA did so; less than 5 percent contributed among those earning less than $25,000, whereas more than 16 percent contributed among those earning $100,000 or more.[22] Data from the Federal Reserve’s Survey of Consumer Finances from 2019 indicates that about 7 percent of low-income households (those earning less than $30,000) owned in IRA versus about 54 percent of high-income households (those earning $125,000 or more).[23]
Another unappealing feature of tax-advantaged retirement accounts is they generally require locking one’s savings up for several years or decades, with penalties for early withdrawal (though there are a proliferating number of special exceptions). This makes these options less attractive to younger workers and those with a short-term time horizon or present focus.[24] Research and the latest data indicate participation rates increase with age, peak at middle age, and decline somewhat closer to retirement age.[25]
Beyond retirement accounts, and the new Secure 2.0 pension-linked emergency accounts, current law provides several other tax-advantaged options to save for various specialized reasons, including for health and dependent care (health savings accounts, health flexible spending accounts, and dependent care flexible spending accounts) as well as for education and disabilities (qualified tuition plans [529s], Coverdell education savings accounts, and ABLE accounts).[26]
While these additional options cover more types of saving, they do not cover all types of saving, such as for housing, starting a new business, or for any number of reasons individuals choose to save. Like the retirement account options, they are replete with complicated rules and various limitations governing eligibility (which depends on interactions with these and other provisions of the tax code), income limitations, allowable contributions, and use of funds, e.g., defining qualified types of health-care and education expenses, which, among other parameters, are periodically changed by Congress.[27] Unlike the retirement saving vehicles, these options allow for more short-term use of funds under the qualifying rules, and in the case of flexible spending accounts (FSAs), the funds must be spent in the current year or otherwise be forfeited.
HSAs and FSAs come with extra tax advantages. Contributions are excluded from both income and payroll taxes, while withdrawals are also excluded from the income tax. This goes beyond a fix for the income tax’s bias against saving, representing a carveout (or “loophole”) under any standard definition of a broad-based income tax, wage tax, or consumption taxA consumption tax is typically levied on the purchase of goods or services and is paid directly or indirectly by the consumer in the form of retail sales taxes, excise taxes, tariffs, value-added taxes (VAT), or an income tax where all savings is tax-deductible. . As well, HSAs can be maintained for several years and accumulated earnings grow tax-free, giving them a special advantage in the tax code.
However, HSAs are limited in many ways: workers may only contribute to an HSA if enrolled in a qualifying high-deductible health plan (consisting of several tests), annual contributions are capped at relatively low levels ($4,150 for self-only coverage and $8,300 for family coverage in 2024, with $1,000 additional catch-up contributions allowed for those aged 55 or older), and withdrawals may only be used for qualified medical expenses or otherwise generally subjected to a 20 percent penalty.[28]
As a result of the complex rules and limitations of HSAs (which were first established in 2003), and despite the substantial tax benefits, they remain a niche product primarily utilized by high earners working at large employers.[29] BLS employee benefits survey data for 2022 indicates that while HSAs are offered to 35 percent of workers overall, they are offered to just 18 percent of those in the lowest quarter of the wage distribution and 12 percent of those in the lowest 10 percent of wage earners.[30] Furthermore, only about 18 percent of service workers had access, compared to about 50 percent of management, professional, and related workers, and access was lower for workers in low-paying occupations and those working at small firms.[31] The latest IRS data for 2021 indicates that only about 1.2 percent of tax filers reported an individual contribution to an HSA, and about 7.5 percent reported an employer contribution.[32] Of those earning under $50,000, less than 1 percent reported an individual contribution and less than 5 percent reported an employer contribution, whereas of those earning above $1 million, about 8 percent reported an individual contribution and about 12 percent reported an employer contribution.[33]
Research indicates that while HSAs in theory provide a powerful saving incentive and a more liquid alternative to tax-advantaged retirement accounts, in practice they are primarily used to fund health-care consumption.[34] The vast majority of account holders (88 percent as of 2021) keep the entire HSA balance in cash and over half withdraw amounts to pay for health-care expenses. Average HSA balances remain low as well, at about $4,300 as of 2021.[35] Together, this research points to the need for a simpler regime that incentivizes saving more generally and allows for a high degree of liquidity, for example, to cover emergency expenses and other short-term needs.
Canada’s Experience with Universal Savings Accounts
Since they began in 2009, Canada’s tax-free savings accounts (TFSAs) have provided Canadians a simple option to save tax-free without strings attached.[36] TFSAs are a type of universal savings account, in which individuals 18 or older can make contributions on an after-tax basis (i.e., non-deductible), earnings grow tax-free, and withdrawals can be made for any reason without triggering additional taxes or penalties.[37] The annual contribution limit in 2024 is CAD 7,000 (about $5,200), and it is indexed to inflation. Any unused contribution allowance (“room”) is carried forward to the next year, and any money withdrawn in the current year further adds to the subsequent year’s contribution room.
While Canada also offers tax-advantaged retirement account options similar to ours—registered pension plans (RPPs) that are similar to 401(k)s, and registered retirement savings plans (RRSPs) that are similar to traditional (deductible) IRAs—Canadians have quickly made TFSAs their preferred saving vehicle.[38] By 2013, the share of Canadian families contributing to TFSAs and the amount of TFSA contributions exceeded that of either RRSPs or RPPs. By 2020, TFSA contributions exceeded that of RRSPs and RPPs combined.
According to survey data from 2022, 58 percent of Canada’s adult population has a TFSA versus 46 percent with a retirement plan.[39] The gap is particularly wide for young adults, with 51 percent of people ages 18 to 34 owning a TFSA versus 38 percent owning a retirement plan, indicating that a major appeal of TFSAs is the immediate and unrestricted access to funds for various purposes besides retirement. When asked which goals are most important for saving and investing, the most common responses were to “retire comfortably” and “build a safety net,” the latter of which is better addressed with TFSAs than retirement accounts.
A study based on 2015 data shows that low-income households are much more likely to contribute to TFSAs than tax-advantaged retirement accounts.[40] Among households earning under CAD 80,000, about 34 percent contributed to a TFSA, substantially higher than the 20 percent who contributed to a retirement plan or 18 percent who contributed to a pension plan. The contrast is even more stark for lower-income groups (e.g., among people earning less than CAD 10,000); about 15 percent contributed to a TFSA while just 3 percent contributed to a retirement plan and 1 percent to a pension plan.
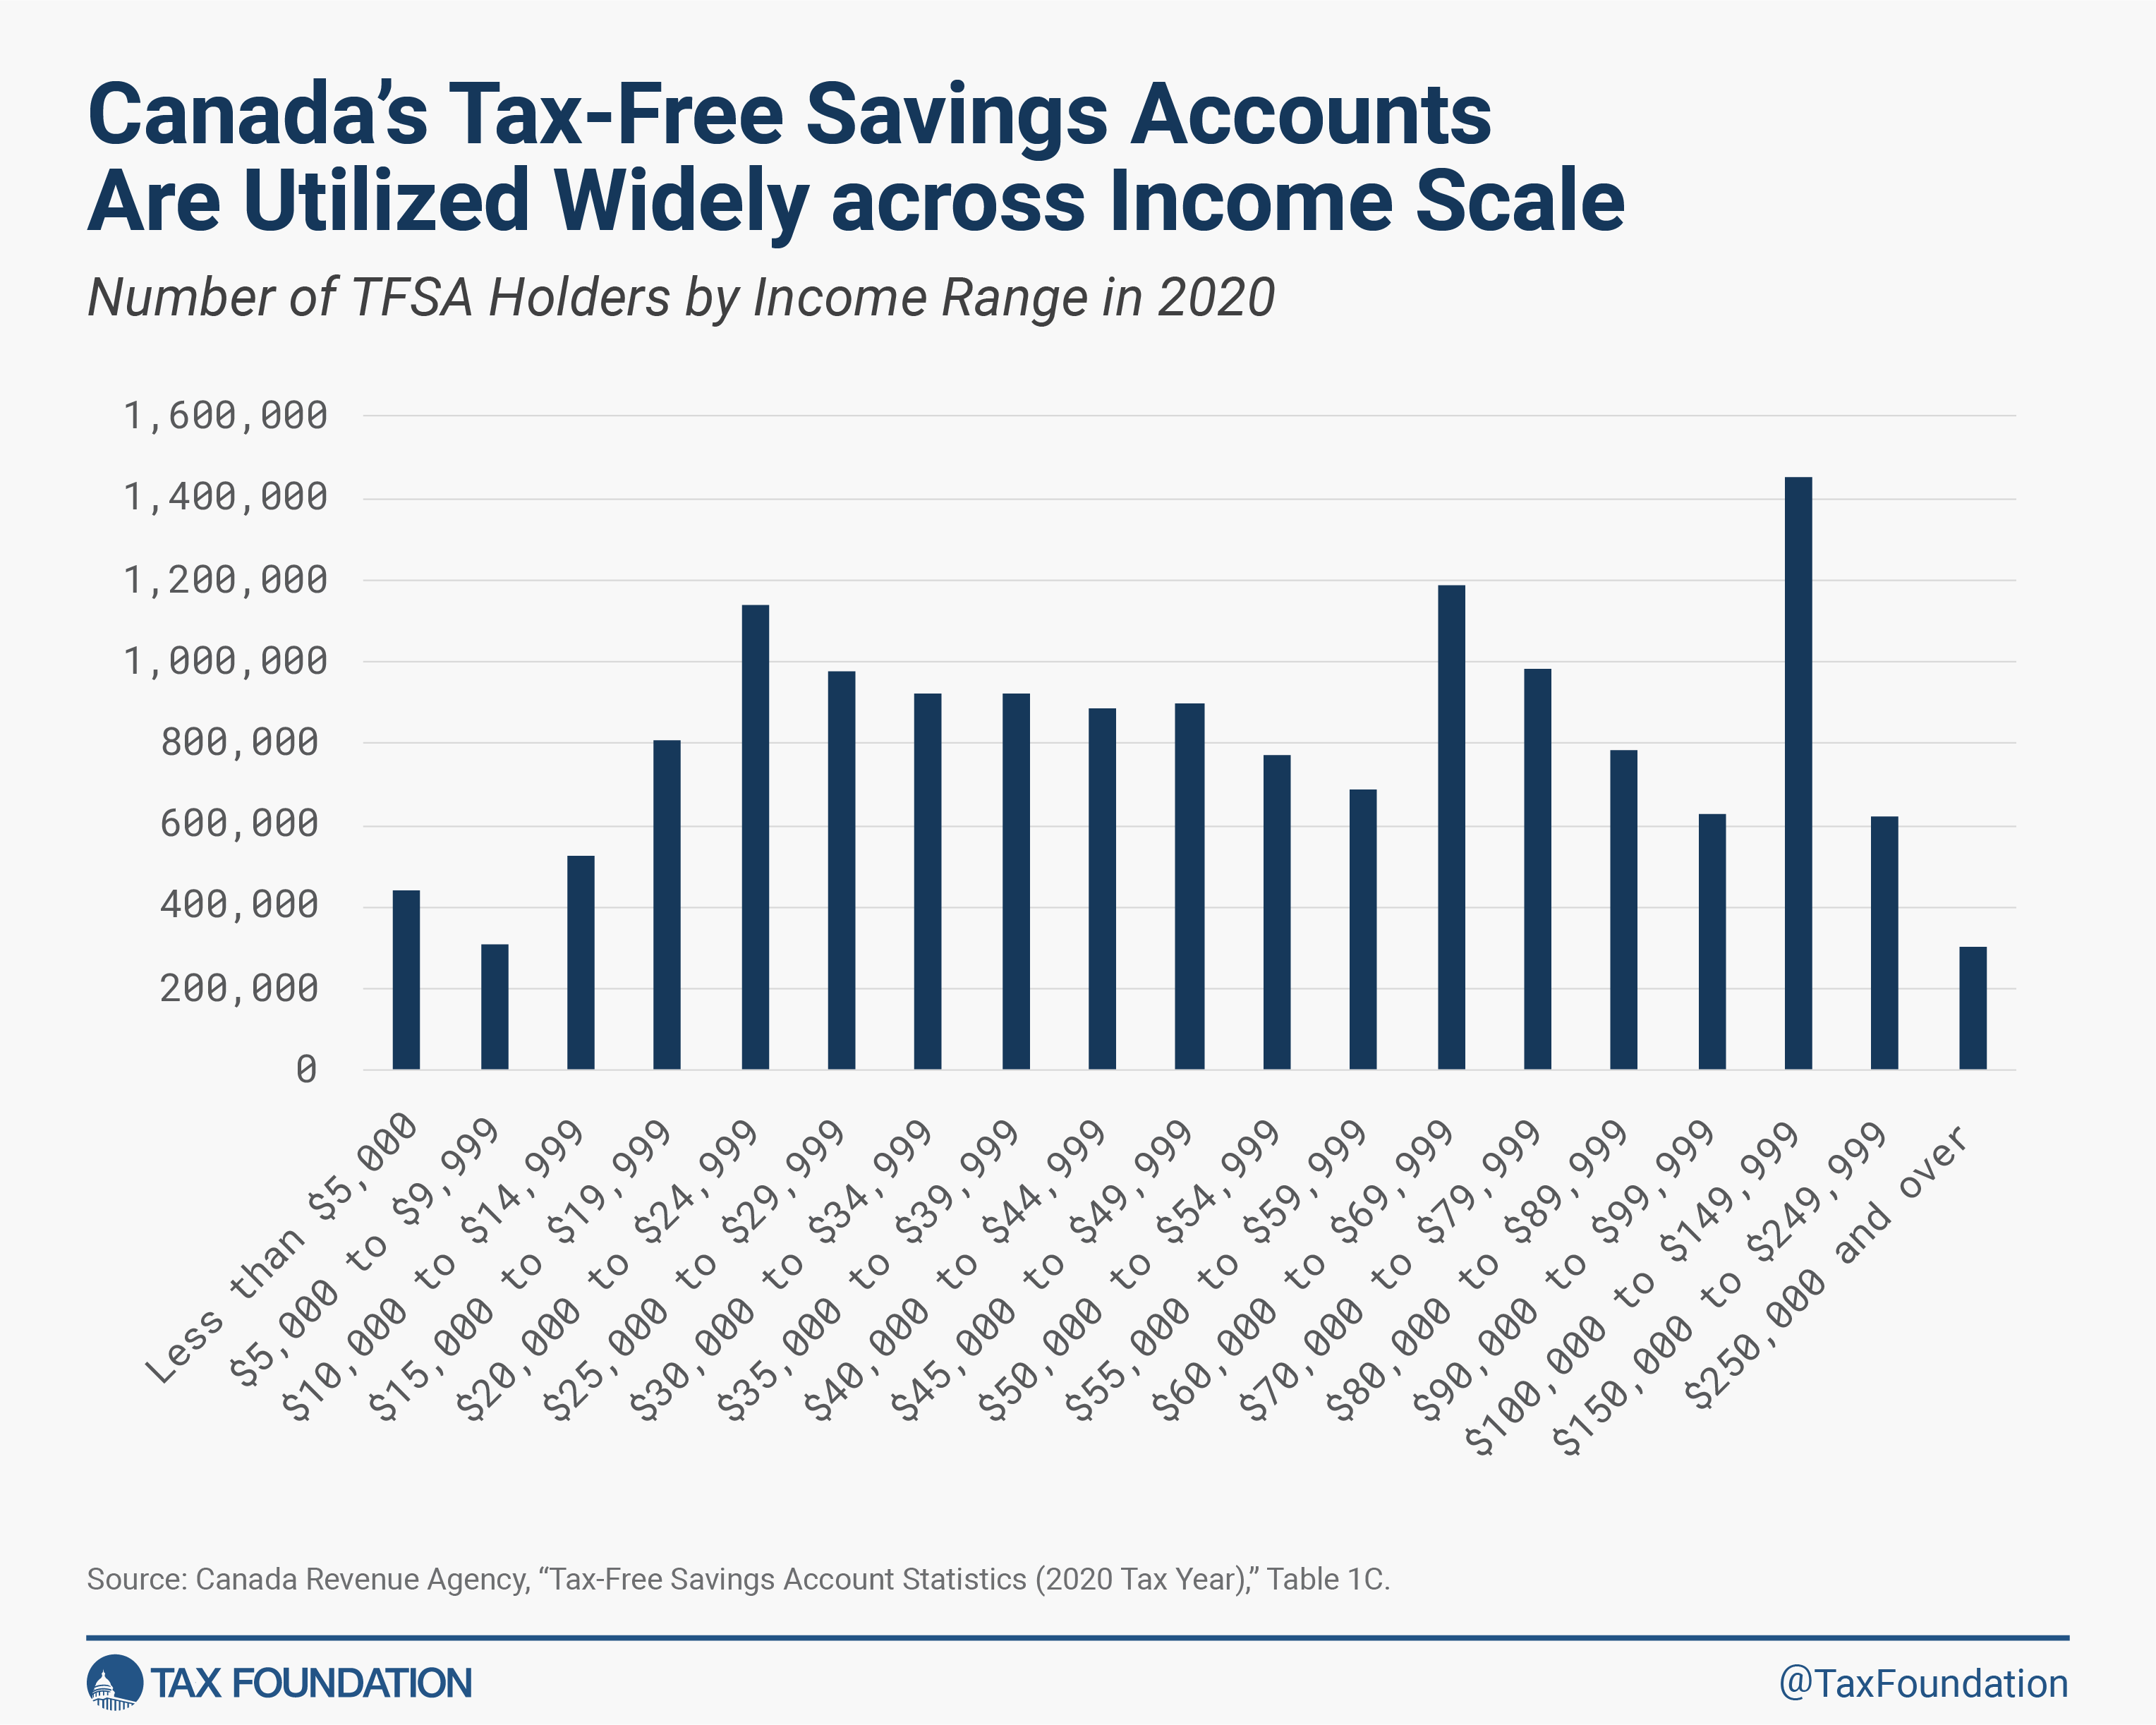
The latest statistics show Canadians across the income spectrum use TFSAs extensively. In 2020, 16.1 million Canadians owned a TFSA, more than half of the adult population (54 percent of the tax-filing population, which closely matches the adult population).[41] Of the 16.1 million adults with a TFSA, 3.2 million earned less than CAD 25,000, indicating about one-third of this low-income group owned a TFSA. Among adults earning between CAD 25,000 and CAD 40,000, about half own a TFSA. The share of adults with a TFSA rises with income: more than three out of four adults earning at least CAD 150,000 own a TFSA.
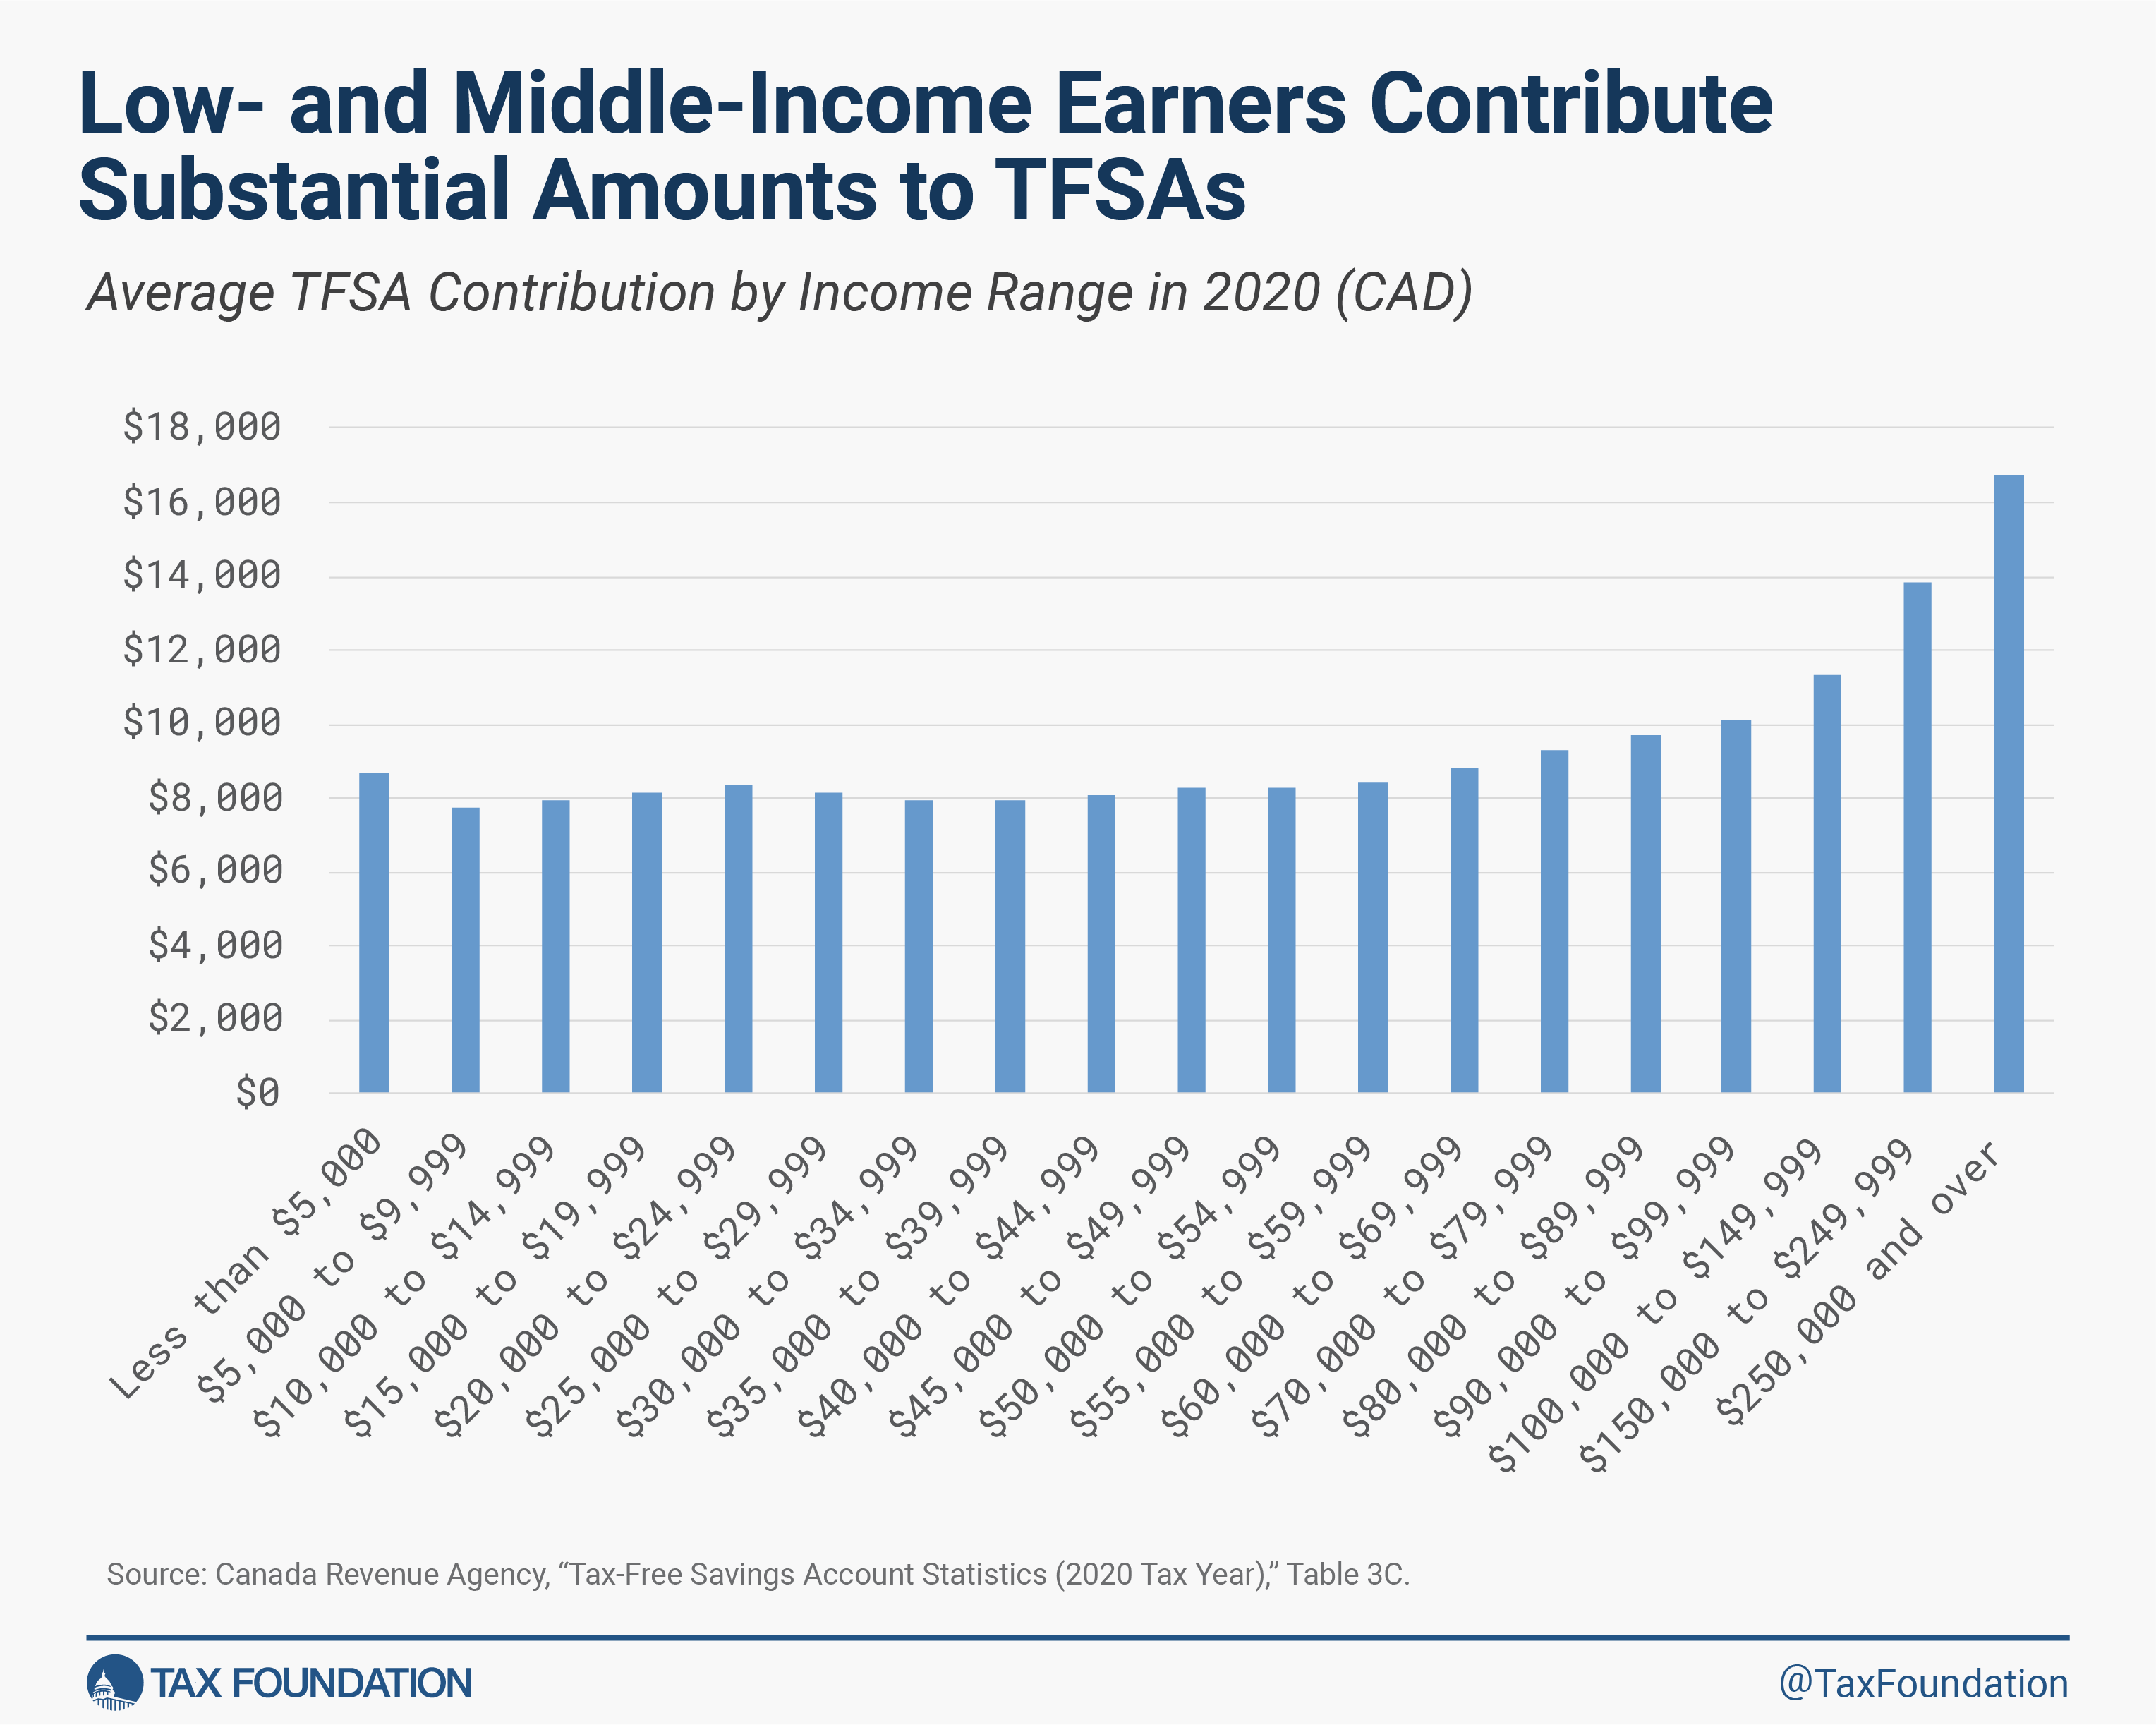
The average TFSA contribution is remarkably flat across the income scale but does rise for people earning more than about CAD 60,000. The average contribution is about CAD 8,000 for each income group earning below CAD 60,000 and rises to about CAD 17,000 for people earning more than CAD 250,000.
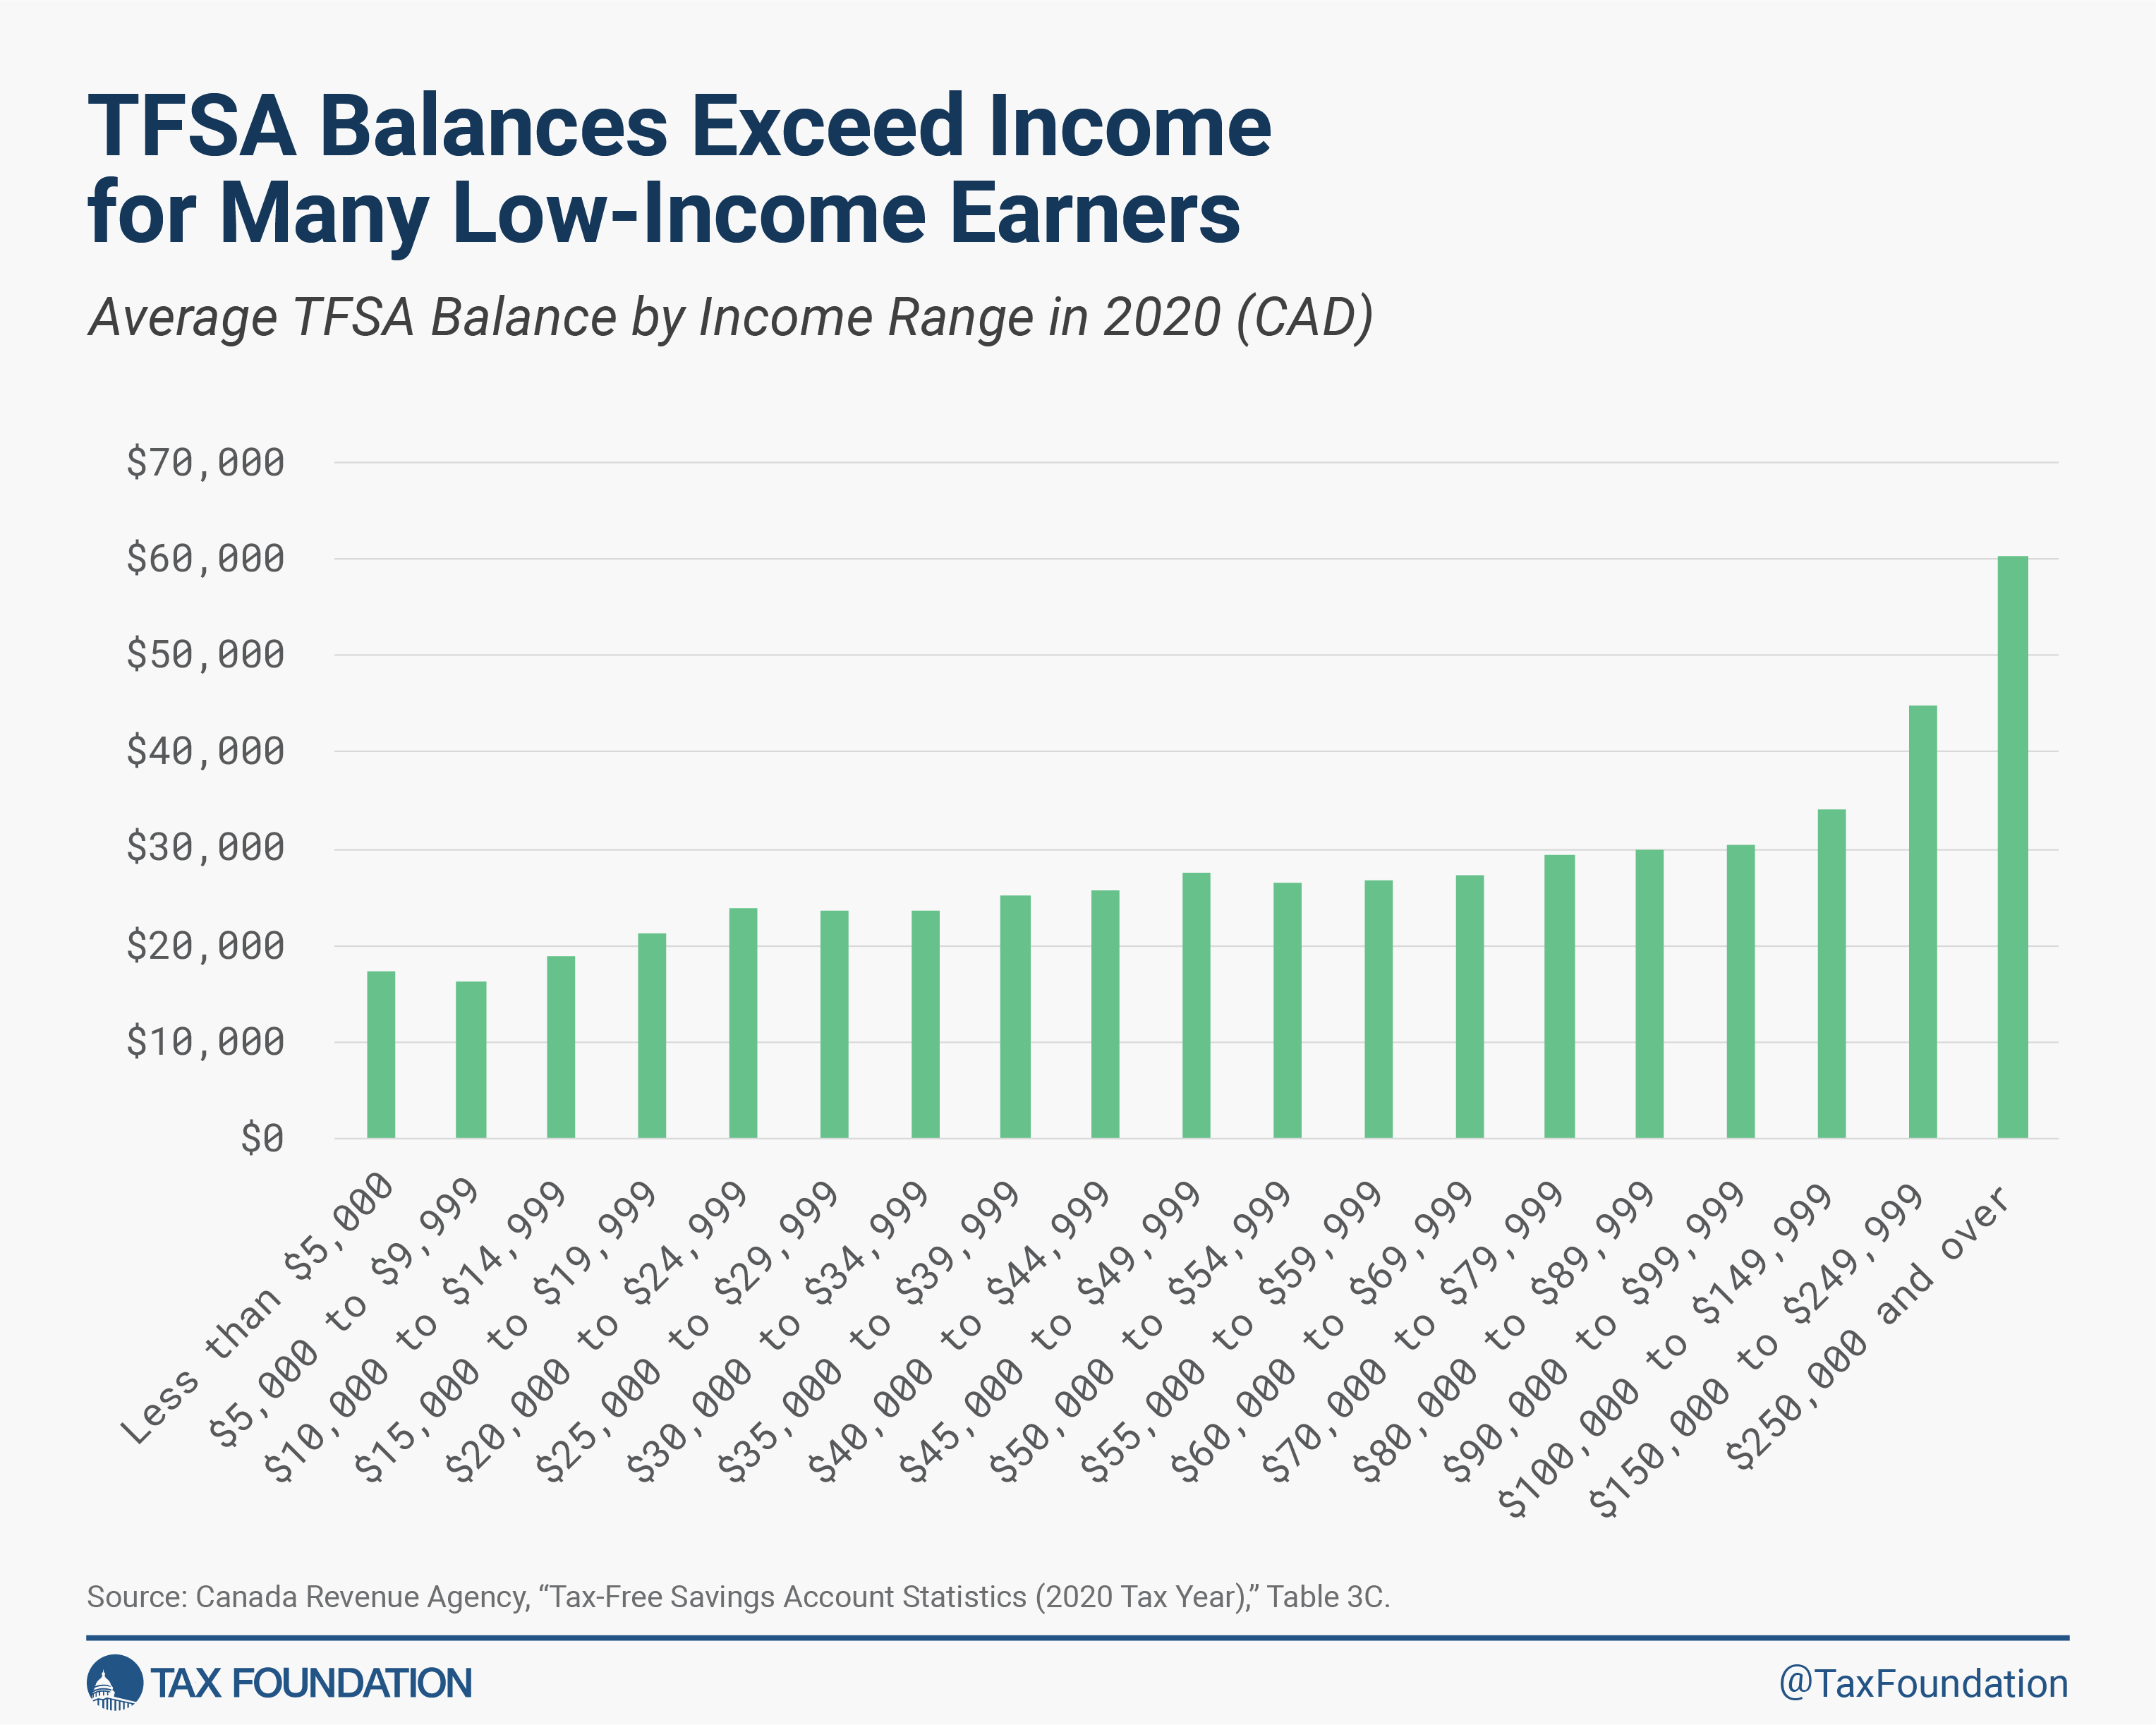
The average TFSA balance rises with income but is still quite substantial for all income groups, even exceeding income for many low-income earners. For the lowest income group—people earning less than CAD 5,000—the average TFSA balance is about CAD 17,000. For people earning between CAD 15,000 and CAD 20,000, the average TFSA balance is about CAD 21,000. TFSA balances rise to about CAD 60,000 on average for people earning more than CAD 250,000.
In short, Canada’s universal savings accounts appear to be a huge success in terms of encouraging private saving and financial security for households across the income scale, effectively establishing an accessible rainy day fund for millions of low- and middle-income households. Low-income households strongly prefer and utilize TFSAs rather than tax-advantaged retirement accounts.
UK’s Experience with Universal Savings Accounts
The UK has its own version of universal savings accounts, called individual savings accounts (ISAs). Individual savings accounts began as personal equity plans (PEPs) in 1986, which were intended to broaden investment opportunities for savers in the UK. The PEPs originally allowed for contributions up to GBP 2,400 annually. In 1999, the PEPs were replaced by ISAs, and the maximum annual contribution was increased several times to GBP 20,000 (about $25,000) annually in 2024. ISAs supplement the UK’s retirement savings system, which includes pensions that operate like U.S. traditional 401(k) plans.
Like tax-free savings accounts (TFSAs) in Canada, the UK’s ISAs are Roth-style tax-advantaged savings accounts, where contributions are made with after-tax dollars and earnings grow tax-free. There are no taxes, penalties, or restrictions on withdrawals, making ISAs a simple way for households to save for a variety of future financial goals. Also, like Canada’s TFSAs, but unlike Roth IRAs in the U.S., there are no income limits for ISA eligibility.
In addition to saving in ISAs, households in the UK may contribute up to GBP 9,000 annually in a Junior ISA for their children, and adults aged between 18 and 50 can contribute another GBP 4,000 in a lifetime ISA, a program that began in 2017 to encourage saving for a home or to supplement retirement savings.[42]
Individual savings accounts have grown in popularity over time. In 1999, about GBP 28.4 billion was invested in ISAs across 9.3 million people.[43] By 2021, nearly GBP 67 billion was invested across 11.8 million people within adult ISAs.
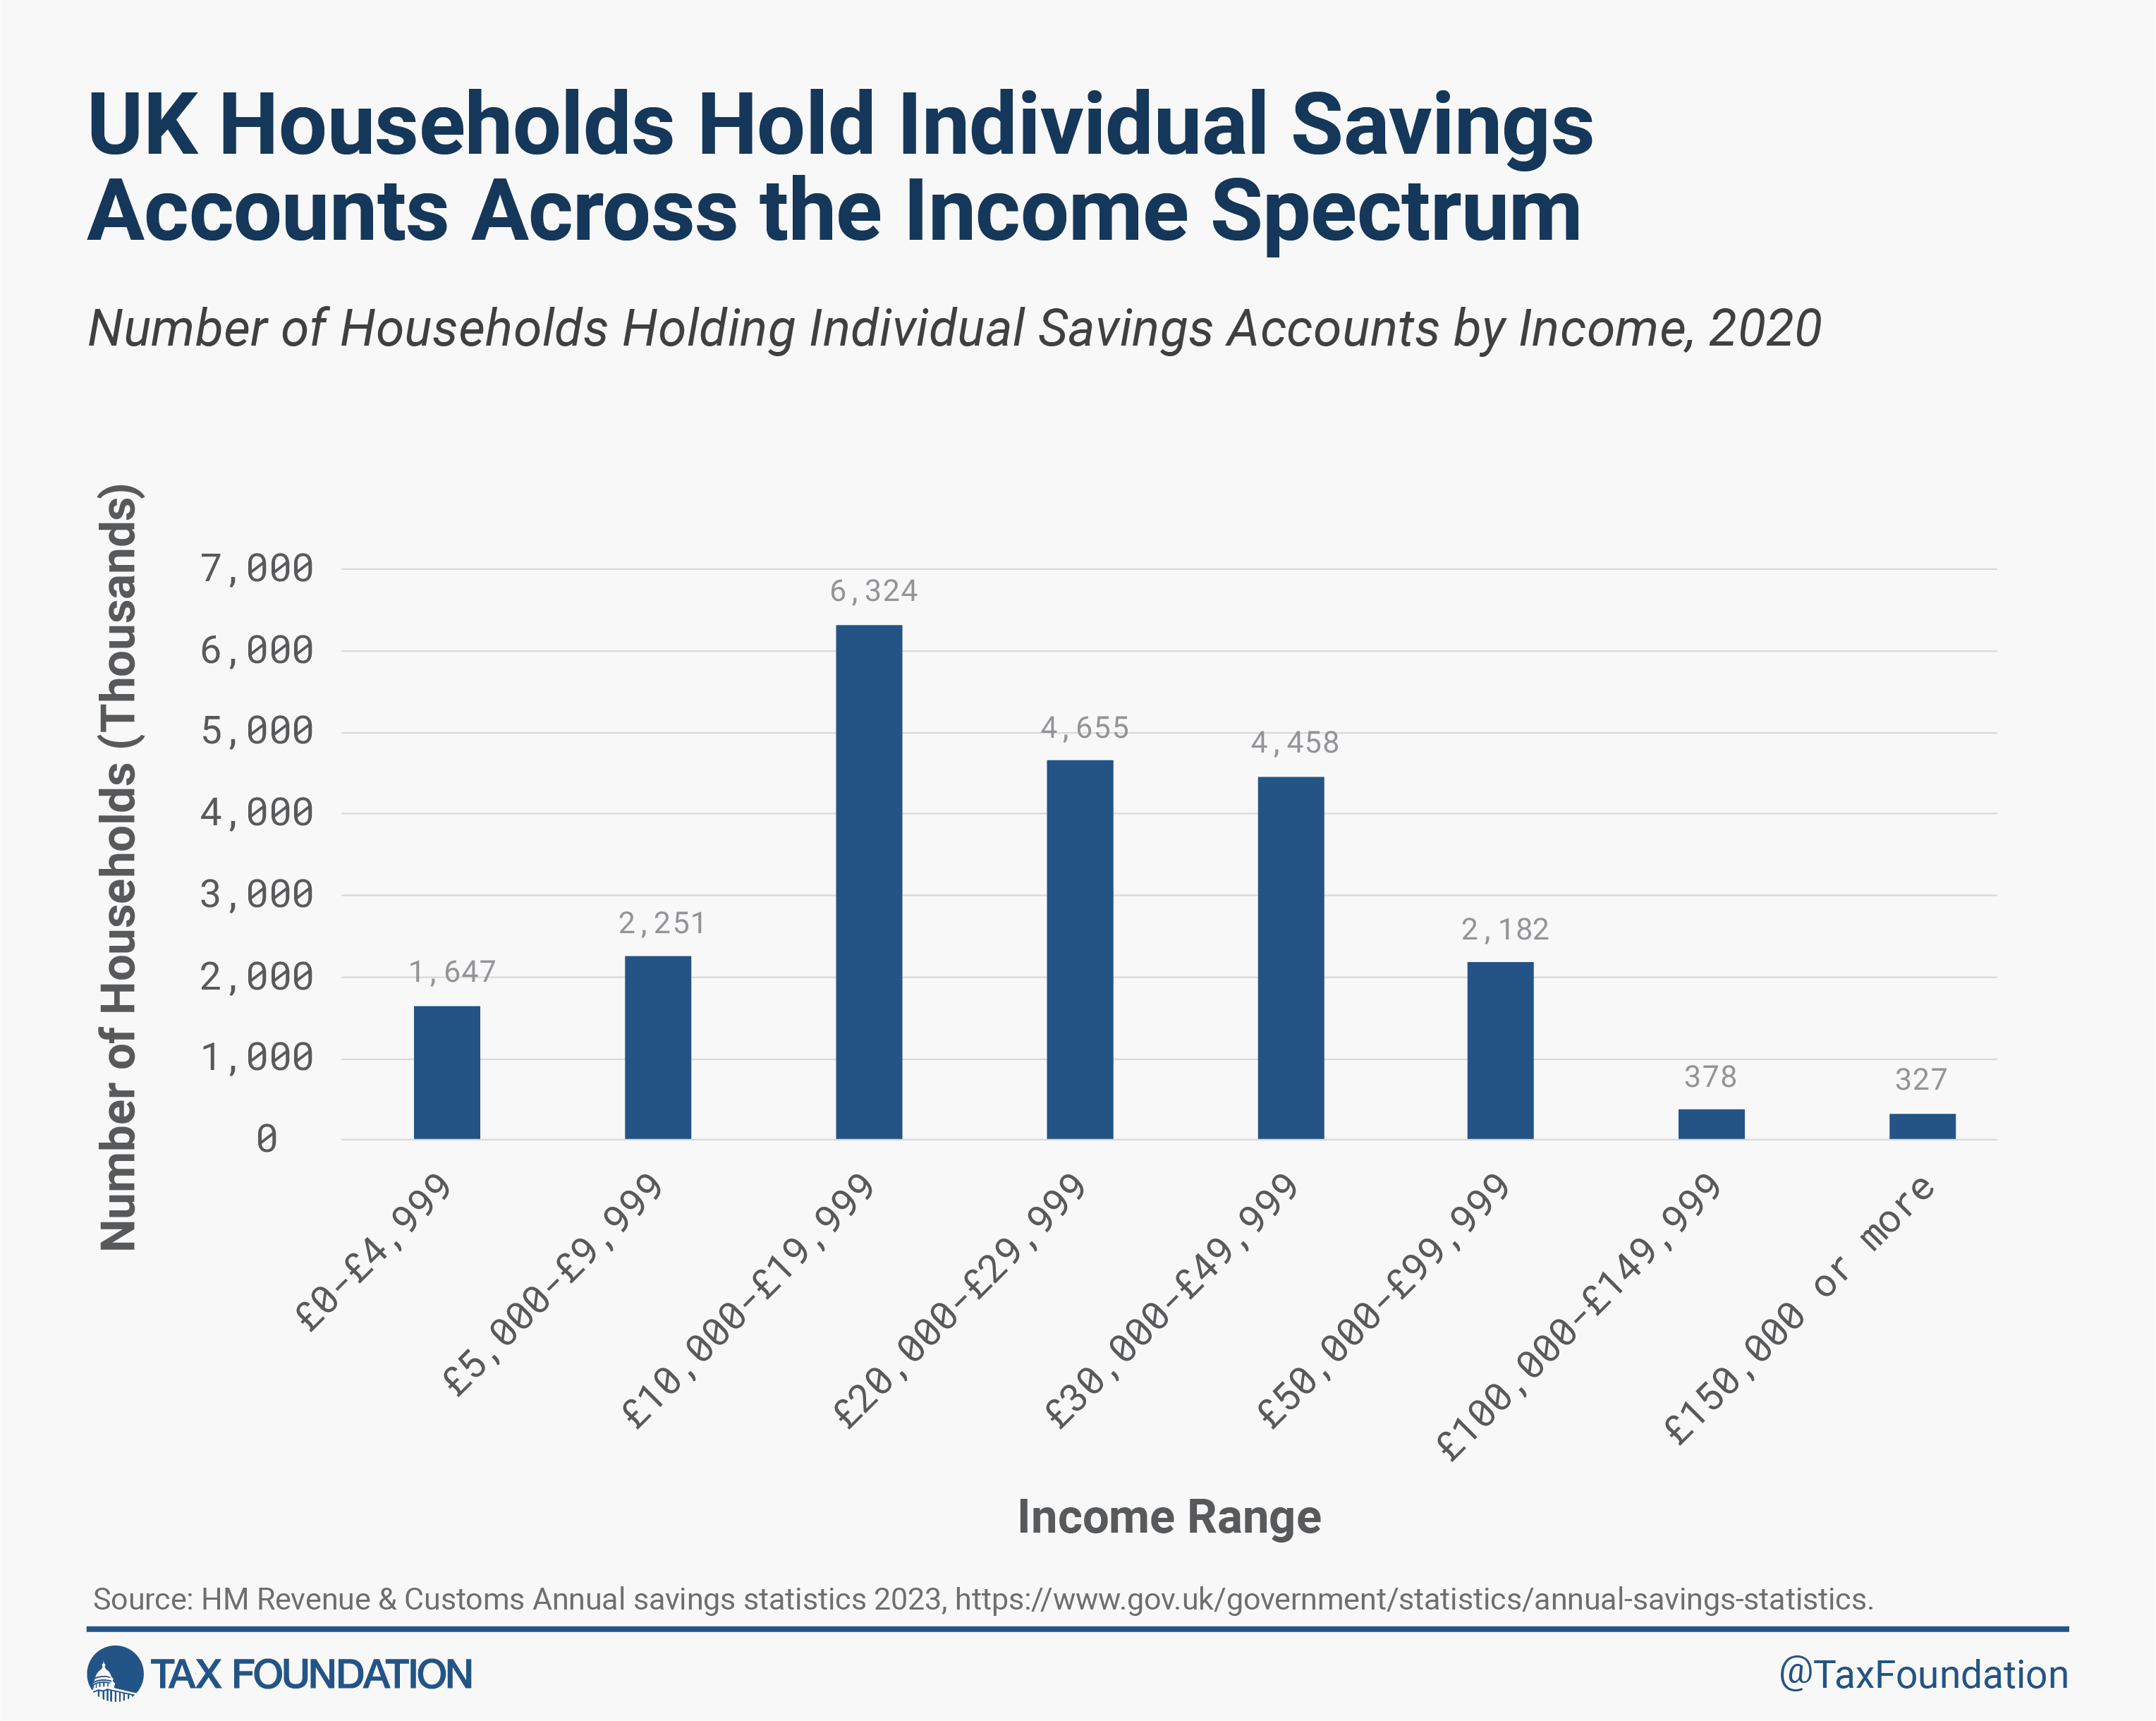
More than 22 million people in the UK hold some type of ISA—roughly 40 percent of the eligible adult population representing households across the income spectrum. A larger portion of UK households contribute to ISAs than Americans who contribute to Roth IRAs.[44]
As with Canada’s TFSAs, many low- and moderate-income households in the UK make substantial use of ISAs. More than 10 million households with ISAs, about 46 percent of households contributing to any type of ISA, earn under GBP 20,000 (about $25,000) per year. More than 19 million households, about 87 percent of ISA holders, earn less than GBP 50,000 (about $62,675) annually.
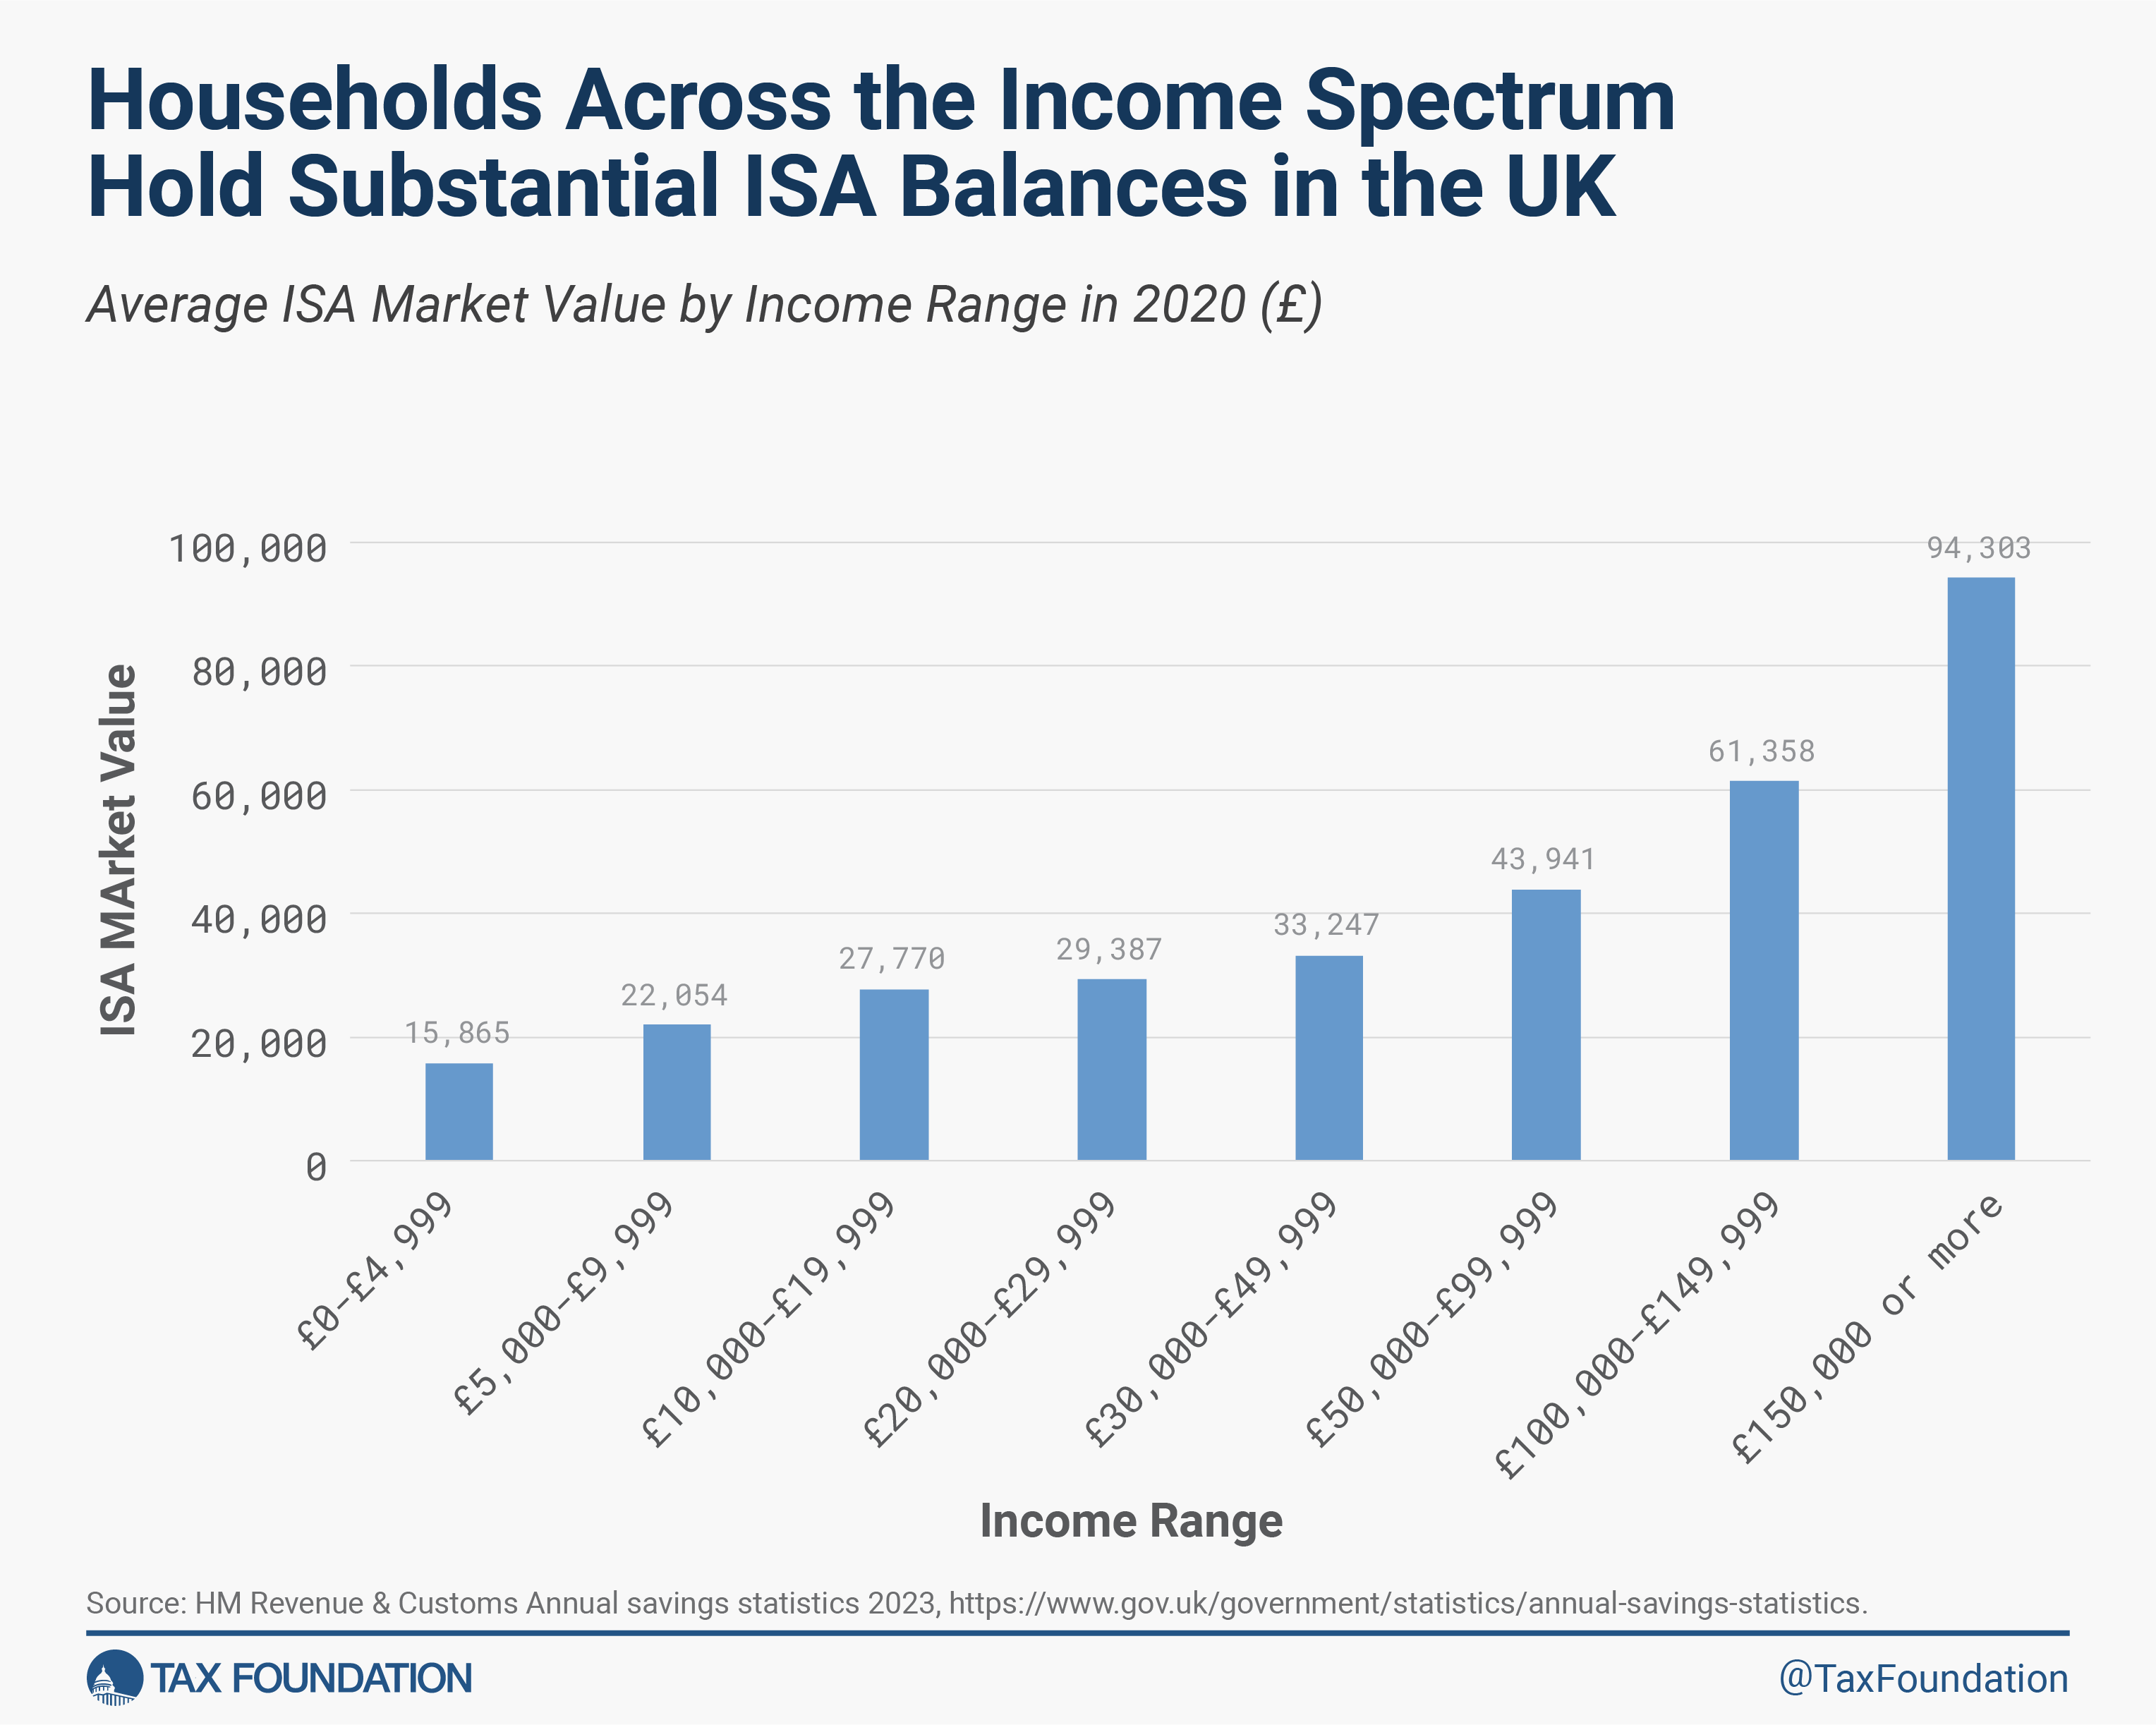
The market value of ISA holdings also shows that the program has attracted savings from households across the income spectrum. The average market value of ISA accounts was GBP 30,885 in 2020. Households earning less than GBP 5,000 with an ISA held about GBP 15,865 on average—more than triple their income. Those earning between GBP 5,000 and GBP 10,000 with an ISA held about GBP 22,054 on average—more than double their income. As income rises, so does the value of ISA holdings but less than proportionately. Those earning GBP 150,000 or more held an average ISA market value of GBP 94,303. Most households with an ISA, about 53 percent, held at least GBP 5,000 in their account.
Table 1: UK Individual Savings Accounts Holdings Are Broadly Held across Income Levels
Number of Account Holders by Market Value of ISA and Income Level, 2023
| Range of Income of All ISA Holders | £1-£2,499 (thousands) | £2,500-£4,999 (thousands) | £5,000-£9,999 (thousands) | £10,000-£14,999 (thousands) | £15,000-£19,999 (thousands) | £20,000-£24,999 (thousands) | £25,000-£49,999 (thousands) | £50,000 or more (thousands) | Total (thousands) | Average ISA Market Value (£) |
|---|---|---|---|---|---|---|---|---|---|---|
| £0-£4,999 | 931 | 140 | 140 | 77 | 52 | 58 | 104 | 144 | 1,647 | 15,865 |
| £5,000-£9,999 | 1,004 | 183 | 212 | 146 | 97 | 102 | 217 | 290 | 2,251 | 22,054 |
| £10,000-£19,999 | 2,377 | 463 | 619 | 404 | 320 | 335 | 741 | 1,065 | 6,324 | 27,770 |
| £20,000-£29,999 | 1,846 | 373 | 442 | 293 | 210 | 212 | 473 | 807 | 4,655 | 29,387 |
| £30,000-£49,999 | 1,699 | 335 | 420 | 291 | 202 | 235 | 469 | 806 | 4,458 | 33,247 |
| £50,000-£99,999 | 695 | 131 | 185 | 139 | 110 | 140 | 272 | 510 | 2,182 | 43,941 |
| £100,000-£149,999 | 89 | 16 | 26 | 20 | 18 | 28 | 57 | 123 | 378 | 61,358 |
| £150,000 or more | 49 | 9 | 13 | 12 | 14 | 25 | 47 | 158 | 327 | 94,303 |
| All ranges | 8,689 | 1,651 | 2,057 | 1,382 | 1,024 | 1,137 | 2,379 | 3,904 | 22,221 | 30,885 |
It is clear why individual savings accounts are popular in the UK: they are a simple, liquid savings option for households, functioning like a regular savings or investment account but without any tax on the returns and no restrictions on the use of funds. This is attractive and useful to millions of UK households at different income levels, life stages, and with different financial goals.
While ISAs are popular and superior to the available options in the U.S., the distinction between adult and junior ISAs can cause confusion, and the strict cap on annual contributions limits how much savings can benefit from the program. This may explain why Canada’s more straightforward TFSAs are even more widely used and have been adopted at a faster rate since becoming available in 2009.
For U.S. policymakers looking to encourage greater saving and financial security, particularly among low- and moderate-income households facing serious affordability challenges, the experiences in both the UK and Canada indicate that universal savings accounts are an effective policy tool to help reach that goal.
Simulating Universal Savings Accounts in the U.S.
Using the Tax Foundation Taxes and Growth Model (a.k.a., General Equilibrium Model), we simulated the effects of implementing a Canada-style USA in the U.S. beginning in 2025, with policy parameters essentially the same as in Canada (scaled by the ratio of the two countries’ nominal GDP).[45] Under the simulated policy scenario, beginning in 2025, all adults aged 18 or older in the U.S. are allowed to set up a USA with a participating financial institution. On a post-tax basis, individuals are allowed to contribute up to $9,100 to their USA in 2025, a cap that is indexed to inflation thereafter, and any unused “contribution room” is carried forward to the next year. Earnings on contributions are allowed to grow tax-free, and withdrawals are allowed at any time for any reason without penalty or further taxation. Any withdrawal of funds is added back to that year’s contribution room. For example, if an individual withdraws $1,000, that individual’s contribution room increases by $1,000 that year and may be used in the current year or carried forward.
As with a standard (brokerage) investment account, individuals may choose to invest USA balances across a portfolio of stocks, bonds, mutual funds, cash, money market funds, etc., according to the offerings of the financial institution administering the account. As with a standard investment account, or savings account, investment and other administrative fees would be low, reflecting a widespread and competitive market in which essentially all financial institutions would participate (as is the case today in Canada).[46]
The fiscal cost of this USA policy would be offset by ending the tax advantages of contributions to HSAs beginning in 2025 (current law treatment would continue to apply to existing HSA balances including the tax advantages).[47] As such, future contributions to HSAs would be given normal tax treatment, i.e., included in taxable income and subject to payroll taxA payroll tax is a tax paid on the wages and salaries of employees to finance social insurance programs like Social Security, Medicare, and unemployment insurance. Payroll taxes are social insurance taxes that comprise 24.8 percent of combined federal, state, and local government revenue, the second largest source of that combined tax revenue. with subsequent returns on contributions also included in taxable income.
We find that this policy change would on net raise tax revenue by about $110 billion over the 10-year budget window (2025-2034), measured on a conventional basis, or about $106 billion measured on a dynamic basis, which accounts for economic impacts. The revenue gain is front-loaded, with the policy initially raising about $13 billion in 2025 before falling to about $7 billion in 2034 and, in the long run, producing a small revenue loss.
The transitional revenue gain is due to the Roth treatment of USAs, where contributions are made on a post-tax basis, reducing the initial revenue loss to about $2 billion in 2025 from that policy change in isolation, whereas subjecting future HSA contributions to income and payroll taxes raises about $15 billion in 2025.
In the results below, we assume the net tax revenue raised is used to reduce the deficit, which boosts national saving and reduces upward pressure on inflation and interest rates. There are many alternative uses, of course. Among the alternative options (none of which we modeled) would be to rebate the net tax increase back to taxpayers in the form of a one-time payment to all taxpayers or to the subset of taxpayers that open a USA, i.e., a one-time payment upon first opening a USA (amounting to roughly $700 per account holder). Another alternative is to use the revenue to increase the annual cap on USA contributions. Yet another alternative is to use the revenue to diminish or eliminate other anti-saving provisions in the tax code, such as the estate taxAn estate tax is imposed on the net value of an individual’s taxable estate, after any exclusions or credits, at the time of death. The tax is paid by the estate itself before assets are distributed to heirs. or the net investment income tax (NIIT), or boost other saving incentives like the savers credit by allowing it to apply to USA contributions.
Table 2. Revenue Effects of Replacing HSAs with USAs
| Provision (Billions of Dollars) | 2025 | 2026 | 2027 | 2028 | 2029 | 2030 | 2031 | 2032 | 2033 | 2034 | 2025 - 2034 |
|---|---|---|---|---|---|---|---|---|---|---|---|
| Introduce Canada-style USA beginning January 1, 2025 | -2.0 | -3.6 | -5.3 | -6.8 | -8.4 | -10.3 | -12.5 | -14.8 | -15.7 | -18.2 | -97.6 |
| End HSA tax advantages for contributions made after December 31, 2024 | 15.3 | 17.4 | 18.9 | 19.5 | 20.4 | 21.3 | 22.1 | 22.9 | 23.8 | 24.9 | 206.4 |
| Total Conventional Revenue | 13.5 | 13.9 | 13.5 | 12.6 | 11.9 | 10.8 | 10.0 | 8.5 | 8.5 | 7.1 | 110.2 |
| Total Dynamic Revenue | 13.1 | 13.3 | 13.0 | 12.1 | 11.4 | 10.3 | 9.5 | 8.1 | 8.1 | 6.7 | 105.6 |
We estimate the economic effects of replacing HSAs with USAs to be limited in part due to the relatively small net impact on tax revenue as well as the offsetting effects of substituting one saving incentive for another. We find approximately zero impact on GDP, GNP, the capital stock, and wages over the long run. The policy would, in the long run, slightly reduce the number of jobs by about 17,000 due to higher marginal tax rates on labor compensation that would result from ending HSA treatment.
We find the policy would boost private saving by about 0.1 percent over the long run as the share of the population using USAs grows along with the share of aggregate private saving that is shielded from double taxation. As described above, the latest statistics in Canada indicate that 12 years after the TFSA policy was initiated, more than half (54 percent) of the adult population uses a TFSA, including between one-third and one-half of low-income earners (defined as those earning less than about $30,000). Low- and middle-income TFSA owners hold about $15,000 on average in their TFSAs while higher-income earners hold substantially more.
We estimate the policy would, in the long run, effectively exempt from taxation most investment income that is earned by low- and middle-income households, boosting saving substantially among these households. Due to the cap on annual contributions, only a small fraction of investment income earned by high-income households would effectively be exempt, causing a smaller increase in saving among these households. And because most aggregate saving is done by high-income households, the total effect on aggregate saving is small.
Our modeling does not fully account for the economic benefits of simplification that would result from this policy, e.g., from reduced compliance costs on the part of individual taxpayers, employers, and financial institutions as well as reduced administrative costs for the IRS.
Table 3. Long-Run Economic Efffects of Replacing HSAs with USAs
| Provision | Gross Domestic Product (GDP) | Gross National Product (GNP) | Capital Stock | Wage Rate | Full-Time Equivalent Jobs | Gross Private Saving |
|---|---|---|---|---|---|---|
| Introduce Canada-style USA beginning January 1, 2025 | Less than 0.05% | 0.1% | Less than 0.05% | Less than 0.05% | 15,000 | 0.1% |
| End HSA tax advantages for contributions made after December 31, 2024 | Less than -0.05% | Less than -0.05% | Less than -0.05% | Less than 0.05% | -36,000 | Less than -0.05% |
| Total Economic Effect | Less than 0.05% | Less than 0.05% | Less than 0.05% | Less than 0.05% | -17,000 | 0.1% |
Regarding the distributional impacts of replacing HSAs with USAs, we find the policy would, on net, have a limited impact on the distribution of the tax burden as measured by changes in after-tax incomeAfter-tax income is the net amount of income available to invest, save, or consume after federal, state, and withholding taxes have been applied—your disposable income. Companies and, to a lesser extent, individuals, make economic decisions in light of how they can best maximize their earnings. . However, we find the policy would be slightly progressive, reducing after-tax income of high-income earners on average while having approximately zero impact on the after-tax income of low-income earners, on average and measured on a conventional basis (note this is based on actual results with HSAs in the U.S. and TFSAs in Canada). For example, the top quintile of earners would see a net reduction in after-tax income of about 0.1 percent on average over the next decade, while the bottom 40 percent of earners would see approximately no change on average.
In total for taxpayers on average, after-tax income would fall by about 0.1 percent in 2025 and by a smaller amount in 2034, reflecting the net tax increase in those years. Over the long run, and accounting for economic impacts, taxpayers across every quintile would see a small increase in after-tax income on average, but the top 5 percent of earners would continue to see a small decrease in after-tax income on average.
Tables 5 and 6 break down the distributional results by policy change, showing that implementing a Canada-style USA would generally increase after-tax income, while ending the tax advantages of future USA contributions would generally reduce after-tax income, though the impacts are small for the bottom quintile.
Table 4. Distributional Effects of Replacing HSAs with USAs (Percent Change in After-Tax Income)
| Conventional, 2025 | Conventional, 2034 | Dynamic, Long Run | |
|---|---|---|---|
| 0% - 20.0% | Less than -0.05% | Less than -0.05% | Less than 0.05% |
| 20.0% - 40.0% | Less than -0.05% | Less than 0.05% | Less than 0.05% |
| 40.0% - 60.0% | -0.1% | Less than 0.05% | 0.1% |
| 60.0% - 80.0% | -0.1% | Less than -0.05% | 0.1% |
| 80.0% - 100% | -0.1% | -0.1% | Less than 0.05% |
| 80.0% - 90.0% | -0.1% | Less than -0.05% | 0.1% |
| 90.0% - 95.0% | -0.1% | -0.1% | Less than 0.05% |
| 95.0% - 99.0% | -0.2% | -0.1% | -0.1% |
| 99.0% - 100% | -0.1% | -0.1% | Less than -0.05% |
| Total | -0.1% | Less than -0.05% | Less than 0.05% |
Table 5. Distributional Effects of Implementing USAs (Percent Change in After-Tax Income)
| Conventional, 2025 | Conventional, 2034 | Dynamic, Long Run | |
|---|---|---|---|
| 0% - 20.0% | Less than 0.05% | Less than 0.05% | Less than 0.05% |
| 20.0% - 40.0% | Less than 0.05% | Less than 0.05% | 0.1% |
| 40.0% - 60.0% | Less than 0.05% | 0.1% | 0.1% |
| 60.0% - 80.0% | Less than 0.05% | 0.1% | 0.2% |
| 80.0% - 100% | Less than 0.05% | 0.1% | 0.2% |
| 80.0% - 90.0% | Less than 0.05% | 0.1% | 0.3% |
| 90.0% - 95.0% | Less than 0.05% | 0.1% | 0.2% |
| 95.0% - 99.0% | Less than 0.05% | 0.1% | 0.1% |
| 99.0% - 100% | Less than 0.05% | Less than 0.05% | 0.1% |
| Total | Less than 0.05% | 0.1% | 0.2% |
Table 6. Distributional Effects of Ending Tax Advantages of HSAs (Percent Change in After-Tax Income)
| Conventional, 2025 | Conventional, 2034 | Dynamic, Long Run | |
|---|---|---|---|
| 0% - 20.0% | Less than -0.05% | Less than -0.05% | Less than -0.05% |
| 20.0% - 40.0% | Less than -0.05% | Less than -0.05% | -0.1% |
| 40.0% - 60.0% | -0.1% | -0.1% | -0.1% |
| 60.0% - 80.0% | -0.1% | -0.1% | -0.1% |
| 80.0% - 100% | -0.1% | -0.2% | -0.2% |
| 80.0% - 90.0% | -0.1% | -0.2% | -0.2% |
| 90.0% - 95.0% | -0.1% | -0.2% | -0.2% |
| 95.0% - 99.0% | -0.2% | -0.2% | -0.2% |
| 99.0% - 100% | -0.1% | -0.1% | -0.1% |
| Total | -0.1% | -0.1% | -0.2% |
Conclusion
Since the 1970s, saving policy in the U.S. has primarily revolved around boosting retirement savings, leaving many categories of saving at a disadvantage and subject to double taxation through the income tax. The policy approach has also favored high-income households and workers at large companies that offer 401(k)s and other saving options, despite complicated rules aimed at limiting the benefits for high earners. The requirement to lock up savings for years or decades or risk various penalties is also a deterrent for many taxpayers, especially those facing emergency expenses or other short-term liquidity needs or those otherwise more focused on short-term benefits. The complex rules and proliferation of various tax-advantaged accounts targeting narrow categories of saving beyond retirement, such as for health care and education, have also served to benefit more sophisticated planners and high-income taxpayers.
Recent research indicates that USAs have the potential to be more universally appealing and result in higher participation rates across the income scale simply due to the more apparent short-term benefits, i.e., the ability to utilize funds for short-term needs.[48] Perhaps most convincingly, the real-world experiments of USAs in action in Canada and the UK demonstrate the policy’s appeal for low- and middle-income households in particular. These policies work because they are simple—they operate essentially like a typical savings account with a bank or an investment account with a broker, except they are tax-free: contributions are made on an after-tax basis but tax-free thereafter without any restrictions or penalties on withdrawals.
The result in Canada is that just 12 years after the TFSA policy was established, more than half of the adult population owns one of these accounts, including between one-third and one-half of low-income households. The trend indicates that the policy will continue to grow in popularity, shielding from tax most investment income earned by low- and middle-income households, substantially boosting their saving, financial security, and financial freedom. In 2020, low- and middle-income owners of TFSAs in Canada had an average balance of about $15,000. Today, that number is likely substantially higher.
We simulated a fiscally responsible way to introduce a Canada-style USA in the U.S., paid for by removing the tax advantages of HSAs—a reform that would also simplify the tax code, reduce compliance costs, and shift the benefits toward low- and middle-income households. This is not the only way to implement a USA, but it is an option with a proven track record and clear benefits. It would bring more financial security and freedom to low- and middle-income households in America and lead to a simpler tax code.
Further steps could be made in this direction. For example, there are a multitude of other complicated and overly targeted tax-advantaged saving options that could be collapsed, such as 529s and FSAs. The tax revenue raised from repealing these provisions could be used to reduce or eliminate other anti-saving provisions of the tax code (such as the estate tax or the net investment income tax), boost saving incentives for low-income households (such as by allowing the savers credit to apply to USA contributions), or increase the annual cap on USA contributions.
Overall, the evidence points to potentially large benefits of implementing USAs in the U.S. They would boost savings for low-income households, allowing them to better withstand economic shocks, such as pandemics and recessions, and plan for major expenses, such as an expanded family, education, and housing needs. While policymakers in Congress have introduced limited USAs in the past, they have failed to gain traction, perhaps due to budgetary or other concerns.[49] Next year’s expiration of the Tax Cuts and Jobs Act presents lawmakers with an opportunity to consider fundamental tax reforms, such as those laid out here, that would meaningfully improve lives through increased financial security and a simplified tax code.
Stay informed on the tax policies impacting you.
Subscribe to get insights from our trusted experts delivered straight to your inbox.
SubscribeAppendix: Modeling Methodology
We use the Tax Foundation General Equilibrium Tax Model to estimate the impact of tax policies on federal tax revenue relative to current law, measured both on a conventional and dynamic basis, as well as economic and distributional impacts.[50] Conventional revenue estimates hold the size of the economy constant and attempt to estimate potential behavioral effects of tax policy. Dynamic revenue estimates consider both behavioral and macroeconomic effects of tax policy on revenue. The model generates estimates of changes in the economy over the long run (which is largely achieved within about 20 years for most policy changes), as measured by GDP, GNP, wages, employment, capital stock, investment, consumption, saving, and the trade deficit.
We modeled the effects of a Canada-style USA policy in the U.S. based on the observed results in Canada, specifically the latest available statistics published by the Canadian government covering the first 12 years of the TFSA policy (2009-2020), including TFSA contributions, withdrawals, balances, and income by income class.[51] For each policy year, we calculated the effective tax exemptionA tax exemption excludes certain income, revenue, or even taxpayers from tax altogether. For example, nonprofits that fulfill certain requirements are granted tax-exempt status by the Internal Revenue Service (IRS), preventing them from having to pay income tax. of investment income by income class, using this measure to model the policy in the U.S. We mapped the effective tax exemption to IRS Statistics of Income (SOI) classes of income, adjusting for joint filing in the U.S. and inflation. We made no adjustment for exchange rate differences as U.S. and Canadian dollars were roughly on par throughout much of the historical period analyzed. We then input these policy parameters (investment income tax exemption by income class by year) into our model, allowing for the estimation of tax revenue impacts throughout the 10-year budget window as well as distributional effects over the first decade. For the long-run impacts on the economy and tax revenue, we assumed, based on the trend in the Canada data, the effective investment income tax exemption in the long run reaches double the 10th-year value.
We modeled the effects of ending the tax advantages of future contributions to HSAs using the latest SOI statistics for tax year 2021, including employee and employer contributions.[52] We calculated contributions as a share of wages by income class, imputed a return (assuming a low rate of return of 2 percent, consistent with research indicating balances are largely held in cash and withdrawn regularly), and extrapolated out over the budget window and over the long run. We then input these policy parameters into the model, estimating tax revenue and distributional and economic effects.
Stay informed on the tax policies impacting you.
Subscribe to get insights from our trusted experts delivered straight to your inbox.
Subscribe[1] Hamza Abdelrahman and Luiz Edgard Oliveira, “Pandemic Savings are Gone: What’s Next for U.S. Consumers?,” Federal Reserve Bank of San Francisco, May 3, 2024, https://www.frbsf.org/research-and-insights/blog/sf-fed-blog/2024/05/03/pandemic-savings-are-gone-whats-next-for-us-consumers/
[2] Thomas Klitgaard and Matthew Higgins, “Spending Down Pandemic Savings is an ‘Only-in the U.S.’ Phenomenon,” Federal Reserve Bank of New York, Oct. 11, 2023, https://libertystreeteconomics.newyorkfed.org/2023/10/spending-down-pandemic-savings-is-an-only-in-the-u-s-phenomenon/; Federal Reserve Economic Data (FRED), “Personal Saving Rate,” accessed May 20, 2024, https://fred.stlouisfed.org/series/PSAVERT; Auerbach and Kotlikoff demonstrate that the U.S. household saving rate has fallen from about 17 percent in the 1950s and 18 percent in the 1960s to about 3 percent in the 2000s and about 4 percent in the 2010s. They note that the decline in household saving has corresponded with a rise in consumption particularly among the elderly, attributable in part to growth in Social Security, Medicare, and other fiscal policies that transfer resources from the young to the old. See Alan Auerbach and Laurence Kotlikoff, “The US Capital Glut and Other Myths,” VoxEU, Sep. 14, 2023, https://cepr.org/voxeu/columns/us-capital-glut-and-other-myths.
[3] In the bottom quintile of households, the real median value of financial assets has dropped from about $3,350 in 2001 to about $1,400 in 2022 (both in 2022 dollars). In the second quintile from the bottom, the real median value of financial assets has dropped from about $13,730 in 2001 to about $7,410 in 2022 (both in 2022 dollars). See Federal Reserve, “Survey of Consumer Finances, 1989 – 2022,” accessed May 20, 2024, https://www.federalreserve.gov/econres/scf/dataviz/scf/chart/.
[4] U.S. Government Accountability Office, “American Credit Card Debt Hits a New Record – What’s Changed Post-Pandemic?,” Oct. 31, 2023, https://www.gao.gov/blog/american-credit-card-debt-hits-new-record-whats-changed-post-pandemic; Federal Reserve Bank of New York, “Household Debt and Credit Report (Q1 2024),” accessed May 20, 2024, https://www.newyorkfed.org/microeconomics/hhdc; Angel Au-Yeung, “Credit Card Debt Is Up and It’s Taking Longer to Pay Down,” The Wall Street Journal, Jan. 24, 2024, https://www.wsj.com/finance/banking/credit-card-debt-is-upand-its-taking-longer-to-pay-down-237cc4a3; Oyin Adedoyin, “Gen Z Sinks Deeper into Debt,” May 7, 2024, https://www.wsj.com/personal-finance/gen-z-credit-card-debt-inflation-2f2f927e.
[5] Jean-Pierre Aubry and Laura D. Quinby, “What Risks Do Near Retirees and Retirees Face from Inflation, and How Do They React?,” The Center for Retirement Research at Boston College, May 15, 2024, https://crr.bc.edu/what-risks-do-near-retirees-and-retirees-face-from-inflation-and-how-do-they-react/; Anne Tergesen, “Retirees Drain Savings Faster to Cope with Inflation,” The Wall Street Journal, May 15, 2024, https://www.wsj.com/personal-finance/retirement/inflation-retirement-savings-withdrawals-b73caa41.
[6] Federal Reserve, “Economic Well-Being of U.S. Households in 2023,” May 2024, https://www.federalreserve.gov/publications/files/2023-report-economic-well-being-us-households-202405.pdf; Federal Reserve, “Report on the Economic Well-Being of U.S. Households: Survey of Household Economics and Decisionmaking,” accessed May 20, 2024, https://www.federalreserve.gov/consumerscommunities/sheddataviz/emergency-savings.html.
[7] Sarah Foster, “Survey: The average American feels they’d need over $200K a year to be financially comfortable,” Bankrate, Jul. 6, 2023, https://www.bankrate.com/personal-finance/financial-freedom-survey/.
[8] Hamza Abdelrahman and Luiz Edgard Oliveira, “Pandemic Savings are Gone: What’s Next for U.S. Consumers?,” Federal Reserve Bank of San Francisco, May 3, 2024, https://www.frbsf.org/research-and-insights/blog/sf-fed-blog/2024/05/03/pandemic-savings-are-gone-whats-next-for-us-consumers/.
[9] William McBride, Erica York, and Alex Durante, “How to Rein in the National Debt,” Tax Foundation, Sep. 12, 2023, https://taxfoundation.org/research/all/federal/us-debt-deficits-federal-budget-spending-taxes/; Paul Winfree, “The Looming Debt Spiral: Analyzing the Erosion of U.S. Fiscal Space,” Economic Policy Innovation Center, Mar. 5, 2024, https://epicforamerica.org/publications/the-looming-debt-spiral-analyzing-the-erosion-of-u-s-fiscal-space/; John Cochrane, “How Inflation Radically Changes Economic Ideas,” IMF, March 2024, https://www.imf.org/en/Publications/fandd/issues/2024/03/Symposium-How-inflation-radically-changes-economic-ideas-John-Cochrane.
[10] Eric Toder, Surachai Khitatrakun, and Aravind Boddupalli, “Tax Incentives for Retirement Savings,” Tax Policy Center, May 11, 2020, https://www.taxpolicycenter.org/sites/default/files/publication/159231/tax-incentives-for-retirement-savings.pdf.
[11] U.S. Joint Economic Committee, “Saving for Social Capital,” May 26, 2020, https://www.jec.senate.gov/public/index.cfm/republicans/2020/5/saving-for-social-capital; Congressional Research Service, “Tax-Advantaged Savings Accounts: Overview and Policy Considerations,” Mar. 31, 2023, https://crsreports.congress.gov/product/pdf/R/R47492; Alex Durante, “How Recent Reforms to Retirement Saving Will Impact Taxpayers in 2024 and Beyond,” Tax Foundation, Dec. 13, 2023, https://taxfoundation.org/blog/retirement-saving-reforms/.
[12] Robert Bellafiore, “The Case for Universal Savings Accounts,” Tax Foundation, Feb. 26, 2019, https://taxfoundation.org/case-for-universal-savings-accounts/.
[13] Federal Reserve, “Economic Well Being of U.S. Households in 2022,” May 2023, https://www.federalreserve.gov/publications/2023-economic-well-being-of-us-households-in-2022-executive-summary.htm.
[14] Under certain circumstances, the tax advantages can differ, e.g., traditional accounts do effectively tax supernormal returns but Roth accounts do not. For a discussion of other differing advantages, see Laura Saunders, “Congress Ended a Tax Break. How That May Help High Earners,” The Wall Street Journal, Aug. 4, 2023, https://www.wsj.com/articles/congress-ended-a-tax-break-how-that-may-help-higher-earners-56287d07.
[15] Eric M. Engen, William G. Gale, and John Karl Scholz, “The Illusory Effects of Saving Incentives on Saving,” Journal of Economic Perspectives 10:4 (1996), https://pubs.aeaweb.org/doi/pdf/10.1257/jep.10.4.113; James M. Poterba, Steven F. Venti, and David A. Wise, “Do 401(k) contributions crowd out other personal saving?,” Journal of Public Economics 58:1 (September 1995), https://www.sciencedirect.com/science/article/pii/004727279401462W; R. Glenn Hubbard and Jonathan S. Skinner, “Assessing the Effectiveness of Saving Incentives,” Journal of Economic Perspectives 10:4 (1996), https://pubs.aeaweb.org/doi/pdf/10.1257%2Fjep.10.4.73; Alexander M. Gelber, “How Do 401(k)s Affect Saving? Evidence from Changes in 401(k) Eligibility,” American Economic Journal: Economic Policy 3:4 (November 2011), https://www.aeaweb.org/articles?id=10.1257/pol.3.4.103; David Card and Michael Ransom, “Pension Plan Characteristics and Framing Effects in Employee Savings Behavior,” NBER Working Paper 13275, July 2007, https://www.nber.org/system/files/working_papers/w13275/w13275.pdf; Daniel J. Benjamin, “Does 401(k) eligibility increase saving?: Evidence from propensity score subclassification,” Journal of Public Economics 87:5-6 (May 2003), https://www.sciencedirect.com/science/article/abs/pii/S0047272701001670; Adam N. Michel, “The Case against Raiding Private Savings to Prop Up Social Security,” Cato Institute, Feb. 1, 2024, https://www.cato.org/blog/case-against-raiding-private-savings-prop-social-security; Andrew G. Biggs and Alicia H. Munnell, “The Case for Using Subsidies for Retirement Plans to Fix Social Security,” Center for Retirement Research at Boston College, Jan. 16, 2024, https://crr.bc.edu/the-case-for-using-subsidies-for-retirement-plans-to-fix-social-security-2/.
[16] IRS, “Retirement Plans Frequently Asked Questions (FAQs),” Apr. 17, 2024, https://www.irs.gov/retirement-plans/retirement-plans-frequently-asked-questions-faqs.
[17] Alex Durante, “How Recent Reforms to Retirement Saving Will Impact Taxpayers in 2024 and Beyond,” Tax Foundation, Dec. 13, 2023, https://taxfoundation.org/blog/retirement-saving-reforms/; IRS, “Disaster relief frequently asked questions: Retirement plans and IRA under the SECURE 2.0 Act of 2022,” May 2024, https://www.irs.gov/newsroom/disaster-relief-frequent-asked-questions-retirement-plans-and-iras-under-the-secure-20-act-of-2022.
[18] Sheldon R. Smith and Kevin R. Smith, “Recent Updates to Penalty Exceptions for Early Retirement Plan Withdrawals,” Tax Notes, Jan. 29, 2024, https://www.taxnotes.com/tax-notes-federal/benefits-and-pensions/recent-updates-penalty-exceptions-early-retirement-plan-withdrawals/2024/01/29/7j1k6.
[19] Congressional Research Service, “Worker Participation in Employer-Sponsored Pensions: Data in Brief,” Nov. 23, 2021, https://crsreports.congress.gov/product/pdf/R/R43439.
[20] Bureau of Labor Statistics, Employee Benefits Survey, https://www.bls.gov/ebs/notices/2022/employee-benefits.htm.
[21] IRS, Form W-2 Study, Tables 1.B and 2.B, July 2021, https://www.irs.gov/pub/irs-soi/18inallw2.xls.
[22] IRS, Accumulation and Distribution of Individual Retirement Arrangements (IRA), Table 2: Taxpayers with Individual Retirement Arrangement (IRA) Plans, by Size of Adjusted Gross IncomeFor individuals, gross income is the total pre-tax earnings from wages, tips, investments, interest, and other forms of income and is also referred to as “gross pay.” For businesses, gross income is total revenue minus cost of goods sold and is also known as “gross profit” or “gross margin.” , Tax Year 2020, https://www.irs.gov/statistics/soi-tax-stats-accumulation-and-distribution-of-individual-retirement-arrangements.
[23] Congressional Research Service, “Individual Retirement Account (IRA) Ownership: Data and Policy Issues,” Dec. 9, 2020, https://crsreports.congress.gov/product/pdf/R/R46635/3.
[24] Saurabh Bhargava and Lynn Conell-Price, “Serenity Now, Save Later? Evidence on Retirement Savings Puzzles from a 401(k) Field Experiment,” March 2021, https://www.cmu.edu/dietrich/sds/docs/bhargava/bc-serenity-now_-march-2021.pdf.
[25] Alicia H. Munnell, Annika Sunden, and Catherine Taylor, “What Determines 401(k) Participation and Contributions?,” Social Security Bulletin, Vol. 64, No. 3, 2001/2002, https://www.ssa.gov/policy/docs/ssb/v64n3/v64n3p64.html; Congressional Research Service, “Data on Retirement Contributions to Defined Contribution (DC) Plans,” Aug. 12, 2021, https://crsreports.congress.gov/product/pdf/IN/IN11721; Congressional Research Service, “Data on Contributions to Individual Retirement Accounts (IRAs),” Aug. 12, 2021, https://crsreports.congress.gov/product/pdf/IN/IN11722.
[26] U.S. Joint Economic Committee, “Saving for Social Capital,” May 26, 2020, https://www.jec.senate.gov/public/index.cfm/republicans/2020/5/saving-for-social-capital.
[27] Congressional Research Service, “Tax Preferred College Savings Plans: An Introduction to 529 Plans,” Feb. 27, 2024, https://sgp.fas.org/crs/misc/R42807.pdf.
[28] Congressional Research Service, “Health Savings Accounts (HSAs),” Aug. 8, 2022, https://crsreports.congress.gov/product/pdf/R/R45277.
[29] Ibid.
[30] Bureau of Labor Statistics, Employee Benefits Survey, https://www.bls.gov/ebs/notices/2022/employee-benefits.htm.
[31] Congressional Research Service, “Health Savings Accounts (HSAs),” Aug. 8, 2022, https://crsreports.congress.gov/product/pdf/R/R45277.
[32] IRS, “SOI Tax Stats – Individual Income TaxAn individual income tax (or personal income tax) is levied on the wages, salaries, investments, or other forms of income an individual or household earns. The U.S. imposes a progressive income tax where rates increase with income. The Federal Income Tax was established in 1913 with the ratification of the 16th Amendment. Though barely 100 years old, individual income taxes are the largest source of tax revenue in the U.S. Returns Line Item Estimates (Publication 4801),” Tax Year 2021, https://www.irs.gov/statistics/soi-tax-stats-individual-income-tax-returns-line-item-estimates-publication-4801.
[33] Congressional Research Service, “Health Savings Accounts (HSAs),” Aug. 8, 2022, https://crsreports.congress.gov/product/pdf/R/R45277.
[34] Leora Friedberg, Adam Leive, Jaeki Jang, and Eric R. Young, “Health Savings Accounts and life-cycle saving: Implications for retirement preparedness,” TIAA Institute, February 2023, https://www.tiaa.org/content/dam/tiaa/institute/pdf/insights-report/2023-02/tiaa-institute-health-savings-accounts-and-life-cycle-saving-ti-friedberg-leive-february-2023.pdf; Adam Lieve, “Health Insurance Design Meets Saving Incentives: Consumer Responses to Complex Contracts,” American Economic Journal: Applied Economics 14:2 (April 2022), https://www.aeaweb.org/articles?id=10.1257/app.20200135.
[35] Jake Spiegel and Paul Fronstin, “Trends in Health Savings Account Balances, Contributions, Distributions, and Investments, 2011-2021,” EBRI, Feb. 23, 2023, https://www.ebri.org/content/trends-in-health-savings-account-balances-contributions-distributions-and-investments-2011-2021.
[36] Government of Canada, “Tax-Free Savings Account (TFSA), Guide for Individuals,” accessed May 20, 2024, https://www.canada.ca/en/revenue-agency/services/forms-publications/publications/rc4466/tax-free-savings-account-tfsa-guide-individuals.html
[37] Robert Bellafiore, “The Case for Universal Savings Accounts,” Tax Foundation, Feb. 26, 2019, https://taxfoundation.org/case-for-universal-savings-accounts/.
[38] Statistics Canada, “Recent trends in families’ contributions to three registered savings accounts,” Oct. 17, 2023, https://www150.statcan.gc.ca/n1/pub/75f0002m/75f0002m2023008-eng.htm.
[39] RBC, “Cash flow shock: Young Canadian adults struggling to reclaim their financial future as inflation takes its toll on their daily lives – RBC poll,” Feb. 23, 2023, https://www.rbc.com/newsroom/news/article.html?article=125775.
[40] Statistics Canada, “Household contribution rates for selected registered savings accounts,” Sep. 13, 2017, https://www12.statcan.gc.ca/census-recensement/2016/as-sa/98-200-x/2016013/98-200-x2016013-eng.cfm.
[41] Government of Canada, “T1 Final Statistics,” accessed May 20, 2024, https://www.canada.ca/en/revenue-agency/programs/about-canada-revenue-agency-cra/income-statistics-gst-hst-statistics/t1-final-statistics.html.
[42] HM Treasury, “Junior ISAs launch today to help parents save for their children’s future,” Nov. 1, 2011, https://www.gov.uk/government/news/junior-isas-launch-today-to-help-parents-save-for-their-childrens-future; GOV.UK, “Lifetime ISA,” accessed May 20, 2024, https://www.gov.uk/lifetime-isa.
[43] BlackRock, “The Story of the ISA: How Tax-Free Saving Has Evolved in the UK,” accessed May 20, 2024, https://www.blackrock.com/uk/solutions/investment-trusts/our-range/insights/how-tax-free-savings-has-evolved-in-the-uk.
[44] Ryan Bourne and Chris Edwards, “Tax Reform and Savings: Lessons from Canada and the United Kingdom,” May 1, 2017, https://www.cato.org/tax-budget-bulletin/tax-reform-savings-lessons-canada-united-kingdom.
[45] Our modeling approach for this USA policy is based on the results observed in Canada with TFSAs. See appendix for a detailed description.
[46] HSAs and 529s often levy higher administrative and investment fees. Balances may be invested but the associated fees are typically higher than those found in taxable investment accounts, likely reflecting the limited uptake of HSAs and 529s and the lack of competition in those markets as well as the administrative complexity of maintaining those accounts and complying with the various rules.
[47] See appendix for description of modeling methodology.
[48] Saurabh Bhargava and Lynn Conell-Price, “Serenity Now, Save Later? Evidence on Retirement Savings Puzzles from a 401(k) Field Experiment,” March 2021, https://www.cmu.edu/dietrich/sds/docs/bhargava/bc-serenity-now_-march-2021.pdf.
[49] Tyler Parks, “Republican Study Committee’s Tax Plan Simplifies the Tax Code and Offers Pro-Growth Ideas,” Tax Foundation, Jun. 14, 2023, https://taxfoundation.org/blog/rsc-budget-republican-tax-plan/.
[50] Stephen J. Entin, Huaqun Li, and Kyle Pomerleau, “Overview of the Tax Foundation’s General Equilibrium Model,” Tax Foundation, April 2018, https://files.taxfoundation.org/20180419195810/TaxFoundaton_General-Equilibrium-Model-Overview1.pdf.
[51] Government of Canada, “Tax-Free Savings Accounts statistics,” accessed May 20, 2024, https://www.canada.ca/en/revenue-agency/programs/about-canada-revenue-agency-cra/income-statistics-gst-hst-statistics/tax-free-savings-account-statistics.html; Government of Canada, “T1 Final Statistics,” accessed May 20, 2024, https://www.canada.ca/en/revenue-agency/programs/about-canada-revenue-agency-cra/income-statistics-gst-hst-statistics/t1-final-statistics.html.
[52] IRS, “SOI Tax Stats – Individual Statistical Tables by Size of Adjusted Gross Income,” Table 1.4: Sources of Income, Adjustments, and Tax Items, by Size of Adjusted Fross Income, Tax Year 2021, https://www.irs.gov/statistics/soi-tax-stats-individual-statistical-tables-by-size-of-adjusted-gross-income; IRS, “SOI Tax Stats – Individual Income Tax Returns Line Item Estimates (Publication 4801),” Tax Year 2021, https://www.irs.gov/statistics/soi-tax-stats-individual-income-tax-returns-line-item-estimates-publication-4801.
Share this article