Key Findings
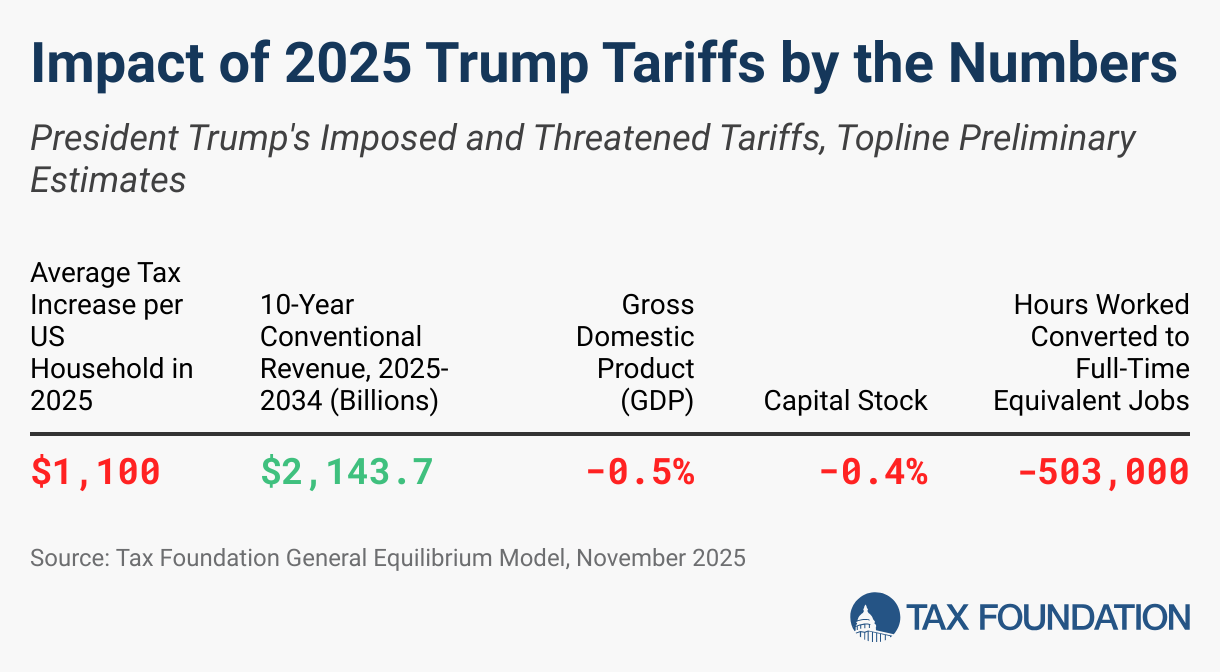
- In 2025, the Trump tariffs amounted to an average taxA tax is a mandatory payment or charge collected by local, state, and national governments from individuals or businesses to cover the costs of general government services, goods, and activities. increase of $1,000 per US household. We estimate that the tariffs both announced and imposed, including the Section 122 tariffTariffs are taxes imposed by one country on goods imported from another country. Tariffs are trade barriers that raise prices, reduce available quantities of goods and services for US businesses and consumers, and create an economic burden on foreign exporters., Section 232 tariffs, Section 301 tariffs, and Section 338 tariff on Canada, will increase taxes per US household by $900 in 2026.
- President Trump imposed tariffs on nearly all trading partners under the International Emergency Economic Powers Act (IEEPA) and on several sectors using Section 232. On February 20,2026, the Supreme Court ruled 6-3 that IEEPA does not authorize tariffs, leaving only the new Section 232 tariffs in place. Trump responded by imposing a 10 percent tariff on nearly all countries under Section 122, effective February 24, 2026, applying to an estimated $1.0 trillion (29 percent) of annual imports. The Section 122 tariff expired after 150 days on July 24. The new Section 301 tariffs apply to an estimated $949 billion (28 percent) of annual imports.
- The IEEPA ruling reduced the weighted average applied tariff rate on all imports from 14.9 percent to 8.2 percent in 2026 under the remaining Section 232 tariffs. The revised Section 232 tariffs on steel, aluminum, and copper and the Section 122 tariff increased this rate to 10.8 percent. After the Section 122 tariff expires, accounting for the additional tariffs that will come into effect (Section 232 tariffs on pharmaceuticals, Section 301 tariffs, and the Section 338 tariff on Canada), the weighted average applied tariff rate rises to 11.8 percent.
- The average effective tariff rate was in 2025—the highest since 1947. We estimate the average effective tariff rate will be 6.6 percent for calendar year 2026, the highest since 1969.
- We estimate that the tariffs will raise $1.6 trillion in revenue from 2026-2035 on a conventional basis. The Section 232 tariffs, Section 301 tariffs, and Section 338 tariff on Canada will reduce long-run US GDP by 0.4 percent.
- Accounting for negative economic effects, the revenue raised by the tariffs falls to $1.2 trillion over the decade.
- The tariffs have not meaningfully altered the trade balance, which fell by only $2.1 billion in 2025, driven by an increase in the trade surplus of services.
Average Tariff Rates
The new tariffs will significantly raise the tariff rates the US applies to most imports. The weighted average tariff rate measures the statutory tax rate that applies to US imports. It differs from the average effective tariff rate that measures actual customs duties collections as a share of actual goods imports.
According to the World Bank, the weighted average applied tariff was 1.5 percent in 2022. Prior to the Supreme Court’s Learning Resources decision, we estimate US imports faced a weighted-average applied tariff rate of 15.2 percent. While the 10 percent Section 122 tariffs are in effect, we estimate the applied rate is 10.8 percent, and that it will rise to 11.8 percent after the Section 122 tariff expires and the announced Section 232 tariff on pharmaceuticals, Section 301 tariffs, and Section 338 tariff on Canada go into effect.
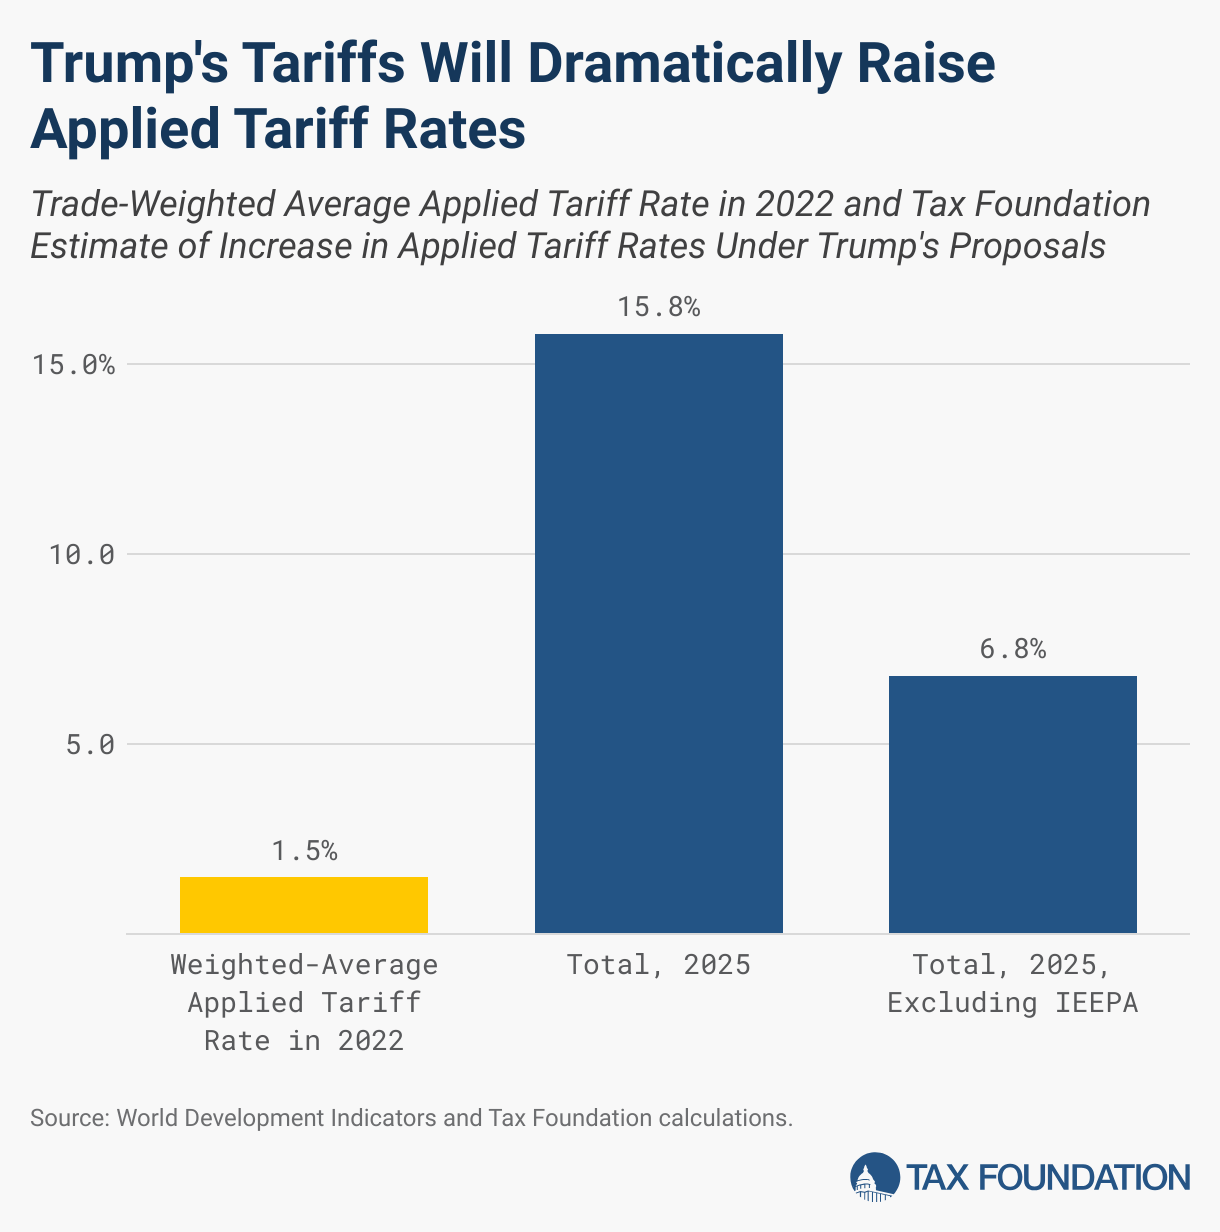
Since the beginning of President Trump’s second term, US tariff policy has changed more than 50 times. The applied tariff rate peaked in April 2025, shortly after the “Liberation Day” tariffs, and has fluctuated significantly since then.
We estimate the average effective tariff rate by taking tariff revenues as a share of total goods imports. Based on actual customs duties collections and import levels in 2025, the actual average effective , up from 2.4 percent in 2024, reaching its highest level since 1947. We estimate the average effective tariff rate for 2026 will be 6.6 percent—the highest since 1969.
Tariff Revenue Collections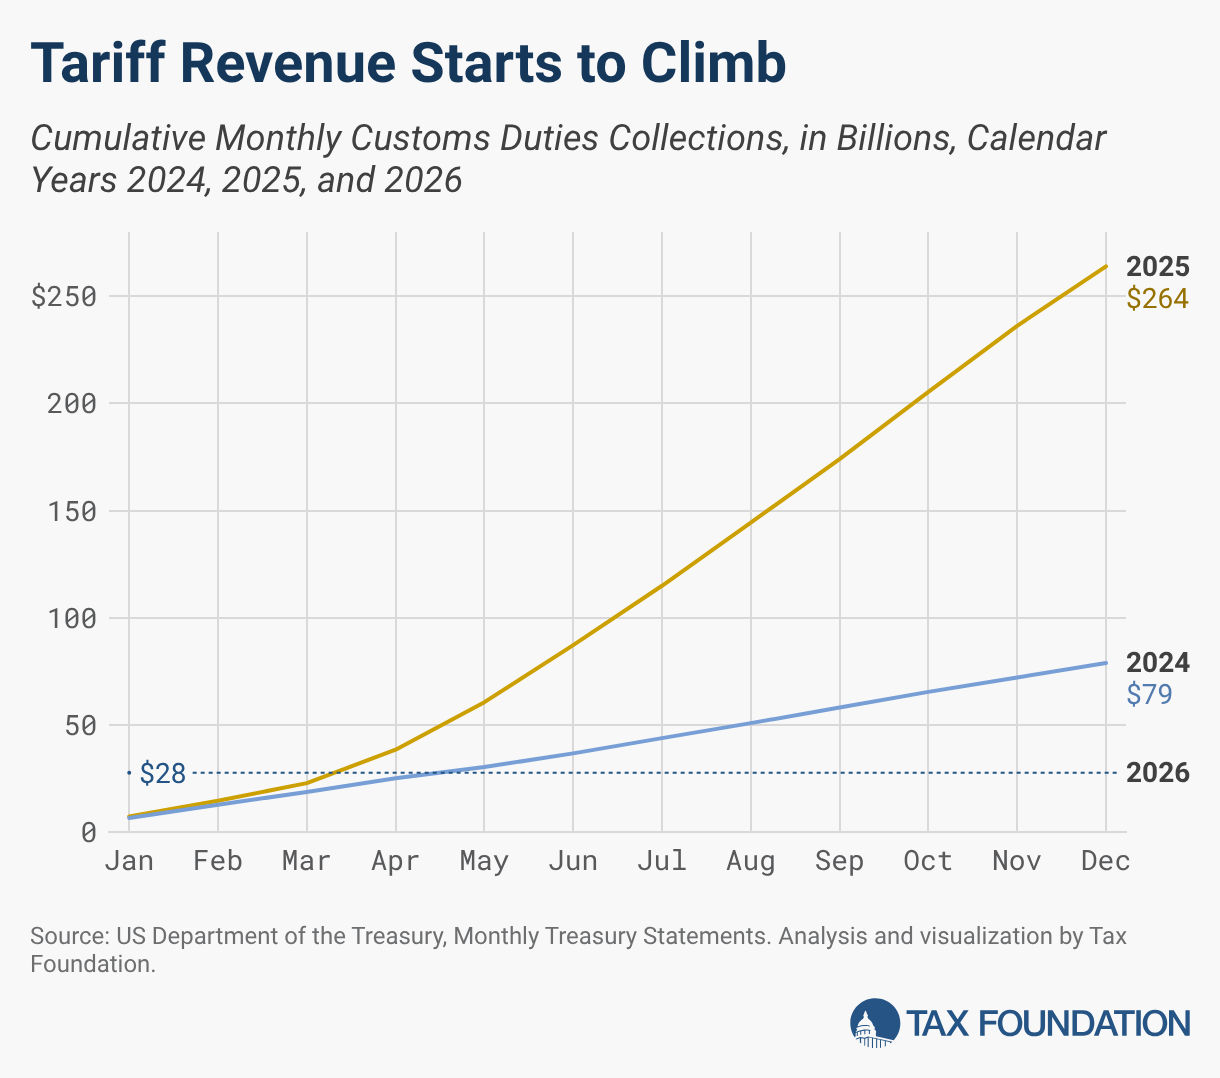
In calendar year 2025, customs duties raised $264 billion for the federal government, compared to $79 billion in calendar year 2024. Total customs duties revenues include pre-existing tariffs, such as those President Trump imposed in his first term. With the IEEPA tariffs being ruled illegal, the approximately $166 billion of revenue collected by the government related to those tariffs will have to be refunded. The total revenue raised by tariffs will be less than the direct collections, because tariffs mechanically reduce the bases of income and payroll taxes. We estimate the government netted $38 billion from the new Section 232 tariffs in 2025.
The Balance of Trade
One of President Trump’s stated goals of imposing tariffs is to shrink the US trade deficit. However, a country’s balance of trade is not solely driven by trade policy, but instead, reflects broader macroeconomic balances between saving and investment and net lending and borrowing with the rest of the world.
In the United States, domestic investment outpaces domestic saving, requiring a capital inflow from the rest of the world to close the gap. The capital inflow represents net lending to the United States from the rest of the world to finance business investment as well as the government’s budget deficit. Because tariffs do not directly change the balance between domestic saving and investment, tariffs cannot permanently change the trade balance.
The last time the United States ran a trade surplus was in 1975; every year since, the United States has run a trade deficit. That the United States has consistently run trade deficits for decades is not an imminent economic problem. Net imports, another term for a trade deficit, can reflect the strength of the US economy in attracting foreign investment and in serving as a safe, reliable haven for foreign capital. When net imports finance the capital stock, it allows the US to enjoy a higher level of productivity and growth than otherwise would occur.
In 2025, the trade deficit fell by just $2.1 billion compared to 2024. The reduction in the trade deficit was due to an increase in the trade surplus of services, as the goods deficit actually increased by $25.5 billion year over year.
Economic Effects
Our estimates below separate the effects of the IEEPA tariffs (ruled unlawful) from other tariffs. See the Appendix for a detailed explanation of the modeled provisions.
Because the Section 122 tariff expires after 150 days, it has no long-run economic impact in our model. We estimate that before accounting for any foreign retaliation, the Section 232 tariffs, Section 301 tariffs, and Section 338 tariff on Canada will reduce long-run US GDP by 0.4 percent.
As of September 1, 2025, threatened and imposed retaliatory tariffs affect $223 billion of US exports based on 2024 US import values; if fully imposed, we estimate they will reduce long-run US GDP by 0.2 percent.
Table 1. Estimated Economic Impact of 2025-2026 Trump Tariffs
Note: Totals may not sum due to rounding.
Long-Run GDP Capital Stock Pre-Tax Wages Hours Worked Converted to Full-Time Equivalent Jobs
Section 232 Tariffs -0.2% -0.2% 0.0% -228,000
Section 232 Steel, Aluminum, Copper -0.1% -0.1% 0.0% -100,000
Section 232 Autos and Auto Parts -0.1% -0.1% 0.0% -85,000
Section 232 Heavy Trucks and Parts Less than -0.05% Less than -0.05% 0.0% -17,000
Section 232 Furniture, Kitchen Cabinets and Vanities, Lumber Less than -0.05% Less than -0.05% 0.0% -3,000
Section 232 Pharmaceuticals Less than -0.05% Less than -0.05% 0.0% -23,000
Section 301 Tariffs -0.1% -0.1% 0.0% -133,000
Section 338 Tariff on Canada (50%) Less than -0.05% Less than -0.05% 0.0% -6,000
Total -0.4% 0.0% 0.00% -367,000
Imposed Retaliation -0.2% -0.1% 0.0% -141,000
Source: Tax Foundation General Equilibrium Model, July 2026
Revenue Impacts
Tariffs generate tax revenue for the federal government. We model the imposed tariffs together, accounting for interactions between the different rounds of tariffs and timing of implementation. Additionally, we account for income and payroll taxA payroll tax is a tax paid on the wages and salaries of employees to finance social insurance programs like Social Security, Medicare, and unemployment insurance. Payroll taxes are social insurance taxes that comprise 24.8 percent of combined federal, state, and local government revenue, the second largest source of that combined tax revenue. offsets, as tariffs mechanically reduce those tax bases. For this reason, the total tax revenue raised on net will be less than the tariff revenue reported by Treasury.
The revenue generated by tariffs is lower on a dynamic basis, reflecting the negative effect tariffs have on US economic output, reducing incomes and resulting tax revenues. Revenue would fall more when factoring in foreign retaliation, as retaliation would cause US output and incomes to shrink further.
On a conventional basis, before incorporating negative economic effects, we estimate that the Section 232 tariffs will increase US federal tax revenue by $942 billion from 2026 through 2035. The temporary 10 percent Section 122 tariffs will raise $22 billion in 2026, . The Section 301 tariffs and the Section 338 tariff on Canada will raise an additional $648 billion from 2026 through 2035.
On a dynamic basis, incorporating the negative effects of the US-imposed tariffs on the US economy, we estimate that all of the tariffs will raise $1.2 trillion from 2026 through 2035, about $426 billion less than the conventional estimate. Incorporating the negative effects of imposed retaliatory tariffs as of September 1, 2025, further reduces 10-year revenue by $136 billion.
Table 2. Conventional Revenue Effects of 2025-2026 Trump Tariffs
Calendar Year 2026 2027 2028 2029 2030 2031 2032 2033 2034 2035 2026-2035
Section 232 Tariffs $75.2 $82.1 $86.1 $88.9 $92.1 $95.8 $99.6 $103.7 $107.5 $111.3 $942.3
Section 232 Steel, Aluminum, Copper $31.5 $32.4 $34.9 $36.0 $37.3 $38.8 $40.4 $42.0 $43.6 $45.1 $382.0
Section 232 Autos and Auto Parts $32.5 $33.7 $34.8 $35.9 $37.2 $38.7 $40.2 $41.9 $43.4 $44.9 $383.2
Section 232 Heavy Trucks and Parts $6.9 $7.2 $7.4 $7.6 $7.9 $8.2 $8.5 $8.9 $9.2 $9.5 $81.3
Section 232 Furniture, Kitchen Cabinets and Vanities, Lumber $1.4 $1.6 $1.6 $1.7 $1.7 $1.8 $1.9 $2.0 $2.0 $2.1 $17.8
Section 232 Pharmaceuticals $2.9 $7.2 $7.4 $7.7 $7.9 $8.3 $8.6 $9.0 $9.3 $9.6 $77.9
Section 122 Tariff (10%) $21.6 $0.0 $0.0 $0.0 $0.0 $0.0 $0.0 $0.0 $0.0 $0.0 $21.6
Section 301 Tariffs $24.0 $58.2 $60.1 $62.0 $64.2 $66.8 $69.5 $72.3 $75.0 $77.6 $629.7
Section 338 Tariff on Canada (50%) $0.6 $1.7 $1.8 $1.8 $1.9 $2.0 $2.1 $2.1 $2.2 $2.3 $18.5
Total $121.4 $142.0 $148.0 $152.7 $158.2 $164.6 $171.1 $178.2 $184.7 $191.2 $1,612.1
Table 3. Dynamic Revenue Effects of 2025-2026 Trump Tariffs
| Calendar Year | 2026 | 2027 | 2028 | 2029 | 2030 | 2031 | 2032 | 2033 | 2034 | 2035 | 2026-2035 |
|---|---|---|---|---|---|---|---|---|---|---|---|
| Section 232 Tariffs | $53.0 | $59.2 | $61.5 | $64.6 | $66.3 | $68.1 | $72.2 | $75.4 | $77.5 | $80.6 | $678.4 |
| Section 232 Steel, Aluminum, Copper | $21.8 | $22.4 | $24.1 | $25.2 | $25.8 | $26.7 | $28.3 | $29.6 | $30.2 | $31.6 | $265.7 |
| Section 232 Autos and Auto Parts | $24.0 | $25.0 | $25.5 | $26.8 | $27.4 | $28.3 | $29.8 | $31.3 | $32.0 | $33.4 | $283.5 |
| Section 232 Heavy Trucks and Parts | $5.1 | $5.3 | $5.4 | $5.7 | $6.0 | $5.9 | $6.3 | $6.6 | $6.9 | $7.1 | $60.3 |
| Section 232 Furniture, Kithcen Cabinets and Vanities, Lumber | $1.4 | $1.6 | $1.6 | $1.7 | $1.7 | $1.8 | $1.9 | $2.0 | $2.0 | $2.1 | $17.8 |
| Section 232 Pharmaceuticals | $0.7 | $4.9 | $4.9 | $5.3 | $5.5 | $5.4 | $5.9 | $5.9 | $6.3 | $6.4 | $51.2 |
| Section 122 Tariff (10%) | $21.6 | $0.0 | $0.0 | $0.0 | $0.0 | $0.0 | $0.0 | $0.0 | $0.0 | $0.0 | $21.6 |
| Section 301 Tariffs | $10.9 | $44.6 | $45.7 | $47.5 | $49.0 | $50.9 | $53.4 | $55.7 | $57.1 | $59.6 | $474.4 |
| Section 338 Tariff on Canada (50%) | $0.0 | $1.1 | $1.1 | $1.1 | $1.2 | $1.2 | $1.3 | $1.3 | $1.5 | $1.4 | $11.2 |
| Total | $85.6 | $105.0 | $108.3 | $113.3 | $116.5 | $120.2 | $126.9 | $132.4 | $136.1 | $141.6 | $1,185.9 |
| Retaliation | -$9.6 | -$10.8 | -$11.6 | -$12.5 | -$13.2 | -$14.0 | -$14.9 | -$15.6 | -$16.4 | -$17.4 | -$136.0 |
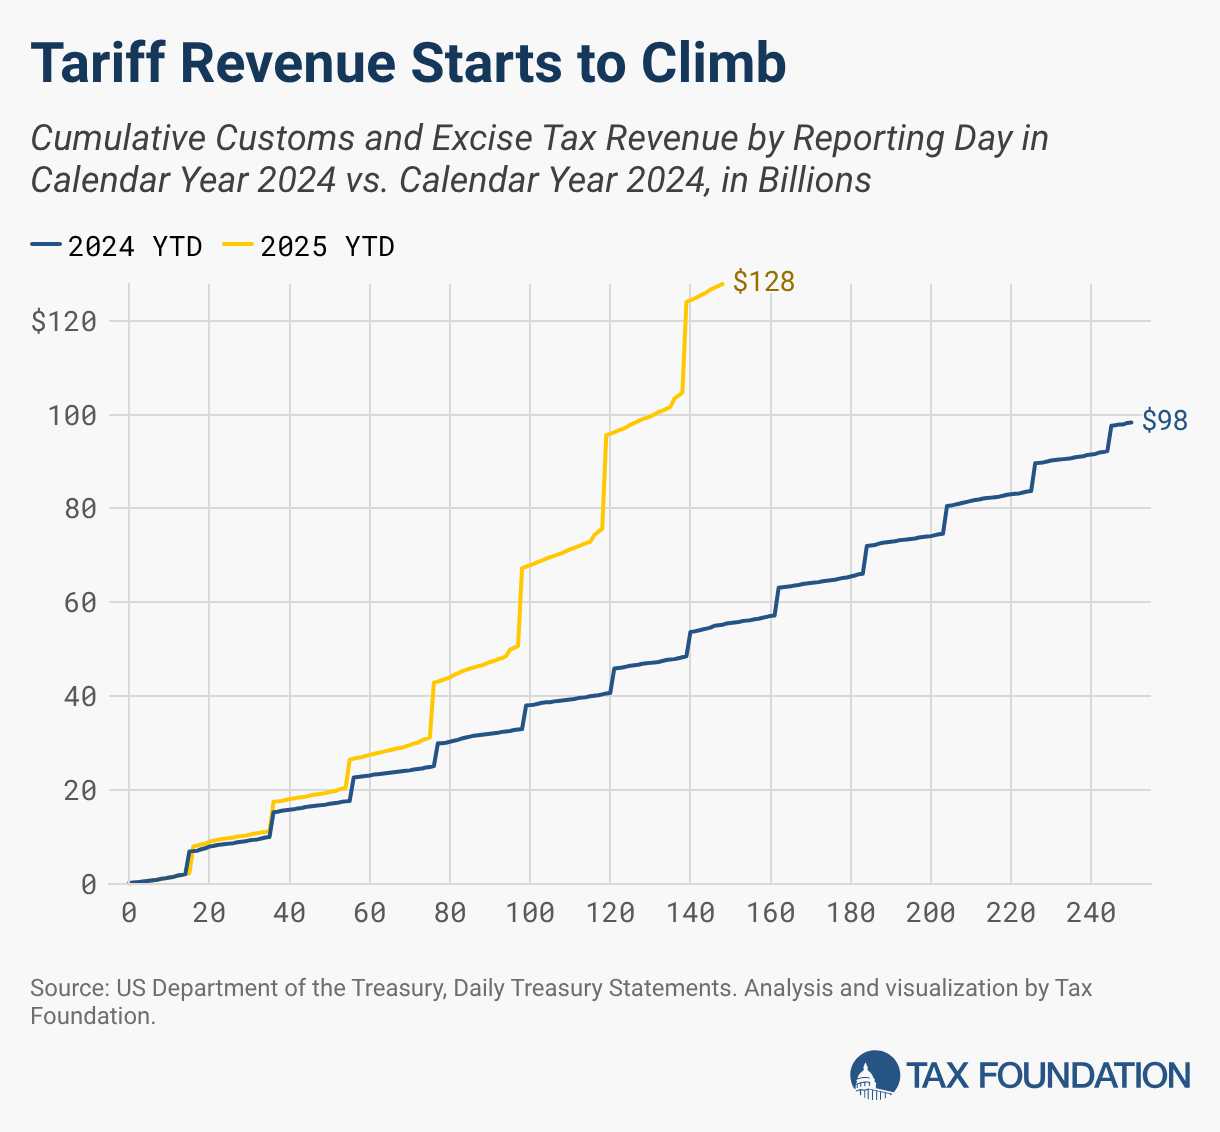
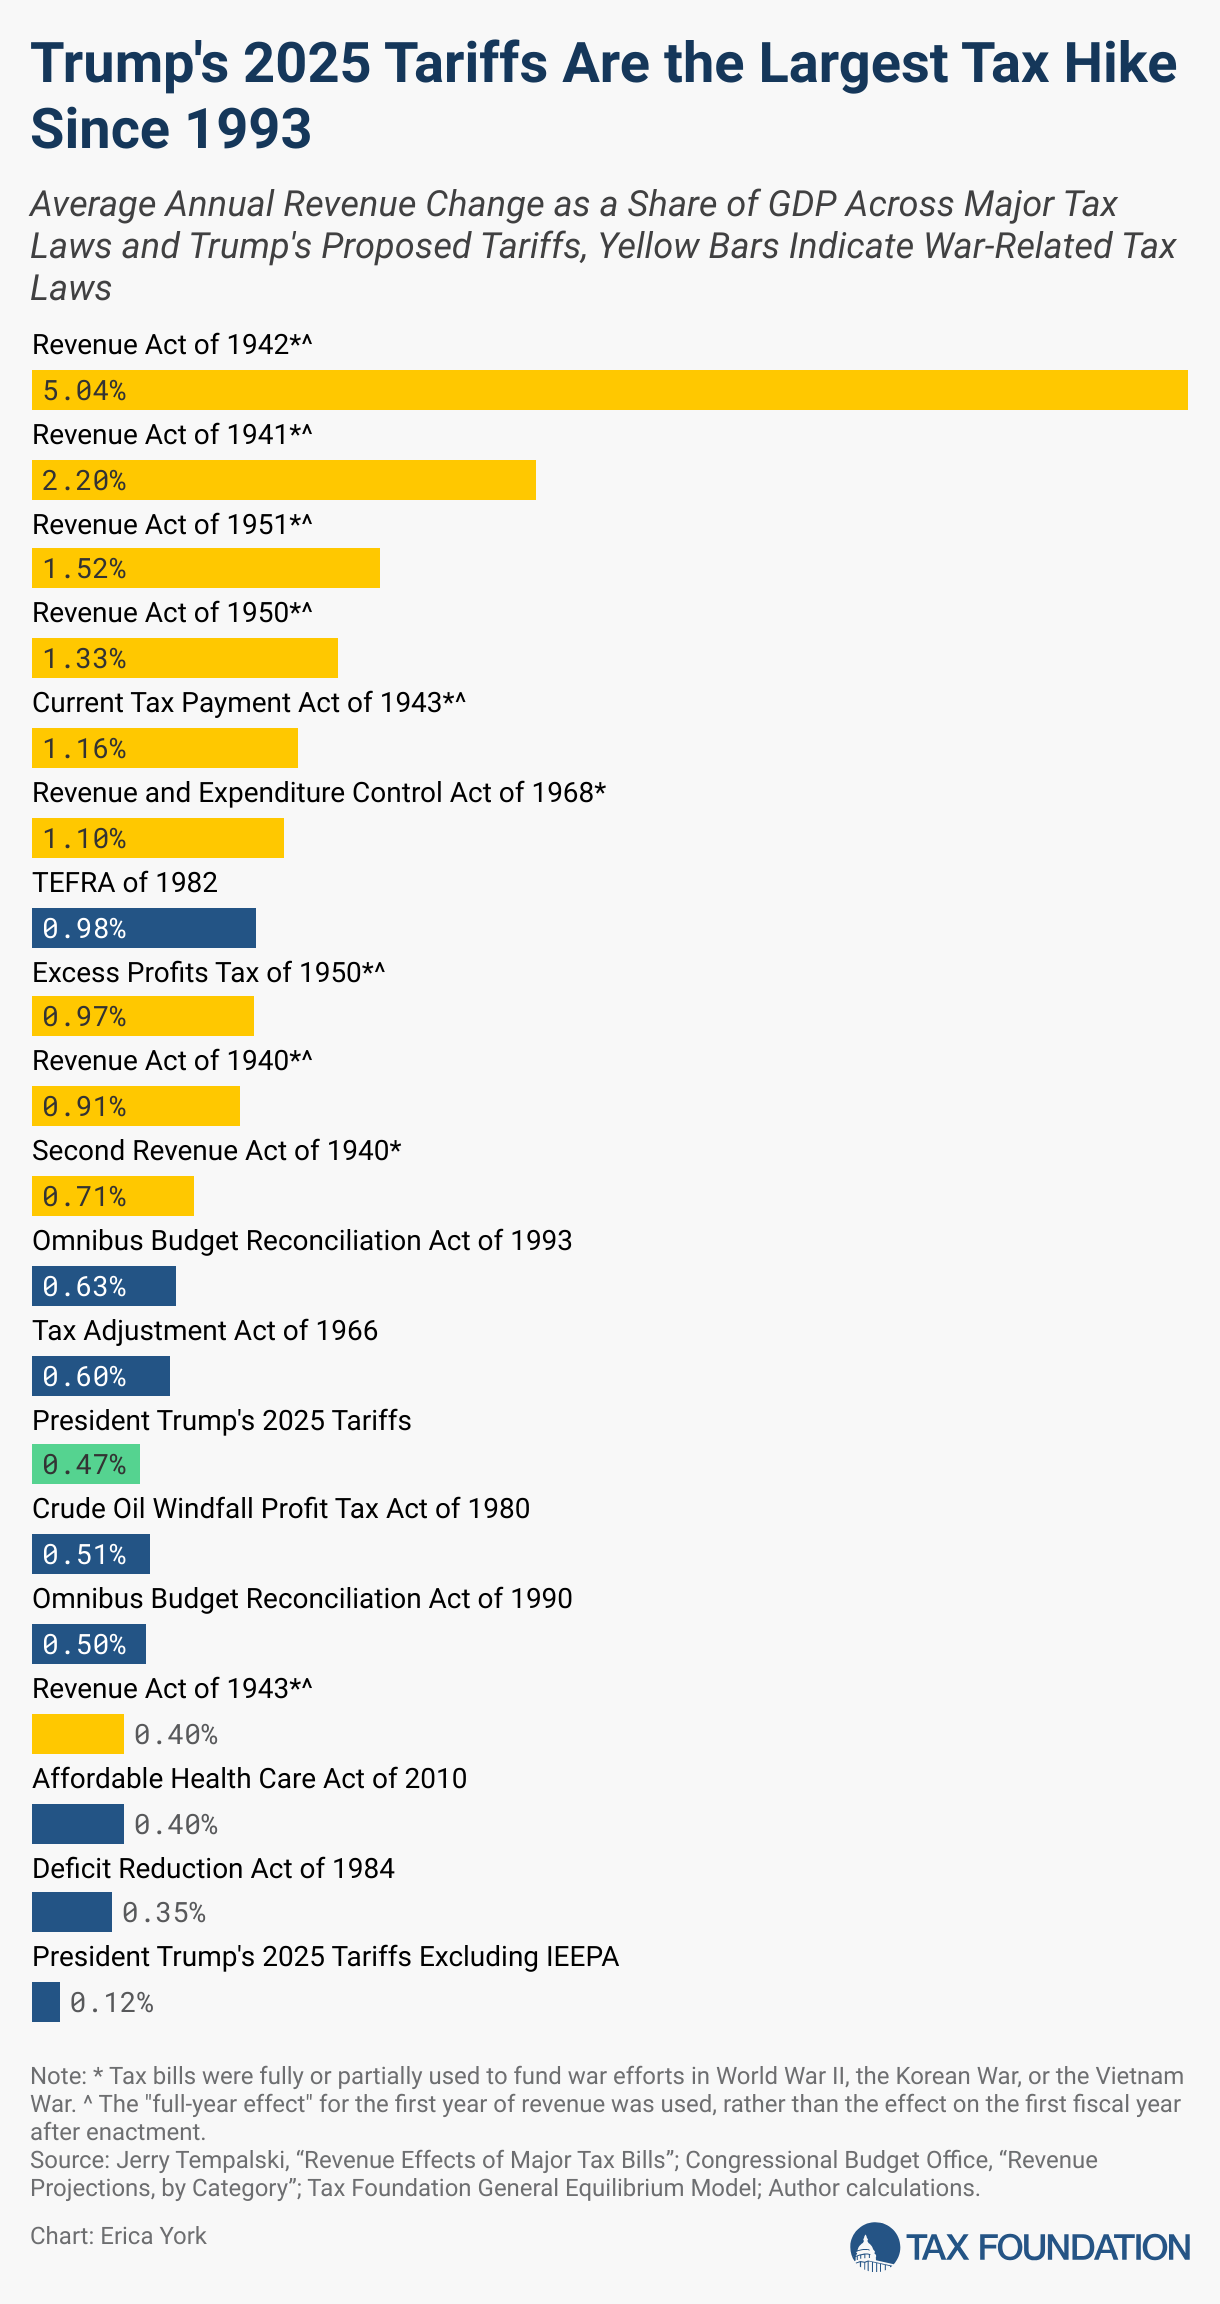
We estimate that the newly imposed and scheduled tariffs will increase federal tax revenues by $121 billion in 2026, or 0.4 percent of GDP, ranking as the 19th largest tax increase since 1940.
Distributional Impacts
In 2026, the tariffs will reduce after-tax incomes for all income groups. The top 1 percent will see a smaller reduction in after-tax incomeAfter-tax income is the net amount of income available to invest, save, or consume after federal, state, and withholding taxes have been applied—your disposable income. Companies and, to a lesser extent, individuals, make economic decisions in light of how they can best maximize their earnings. compared to others.
In 2025, per US household, the IEEPA and Section 232 tariffs altogether amounted to an average tax increase of $1,000. However, with the IEEPA tariffs struck down and not yet fully replaced, the tax increases in 2026 will be smaller. We estimate the Section 232 tariffs will create an average tax burden of $600, and the other tariffs, including the expired Section 122 tariffs, increase it to $900 for 2026.
These averages do not capture additional costs from higher-priced alternatives and reduced consumer choice.
Table 4. Distributional Effects of 2025-2026 Trump Tariffs
Percent Change in After-Tax Income under Imposed Tariffs, 2026 Nominal Tax Change, 2026
Market Income Percentile All Tariffs All Tariffs
0% - 20.0% -0.8% $81
20.0% - 40.0% -0.8% $222
40.0% - 60.0% -0.8% $433
60.0% - 80.0% -0.8% $765
80.0% - 100% -0.7% $2,089
80.0% - 90.0% -0.8% $1,218
90.0% - 95.0% -0.8% $1,705
95.0% - 99.0% -0.8% $2,837
99.0% - 99.9% -0.7% $6,795
99.9% - 100% -0.5% $36,044
Source: Tax Foundation General Equilibrium Model, July 2026
2025 Trade War Timeline & Current US Tariff Policy
President Trump signed an executive order on January 20, 2025, instructing certain cabinet secretaries to develop reports on trade practices and recommendations for tariffs due by April 1, 2025. Since then, several new tariffs and tariff investigations have been threatened, initiated, and imposed. The new tariffs imposed under IEEPA in 2025 were ruled unlawful by the Supreme Court in early 2026 and are now being replaced with a combination of Section 122, Section 301, and Section 232 investigations and tariffs.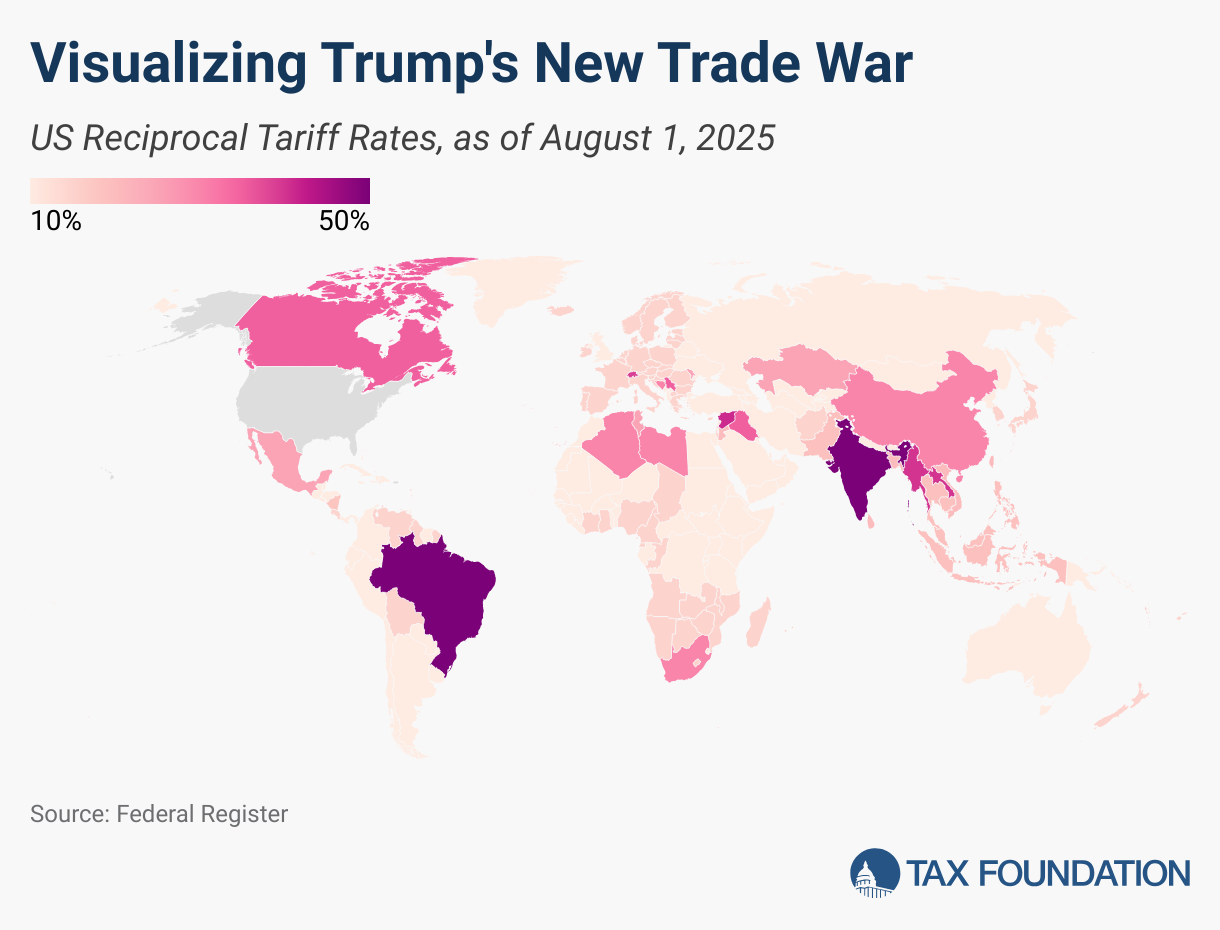
Section 301 Tariff
- On March 11, 2026, USTR initiated several new Section 301 investigations related to “structural excess capacity and production in manufacturing sectors” affecting China, the European Union, Singapore, Switzerland, Norway, Indonesia, Malaysia, Cambodia, Thailand, Korea, Vietnam, Taiwan, Bangladesh, Mexico, Japan, and India. The investigations could pave the way to re-impose the now unlawful IEEPA tariffs.
- On July 15, 2026, the president announced that he would impose a 25 percent tariff on certain imports from Brazil, about $24 billion worth in 2026, effective July 22.
- On July 24, the president imposed Section 301 tariffs on more than 60 countries, with rates of either 10 percent or 12.5 percent, and numerous exemptions. Section 301 tariffs, including the previously announced Brazil 301 tariff, apply to $949 billion worth of imports in 2026.
Section 338 Tariffs
- On July 20, 2026, the president announced that he would be imposing additional tariffs of 50 percent on Canada under Section 338, effective August 19. The tariffs apply to various Canadian agriculture and dairy products, furniture, alcoholic beverages, and other goods, about $16 billion worth in 2026.
Section 122 Tariffs
- On February 20, 2026, President Trump signed an executive order that would impose a 10 percent tariff on all countries, with various exemptions, under Section 122 in response to “large and serious United States balance-of-payments deficits.” We estimate that the tariffs would apply to about $1.2 trillion worth of imports, accounting for all exemptions including those covered under Section 232 and the USMCA. The tariff will expire after 150 days on July 24.
- On February 21, 2026, the president announced his intent to increase the tariff rate to 15 percent, but it currently remains imposed at 10 percent.
Section 232 Product-Specific Tariffs
- Semiconductors: President Trump said on January 27, 2025, he would announce new tariffs on computer chips, semiconductors, and pharmaceuticals. On February 18 he announced the rates on semiconductors and pharmaceuticals would be “25 percent and higher.” The Department of Commerce initiated a Section 232 investigation on April 1, 2025. On January 14, 2026, the president issued a proclamation detailing a new 25 percent tariff on a narrow category of specific chips that are then re-exported beginning January 15, 2026. The proclamation noted that when negotiations with trading partners conclude, broader tariffs at significant rates could be imposed.
- Pharmaceuticals: On July 8, 2025, the president threatened a 200 percent tariff on pharmaceuticals. On August 6, 2025, he indicated the semiconductor tariffs would be 100 percent and the pharmaceutical tariffs would go as high as 250 percent. The president announced on September 26, 2025, that he would be imposing a 100 percent tariff on pharmaceuticals on October 1, 2025, although no proclamation has been issued yet. Tariffs would be capped at 15 percent for the EU and Japan. Generics would be exempt. On April 2, 2026, President Trump signed an executive order imposing 100 percent tariffs on patented pharmaceutical products and ingredients that will take effect July 31. Pharmaceutical products imported from the EU, Japan, South Korea, Switzerland, and Lichenstein would face a lower 15 percent tariff, while those products imported from the UK would face a 10 percent tariff. Companies that entered both onshoring agreements and pricing agreements to list products on “TrumpRX,” they will not face any tariff through January 20, 2029. Companies that entered onshoring agreements only will face a 20 percent tariff on their imports through April 2, 2030, then the 100 percent tariff would apply (unless a lower country-specific rate applies). All generics— as well as certain products, such as orphan drugs and veterinary drugs—would be exempt from the tariffs.
- Steel and Aluminum: President Trump signed two proclamations on February 10, 2025, to expand the existing Section 232 tariffs on steel and aluminum. The orders end all existing exemptions for the tariffs, expand the list of derivative articles, and raise the tariff rate on aluminum from 10 percent to 25 percent. The changes took effect March 12, 2025. On May 30, 2025, President Trump announced the steel and aluminum tariffs would double to 50 percent beginning on June 4, 2025 for all countries except the UK. On June 13, 2025, the Trump administration announced an expansion to apply the tariffs to the steel content of eight more product lines effective June 23, 2025, including dishwashers, refrigerators, washing machines, dryers, freezers, stoves, ovens, and food waste disposals. On August 19, 2025, President Trump added new steel and aluminum derivatives to the annex that would face the 50 percent tariffs. On April 2, 2026, President Trump signed an executive that would modify tariffs on steel, aluminum, and copper. Derivative articles “substantially” made of steel, aluminum, or copper face 25 percent tariffs on their full value. Certain metal-intensive industrial equipment and electrical grid equipment face a lower rate of 15 percent through 2027. Products made entirely with American steel, aluminum, and copper face 10 percent tariffs. Derivatives products comprised of 15 percent or less steel, aluminum, or copper no longer face Section 232 tariffs. The UK continues to receive preferential rates. As part of the US-Taiwan deal announced in May, these tariffs will be capped at 15 percent for Taiwan. On June 1, the president issued another proclamation that would temporarily lower the tariffs on some agricultural and industrial equipment to 15 percent until 2028, at which would point they would increase to 25 percent. On July 20, the president announced that aluminum refineries that enter into onshoring agreements with the federal government would be able to import primary aluminum at half the current tariff rate.
- Autos: President Trump announced on February 14, 2025, that he plans to impose tariffs on auto imports beginning on April 2, 2025. He said on February 18 the rate on autos would be “in the neighborhood of 25 percent” while the rates on semiconductors and pharmaceuticals would be “25 percent and higher.” On March 26, 2025, Trump signed a proclamation authorizing 25 percent tariffs on autos and certain auto parts under Section 232 to take effect April 3, 2025, for autos and before May 3, 2025 for auto parts. US-based content of certain imports from Canada and Mexico will be exempt. As part of US-UK deal, auto imports up to 100,000 would face a 10 percent tariff, while any imports beyond that quota would be subject to a 25 percent tariff. As part of the US-Japan deal, the rate on auto imports from Japan fell to 15 percent effective September 16, 2025. As part of a US-Taiwan deal announced in May 2026, auto tariffs for Taiwan would be capped at 15 percent.
- Heavy Trucks and Buses: On April 22, 2025, President Trump issued a Section 232 investigation into medium and heavy-duty trucks and parts, including buses. The report is due January 16, 2026. On September 30, 2025, the president announced that he would be imposing 25 percent tariffs on these trucks and a 10 percent on buses effective October 1, 2025, although he later changed the effective date to November 1, 2025. Tariffs would be capped at 15 percent for the EU.
-
- Copper: President Trump directed the Commerce Department on February 25, 2025, to begin a Section 232 national security investigation for copper imports; the findings of the report are due by November 22, 2025. On July 8, 2025, he announced he would be imposing a 50 percent tariff on copper on August 1, 2025. On August 1, 2025, the copper tariffs went into effect, though raw materials were exempted.
- Lumber: President Trump directed the Commerce Department on March 1, 2025, to begin a Section 232 national security investigation into timber, lumber, and derivative imports; the findings of the report are due by November 26, 2025. On September 30, 2025, the president issued a proclamation announcing that he would be imposing 10 percent tariffs on lumber effective October 14, 2025.
- Processed Critical Minerals: On April 22, 2025, the Department of Commerce initiated a Section 232 investigation into processed critical minerals. On January 14, 2026, the president issued a proclamation to continue negotiations with trading partners to secure adequate supplies of critical minerals. No new tariffs have yet been planned, however, the proclamation also suggests that tariffs or minimum import prices could be considered in the future.
- Wind Turbines: On August 13, 2025, the Department of Commerce initiated a Section 232 investigation into wind turbines.
- Furniture: On August 22, 2025, President Trump announced that he planned to impose higher tariffs on furniture. On September 30, 2025, the president issued a proclamation announcing that he would be imposing tariffs on kitchen cabinets, bathroom vanities, and upholstered furniture of 25 percent, effective October 14, 2025. The rates on upholstered furniture would increase to 30 percent on January 1, 2026, and the rates on kitchen cabinets and bathroom vanities would increase to 50 percent on that date. On December 31, 2025, the president paused the tariff increases until January 1, 2027. Tariffs on these products are capped at 10 percent for the UK and 15 percent for the EU, Japan, and Taiwan.
- Agricultural Products: President Trump posted on March 3, 2025, that tariffs on “external” agricultural products would begin April 2, 2025.
- Apple: President Trump announced on May 23, 2025 that Apple would face additional 25 percent tariffs if it did not source its iPhone components from the US.
- Maritime Taxes: On April 9, 2025, President Trump signed an executive order that would impose Section 301 fees on deliveries by Chinese ships. China threatened to retaliate. The fees are scheduled to take effect October 14, 2025, starting at $50 per net ton for the arriving vessel. On October 30, 2025, President Trump and China agreed to suspend these port fees on each other’s ships for a year.
- Export Tariffs: On August 11, 2025, President Trump announced that he had negotiated a deal with Nvidia and AMD that would allow them to sell certain semiconductor chips to China in exchange for the US government receiving 15 percent of the generated revenue. It appears that rather than impose an export tariff (which is constitutionally prohibited), the Section 232 tariff that took effect in January 2026 will be used instead, applying only to certain semiconductor imports that are then re-exported.
- Foreign Films: On September 30, 2025, President Trump announced that he intends to impose 100 percent tariffs on films that are not made in the US, although it is unclear how this would be enforced.
The Now-Unlawful IEEPA Tariffs
-
-
- IEEPA Border Security and Fentanyl Tariffs: President Trump signed three executive orders on February 1, 2025, to impose 25 percent tariffs on Canada and Mexico and 10 percent tariffs on China using International Emergency Economic Powers Act (IEEPA) authority, to go into effect on February 4. On February 20, 2026, the Supreme Court ruled that the President cannot use IEEPA to impose tariffs. De minimis remains suspended under IEEPA.
- China: The 10 percent tariffs on all imports from China took effect on February 4, 2025. On February 27, Trump said the tariffs on China would increase by another 10 percent beginning March 4, which has taken effect. On June 11, Trump announced a trade deal with China that would leave in place the current 20 percent “fentanyl” and 10 percent “reciprocal” tariffs (for a total of 30 percent), pausing higher tariffs for 60 days. On August 11, President Trump announced that the increase in the reciprocal tariff to 125 percent would be paused for another 90 days. On October 10, the president announced he would impose an additional 100 percent tariff on China starting November 1, as a response to China’s imposition of export controls on rare earth minerals. On October 26, a “framework” of a deal with China was achieved, averting the implementation of an additional 100 percent tariff. On October 30, the president announced that the IEEPA “fentanyl” tariff on China would be lowered to 10 percent. As of December 1, because the IEEPA tariffs stack on top of the existing Section 301 tariffs on certain imports from China, some goods face tariffs as high as 45 percent.
- Canada: The tariffs on Canada received a 30-day suspension and took effect March 4, 2025. On March 5, the president exempted auto imports from the tariffs until April 2, and on March 6, the president exempted imports covered by the USMCA trade deal (approximately 38 percent of imports from Canada in 2024) until April 2 while lowering the tariff on non-USMCA potash (a fertilizer used in farming) and certain energy imports to 10 percent. On April 2, the exemption was extended indefinitely. On March 11, the president said the 25 percent rate on steel and aluminum would double to 50 percent in response to Canada’s retaliation, but later in the day walked back the doubling. On July 10, President Trump threatened Canada with a 35 percent tariff that would take effect August 1. On August 1, the 35 percent tariff on Canada went into effect. On October 25, President Trump announced he would be imposing an additional 10 percent tariff on Canadian imports, though no effective date was given. On January 31, 2026, President Trump threatened to increase tariffs on Canada to 50 percent and impose additional tariffs on its aircrafts if it pursued a trade deal with China.
- Mexico: The tariffs on Mexico received a 30-day suspension and took effect on March 4, 2025. On March 5, the president exempted auto imports from the tariffs until April 2, and on March 6 the president exempted imports covered by the USMCA trade deal (approximately 49 percent of imports from Mexico in 2024) until April 2. On April 2, the exemption was extended indefinitely. On July 12, President Trump announced the reciprocal tariffs for Mexico would increase to 30 percent by August 1. On July 31, he announced the tariff increase on Mexico would be delayed for 90 days. On October 28, President Trump announced he would be pausing the tariff increase indefinitely.
- IEEPA “Reciprocal” Tariffs: President Trump signed a presidential memorandum on February 13, 2025, to develop a plan for increasing US tariffs in response to other countries’ tariffs, tax policies, and any other policies including exchange rates and unfair practices. The recommendations are due April 1, 2025, and the president has indicated they will begin taking effect on April 2. The so-called reciprocal tariffs are applied to imports from nearly every US trading partner, but do not include goods that face product-specific tariffs like steel, aluminum, autos, and auto parts, and they also exclude a specific list of energy-related and other goods. On February 20, 2026, the Supreme Court ruled that the President cannot use IEEPA to impose tariffs.
- On April 2, 2025, the president announced a universal tariff of 10 percent, with higher tariffs on trading partners, as high as 50 percent, depending on their trade balance with the United States.
- On April 7, 2025, in response to China’s retaliation, President Trump indicated another 50 percent tariff would apply to China beginning April 9, which was increased on April 9 to a total rate of 125 percent under the reciprocal tariffs. The rate on most imports from China is 145 percent when accounting for the IEEPA border security and fentanyl tariffs.
- The 10 percent universal tariff took effect April 5, 2025, and on April 9, 2025, President Trump announced a 90-day pause on the reciprocal tariffs for all other countries excluding China.
- On May 8, 2025, the president announced the outlines of a trade deal with the UK, which would maintain the 10 percent “reciprocal” tariff, but lower the 25 percent auto tariff to 10 percent on the first 100,000 vehicle imports and eliminate the 25 percent steel and aluminum tariffs. In 2024, the US imported about 180,000 autos worth $10.5 billion and $1.8 billion of steel and aluminum from the UK. On June 30, 2025, the US-UK deal went into effect. The 25% tariff on imports of UK steel and aluminum will remain in place.
- On May 12, 2025, the Treasury Secretary announced a 90-day pause on escalations with China, reducing the 125 percent tariff to 10 percent. The China reciprocal tariffs were scheduled to go into effect August 12, 2025.
- On May 28, 2025, a panel of judges at the US International Court of Trade unanimously ruled that the IEEPA tariffs were illegal. The Trump administration immediately filed an appeal. The ruling provided the president up to 10 days to begin the process of halting collections of the IEEPA tariffs. The ruling would not apply to the Section 232 and 301 tariffs that are currently in place. Importers that paid tariffs under the IEEPA would be eligible for retroactive relief.
- On May 29, 2025, a second federal court ruled against the IEEPA tariffs.
- On June 10, 2025, the US Court of Appeals for the Federal Circuit of Washington, DC decided to allow Trump’s IEEPA tariffs to remain in effect until the court rules to uphold or reject the lower court’s decision, with arguments scheduled for July 31, 2025.
- On July 2, 2025, the president announced that the US had reached a deal with Vietnam. A 20 percent baseline tariff would remain on imports from Vietnam, while a 40 percent tariff would be imposed on any transshipments. No effective date has been scheduled for the deal.
- On July 7, 2025, the president announced that the reciprocal tariffs would be delayed until August 1. He sent letters to 14 countries, including Japan and South Korea, indicating the tariffs they would face if they did not present a trade deal with the US by the end of July. He also threatened “BRICS-aligned countries” with an additional 10 percent tariff.
- On July 9, 2025, Trump’s administration sent letters to 7 more countries and threatened Brazil with a 50 percent tariff that would take effect August 1, 2025.
- On July 14, 2025, President Trump threatened Russia with 100 percent tariffs.
- On July 22, 2025, President Trump announced that the US had reached a deal with the Philippines and Indonesia that would set their reciprocal tariff rates at 19 percent, down from the proposed 20 percent and 32 percent respectively.
- On July 23, 2025, President Trump announced that the US had reached a deal with Japan that would set its reciprocal tariff rate at 15 percent, down from the proposed 24 percent.
- On July 30, 2025, President Trump signed an executive order imposing an additional 40 percent tariff on Brazil, delaying implementation of the tariff until August 6, 2025, and published a list of exemptions. He also signed an executive order that would end the de minimis exemption for all countries starting August 29, 2025.
- On July 31, 2025, President Trump signed an executive order with changes to reciprocal tariff rates on more than 60 countries and additional penalties for transshipments, delaying implementation of those until August 7, 2025.
- On August 6, 2025, the president announced he would double the reciprocal tariff rate on India to 50 percent, effective August 27, 2025, as a “penalty” for their Russian oil purchases.
- On August 7, 2025, the reciprocal tariff increases took effect.
- On August 29, 2025, the US Court of Appeals declared the IEEPA tariffs illegal, ruling that the president lacked the authority to impose them under his emergency powers. The tariffs will remain in effect while the administration prepares its appeal to the Supreme Court. The Supreme Court will hear oral arguments on November 5, 2025.
- On September 5, 2025, the president updated the exemptions list to include an additional $30 billion worth of goods (based on 2024 values), and removed another $6 billion worth of goods from the exemptions list, subjecting those to the IEEPA tariffs.
- On October 26, 2025, President Trump announced a new trade deal with Cambodia and released a list of goods that would be exempt from its reciprocal tariff.
- On November 14, 2025, President Trump released a new exemptions list excluding certain food and agricultural products from the IEEPA tariffs, except for Brazil, covering about $51.5 billion worth of imports based on 2024 import levels. The president also lowered Switzerland’s reciprocal tariff rate from 39 percent to 15 percent.
- On November 21, 2025, President Trump released an additional agricultural exemptions list for Brazil.
- On January 15, 2026, President Trump announced a new trade deal with Taiwan that would lower its reciprocal tariff rate from 20 percent to 15 percent.
- On February 2, 2026, President Trump announced that he would drop the 25 percent tariff on India for purchasing Russian oil, and would lower its reciprocal tariff from 25 percent to 18 percent.
- Venezuelan Oil Tariffs: President Trump signed an executive order on March 24, 2025, to impose an additional 25 percent tariff on Venezuela and any countries that purchase oil and gas from Venezuela, which could become effective April 2, 2025.
- European Union: President Trump announced plans on February 26, 2025, to impose tariffs of 25 percent on imports from the European Union. The authority to impose these tariffs has not been specified. On April 2, 2025, President Trump specified the “reciprocal” tariff rate on imports from the EU would be 20 percent. On May 23, 2025, President Trump announced he would be imposing a 50 percent reciprocal tariff on the EU beginning June 1, 2025. On May 25, 2025, he announced these tariffs would take effect July 9, 2025, instead. On July 12, 2025, President Trump announced the reciprocal tariffs for the EU would be set at 30 percent by August 1, 2025. This is down from the previous reciprocal tariff for the EU announced in May 2025, which had been set at 50 percent. On July 27, 2025, President Trump announced that the US had reached a deal with the EU that would set its reciprocal tariff rate at 15 percent, down from the proposed 30 percent. On August 21, 2025, President Trump announced as part of the EU deal that he would reduce the tariff on EU autos from 27.5 percent to 15 percent, conditional on the EU introducing legislation to lower its tariffs on certain US goods. He also announced that any new tariffs on pharmaceuticals and semiconductors would be capped at 15 percent for the EU. On September 26, 2025, the president released an updated list of EU exemptions.
- Tariff Stacking: On April 29, 2025, the president signed an executive orderto prevent certain tariffs from stacking; rather than add on, the executive order specifies a hierarchy for which tariffs apply. The top priority is auto tariffs, followed by IEEPA “fentanyl” tariffs on Canada and Mexico, followed by steel and aluminum tariffs.
- Russian Oil Tariffs: On August 6, 2025, President Trump announced an executive order to impose tariffs on any countries importing oil from Russia, applying to imports from India at a 25 percent tariff rate. On February 2, 2026, President Trump announced he would lift the 25 percent tariffs on India.
- Iranian Oil Tariffs: On January 12, 2026, President Trump announced that countries that buy Iranian oil would face an additional 25 percent tariff.
- Greenland Tariffs: On January 17, 2026, President Trump announced that he would impose an additional 10 percent tariff on Denmark, Norway, Sweden, France, Germany, the United Kingdom, the Netherlands, and Finland, starting February 1, 2026. The tariffs will rise to 25 percent on June 1, 2026, if the US is not able to acquire Greenland by then. On January 21, 2026, the president announced he would not be imposing these tariffs.
- Cuban Oil Tariffs: On January 29, 2026, President Trump signed an executive order that would permit tariffs on countries supplying Cuba with oil. President Trump has threatened, but not yet imposed, additional tariffs on imports from Mexico under this order.
- IEEPA Border Security and Fentanyl Tariffs: President Trump signed three executive orders on February 1, 2025, to impose 25 percent tariffs on Canada and Mexico and 10 percent tariffs on China using International Emergency Economic Powers Act (IEEPA) authority, to go into effect on February 4. On February 20, 2026, the Supreme Court ruled that the President cannot use IEEPA to impose tariffs. De minimis remains suspended under IEEPA.
-
Retaliation
-
-
- China
-
- IEEPA fentanyl retaliation: 10 percent and 15 percent tariffs on $13.9 billion of US exports (including ag equipment and oil) effective on February 10, 2025; 10 percent and 15 percent tariffs on $19.5 billion of US exports (including agricultural products) effective on March 10, 2025.
- IEEPA universal retaliation: 34 percent tariffs on all $144 billion of US exports announced on April 4, 2025; on April 9, 2025, China increased its retaliation to 84 percent on all US exports; on April 11, 2025, China increased its retaliation to 125 percent on all US exports; on May 12, 2025, China reduced its retaliation to 10 percent on all US exports under a 90-day pause.
- As part of the trade deal announced June 10, 2025, China paused tariff increases for 90 days and walked back some of its export restrictions, including for rare earth minerals and magnets.
- On October 9, 2025, China announced additional export controls on rare earth minerals that would take effect November 8, 2025. The US and China later that month agreed to a “framework” of a deal that would avert the implementation of these export controls.
-
- Canada
-
- IEEPA fentanyl retaliation: 25 percent tariffs on $20.8 billion of US exports effective on March 4, 2025; 25 percent tariffs on $86.7 billion of US exports scheduled for March 23, 2025; planned 25 percent tax on electricity exports from Ontario to the US, currently suspended
- Section 232 steel and aluminum retaliation: 25 percent tariffs on $20.7 billion of US exports effective March 13, 2025
- Section 232 auto retaliation: 25 percent tariffs on $30.5 billion of US autos
- On August 22, 2025, Prime Minister Mark Carney announced he would remove retaliatory tariffs on US exports except for autos, steel, and aluminum, effective September 1, 2025.
-
- European Union
-
-
- Section 232 retaliation: Lift suspension of previous tariffs, with rates of up to 50 percent, affecting $8 billion of US exports scheduled for April 1, 2025 (including whiskey); expand tariffs to an additional $20 billion of US exports scheduled for April 13, 2025. On July 15, 2025, the EU released a list of $84 billion worth of US goods that would face retaliatory tariffs if no deal is reached by August 1, 2025. On August 4, 2025, the retaliatory tariffs were delayed for six months.
-
-
- China
-
Modeling Notes
Methodological Note: On October 23, 2025, we refined how we apply our elasticity estimates to tariffs. We adopted a functional form equation and a higher elasticity of -2 to reflect nonlinearity across different tariff rates. These refinements are based on research from Boehm et al. and the USITC. The implication of this methodological change is that higher tariff rates cause imports to drop significantly but not fall all the way to zero. As a result, some of our tariff revenue estimates, including for the 100 percent tariffs on China, are higher than previously estimated.
We updated our income and payroll tax offset to reflect the new values under the One Big Beautiful Bill Act (OBBBA), and it averages 24.6 percent from 2026 through 2035. We model the following policies:
- Tariffs on steel, aluminum, and copper, including derivatives, ranging from 15 percent to 50 percent as per the April 2, 2026, and June 1, 2026, executive orders, with preferential rates for the UK and Taiwan. Prior to the executive orders, Tax Foundation had ignored derivatives in its modeling, focusing on primary metals only due to the lack of data on metal content in derivative products. This caused us to understate the effects of the metals tariffs. With the additional information available in the April 2026 tariff announcements, we have now retroactively updated our 2025 estimates to include the effects of tariffs on derivative products. We assume that the derivatives now removed from the tariff list faced an effective tariff rate of 22.7 percent and that the other derivatives with higher metal content faced an effective rate of 25 percent
- A 25 percent tariff on all autos and certain auto parts, excluding US content of imports from Canada and Mexico, and providing a lower rate on auto imports from the UK, Japan, South Korea, and Taiwan We illustrate the effects of this policy with 25 percent tariffs on all auto and auto parts specified in the Federal Register excluding USMCA trade.
- A 10 percent tariff on lumber.
- A 25 percent tariff on upholstered furniture effective October 14, 2025, increasing to 30 percent on January 1, 2027 (10 percent for the UK and 15 percent for the EU, Japan, South Korea, and Taiwan).
- A 25 percent tariff on bathroom vanities and kitchen cabinets effective October 14, 2025, increasing to 50 percent January 1, 2027 (10 percent for the UK and 15 percent for the EU, Japan, South Korea, and Taiwan).
- A 25 percent tariff on heavy trucks and a 10 percent tariff on buses, excluding those covered under USMCA, effective November 1, 2025.
- Retaliation effective as of September 1, 2025, excluding export controls.
- Ending the exemption for de minimis imports.
- A Section 122 tariff of 10 and 15 percent on approximately $1.2 trillion worth of imports, expiring after 150 days.
- A Section 232 tariff of 100 percent on patented pharmaceuticals and ingredients, with a lower rate of 15 percent for the EU, Japan, South Korea, Switzerland, and Lichenstein, and a lower rate of
- A Section 301 tariff of 25 percent on $24 billion worth of Brazilian imports.
- A Section 338 tariff of 50 percent on $16 billion worth of Canadian imports.
- Section 301 tariffs with rates of either 10 percent or 12.5 percent on $970 billion worth of imports.
Our IEEPA modeling covered the following policies:
- A 20 percent tariff on all imports from China, lowered to 10 percent effective November 1, 2025, plus a 10 percent baseline tariff on all imports from China effective April 2, excluding those subject to Section 232 tariffs or on the exclusion list (resulting in a 20 percent tariff on most imports from China).
- A 25 percent tariff on all imports from Mexico in 2025. USMCA-compliant imports are exempt from the tariffs indefinitely. With an increase in USMCA-compliant goods coming through the border, we estimate that tariffs will apply to $37 billion of Mexican imports in our baseline on an annualized basis.
- A 10 percent tariff on energy and potash imports indefinitely, plus a 25 percent tariff on all remaining imports from Canada in 2025 until August 1,2025, when the rate increased to 35 percent. USMCA-compliant imports are exempt from the tariffs indefinitely. With an increase in USMCA-compliant goods coming through the border, we estimate that tariffs will apply to $41 billion of Canadian imports in our baseline on an annualized basis.
- A 10 percent baseline tariff on all countries from April through June of 2025, exempting Section 232 goods, Annex II goods, and specified electronics.
- A range of “reciprocal” tariffs on most US trading partners, exempting Section 232 goods, Annex II goods, and other specified country exemptions. We do not model the additional penalties for transshipments announced on July 31,2025.
Historical Evidence
Tariffs Raise Prices and Reduce Economic Growth
Economists generally agree free trade increases the level of economic output and income, while conversely, trade barriers reduce economic output and income. Historical evidence shows tariffs raise prices and reduce available quantities of goods and services for US businesses and consumers, resulting in lower income, reduced employment, and lower economic output.
Tariffs could reduce US output through a few channels. One possibility is a tariff may be passed on to producers and consumers in the form of higher prices. Tariffs can raise the cost of parts and materials, which would raise the price of goods using those inputs and reduce private sector output. This would result in lower incomes for both owners of capital and workers. Similarly, higher consumer prices due to tariffs would reduce the after-tax value of both labor and capital income. Because higher prices would reduce the return to labor and capital, they would incentivize Americans to work and invest less, leading to lower output.
Alternatively, the US dollar may appreciate in response to tariffs, offsetting the potential price increase for US consumers. The more valuable dollar, however, would make it more difficult for exporters to sell their goods on the global market, resulting in lower revenues for exporters. This would also result in lower US output and incomes for both workers and owners of capital, reducing incentives for work and investment and leading to a smaller economy.
Many economists have evaluated the consequences of the trade war tariffs on the American economy, with results suggesting the tariffs have raised prices and lowered economic output and employment since the start of the trade war in 2018.
-
-
-
- A February 2018 analysis by economists Kadee Russ and Lydia Cox found that steel‐consuming jobs outnumber steel‐producing jobs 80 to 1, indicating greater job losses from steel tariffs than job gains.
- A March 2018 Chicago Booth survey of 43 economic experts revealed that 0 percent thought a US tariff on steel and aluminum would improve Americans’ welfare.
- An August 2018 analysis from economists at the Federal Reserve Bank of New York warned the Trump administration’s intent to use tariffs to narrow the trade deficit would reduce imports and US exports, resulting in little to no change in the trade deficit.
- A March 2019 National Bureau of Economic Research study conducted by Pablo D. Fajgelbaum and others found that the trade war tariffs did not lower the before-duties import prices of Chinese goods, resulting in US importers taking on the entire burden of import duties in the form of higher after-duty prices.
- An April 2019 University of Chicago study conducted by Aaron Flaaen, Ali Hortacsu, and Felix Tintelnot found that after the Trump administration imposed tariffs on washing machines, washer prices increased by $86 per unit and dryer prices increased by $92 per unit, due to package deals, ultimately resulting in an aggregate increase in consumer costs of over $1.5 billion.
- An April 2019 research publication from the International Monetary Fund used a range of general equilibrium models to estimate the effects of a 25 percent increase in tariffs on all trade between China and the US, and each model estimated that the higher tariffs would bring both countries significant economic losses.
- An October 2019 study by Alberto Cavallo and coauthors found tariffs on imports from China were almost fully passed through to US import prices but only partially to retail consumers, implying some businesses absorbed the higher tariffs, reducing retail margins, instead of passing them on to retail consumers.
- In December 2019, Federal Reserve economists Aaron Flaaen and Justin Pierce found a net decrease in manufacturing employment due to the tariffs, suggesting that the benefit of increased production in protected industries was outweighed by the consequences of rising input costs and retaliatory tariffs.
- A February 2020 paper from economists Kyle Handley, Fariha Kamal, and Ryan Monarch estimated the 2018–2019 import tariffs were equivalent to a 2 percent tariff on all US exports.
- A December 2021 review of the data and methods used to estimate the trade war effects through 2021, by Pablo Fajgelbaum and Amit Khandelwal, concluded that “US consumers of imported goods have borne the brunt of the tariffs through higher prices, and that the trade war has lowered aggregate real income in both the US and China, although not by large magnitudes relative to GDP.”
- A January 2022 study from the US Department of Agriculture estimated the direct export losses from the retaliatory tariffs totaled $27 billion from 2018 through the end of 2019.
- A May 2023 United States International Trade Commission report from Peter Herman and others found evidence for near complete pass-through of the steel, aluminum, and Chinese tariffs to US prices. It also found an estimated $2.8 billion production increase in industries protected by the steel and aluminum tariffs was met with a $3.4 billion production decrease in downstream industries affected by higher input prices.
- A January 2024 International Monetary Fund paper found that unexpected tariff shocks tend to reduce imports more than exports, leading to slight decreases in the trade deficit at the expense of persistent gross domestic product losses—for example, the study estimates reversing the 2018–2019 tariffs would increase US output by 4 percent over three years.
- A January 2024 study by David Autor and others concludes that the 2018–2019 tariffs failed to provide economic help to the heartland: import tariffs had “neither a sizable nor significant effect on US employment in regions with newly‐protected sectors” and foreign retaliation “by contrast had clear negative employment impacts, particularly in agriculture.”
-
-
Historical Context
2024 Campaign Proposals
Tariffs featured heavily in the 2024 presidential campaign as candidate Trump proposed a new 10 percent to 20 percent universal tariff on all imports, a 60 percent tariff on all imports from China, higher tariffs on EVs from China or across the board, 25 percent tariffs on Canada and Mexico, and 10 percent tariffs on China.
We estimate Trump’s proposed 20 percent universal tariffs and an additional 50 percent tariff on China to reach 60 percent will reduce long-run economic output by 1.3 percent before any foreign retaliation. They will increase federal tax revenues by $3.8 trillion ($3.1 trillion on a dynamic basis before retaliation) from 2025 through 2034.
2018-2019 Trade War: Economic Effects of Imposed and Retaliatory Tariffs
Using the Tax Foundation’s General Equilibrium Model, we estimate the Trump-Biden Section 301 and Section 232 tariffs will reduce long-run GDP by 0.2 percent, the capital stock by 0.1 percent, and hours worked by 142,000 full-time equivalent jobs. The reason tariffs have no impact on pre-tax wages in our estimates is that, in the long run, the capital stock shrinks in proportion to the reduction in hours worked, so that the capital-to-labor ratio, and thus the level of wages, remains unchanged. Removing the tariffs would boost GDP and employment, as Tax Foundation estimates have shown for the Section 232 steel and aluminum tariffs.
Table 6. Estimated Impact of US Imposed Tariffs, 2018-2019 Trade War
| GDP | -0.2% |
| Capital Stock | -0.1% |
| Pre-Tax Wages | 0.0% |
| Full-Time Equivalent (FTE) Jobs | -142,000 |
Source: Tax Foundation General Equilibrium Model, June 2024.
We estimate the retaliatory tariffs stemming from Section 232 and Section 301 actions total approximately $13.2 billion in tariff revenues. Retaliatory tariffs are imposed by foreign governments on their country’s importers. While they are not direct taxes on US exports, they raise the after-tax price of US goods in foreign jurisdictions, making them less competitively priced in foreign markets. We estimate the retaliatory tariffs will reduce US GDP and the capital stock by less than 0.05 percent and reduce full-time employment by 27,000 full-time equivalent jobs. Unlike the tariffs imposed by the United States, which raise federal revenue, tariffs imposed by foreign jurisdictions raise no revenue for the US but result in lower US output.
Table 7. Estimated Impact of US Retaliatory Tariffs, 2018-2019 Trade War
| GDP | Less than -0.05% |
| Capital Stock | Less than -0.05% |
| Pre-Tax Wages | 0.0% |
| Full-Time Equivalent (FTE) Jobs | -27,000 |
Source: Tax Foundation General Equilibrium Model, June 2024.
Tariff Revenue Collections Under the Trump-Biden Tariffs
As of the end of 2024, the trade war tariffs have generated more than $264 billion of higher customs duties collected for the US government from US importers. Of that total, $89 billion, or about 34 percent, was collected during the Trump administration, while the remaining $175 billion, or about 64 percent, was collected during the Biden administration.
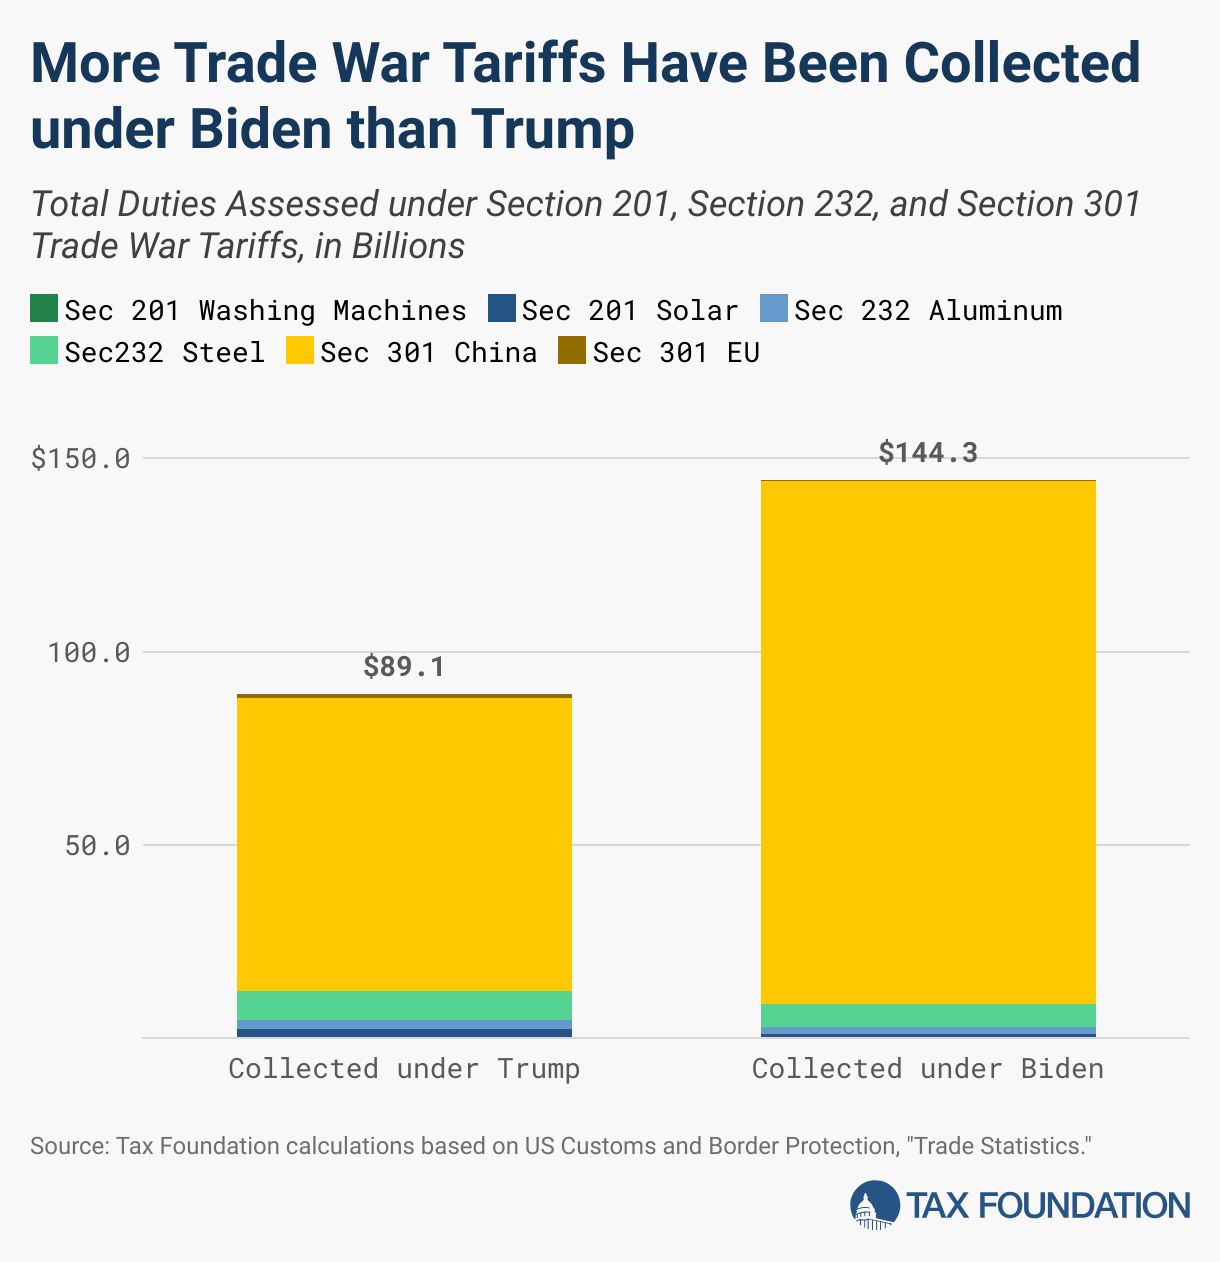
Before accounting for behavioral effects, the $79 billion in higher tariffs amount to an average annual tax increase on US households of $625. Based on actual revenue collections data, trade war tariffs have directly increased tax collections by $200 to $300 annually per US household, on average. The actual cost to households is higher than both the $600 estimate before behavioral effects and the $200 to $300 after, because neither accounts for lower incomes as tariffs shrink output, nor the loss in consumer choice as people switch to alternatives that do not face tariffs.

2018-2019 Trade War Timeline
The Trump administration imposed several rounds of tariffs on steel, aluminum, washing machines, solar panels, and goods from China, affecting more than $380 billion worth of trade at the time of implementation and amounting to a tax increase of nearly $80 billion. The Biden administration maintained most tariffs, except for the suspension of certain tariffs on imports from the European Union, the replacement of tariffs with tariff-rate quotas (TRQs) on steel and aluminum from the European Union and United Kingdom and imports of steel from Japan, and the expiration of the tariffs on washing machines after a two-year extension. In May 2024, the Biden administration announced additional tariffs on $18 billion of Chinese goods for a tax increase of $3.6 billion.
Altogether, the trade war policies currently in place add up to $79 billion in tariffs based on trade levels at the time of tariff implementation. Note the total revenue generated will be less than our static estimate because tariffs reduce the volume of imports and are subject to evasion and avoidance (which directly lowers tariff revenues) and they reduce real income (which lowers other tax revenues).
Section 232, Steel and Aluminum
In March 2018, President Trump announced the administration would impose a 25 percent tariff on imported steel and a 10 percent tariff on imported aluminum. The value of imported steel totaled $29.4 billion, and the value of imported aluminum totaled $17.6 billion in 2018. Based on 2018 levels, the steel tariffs would have amounted to $9 billion and the aluminum tariffs to $1.8 billion. Several countries, however, have been excluded from the tariffs.
In early 2018, the US reached agreements to permanently exclude Australia from steel and aluminum tariffs, use quotas for steel imports from Brazil and South Korea, and use quotas for steel and aluminum imports from Argentina.
In May 2019, President Trump announced that the US was lifting tariffs on steel and aluminum from Canada and Mexico.
In 2020, President Trump expanded the scope of steel and aluminum tariffs to cover certain derivative products, totaling approximately $0.8 billion based on 2018 import levels.
In August 2020, President Trump announced that the US was reimposing tariffs on aluminum imports from Canada. The US imported approximately $2.5 billion worth of non-alloyed unwrought aluminum, resulting in a $0.25 billion tax increase. About a month later, the US eliminated the 10 percent tariff on Canadian aluminum that had just been reimposed.
In 2021 and 2022, the Biden administration reached deals to replace certain steel and aluminum tariffs with tariff rate quota systems, whereby certain levels of imports will not face tariffs, but imports above the thresholds will. TRQs for the European Union took effect on January 1, 2022; TRQs for Japan took effect on April 1, 2022; and TRQs for the UK took effect on June 1, 2022. Though the agreements on steel and aluminum tariffs will reduce the cost of tariffs paid by some US businesses, a quota system similarly leads to higher prices, and further, retaining tariffs at the margin continues the negative economic impact of the previous tariff policy.
Tariffs on steel, aluminum, and derivative goods currently account for $2.7 billion of the $79 billion in tariffs, based on initial import values. Current retaliation against Section 232 steel and aluminum tariffs targets more than $6 billion worth of American products for an estimated total tax of approximately $1.6 billion.
Section 301, Chinese Products
Under the Trump administration, the United States Trade Representative began an investigation of China in August 2017, which culminated in a March 2018 report that found China was conducting unfair trade practices.
In March 2018, President Trump announced tariffs on up to $60 billion of imports from China. The administration soon published a list of about $50 billion worth of Chinese products to be subject to a new 25 percent tariff. The first tariffs began July 6, 2018, on $34 billion worth of Chinese imports, while tariffs on the remaining $16 billion went into effect August 23, 2018. These tariffs amount to a $12.5 billion tax increase.
In September 2018, the Trump administration imposed another round of Section 301 tariffs—10 percent on $200 billion worth of goods from China, amounting to a $20 billion tax increase.
In May 2019, the 10 percent tariffs increased to 25 percent, amounting to a $30 billion increase. That increase had been scheduled to take effect beginning in January 2019, but was delayed.
In August 2019, the Trump administration announced plans to impose a 10 percent tariff on approximately $300 billion worth of additional Chinese goods beginning on September 1, 2019, but soon followed with an announcement of schedule changes and certain exemptions.
In August 2019, the Trump administration decided that 4a tariffs would be 15 percent rather than the previously announced 10 percent, a $5.6 billion tax increase.
In September 2019, the Trump administration imposed “List 4a,” a 15 percent tariff on $112 billion of imports, an $11 billion tax increase. They announced plans for tariffs on the remaining $160 billion to take effect on December 15, 2019.
In December 2019, the administration reached a “Phase One” trade deal with China and agreed to postpone indefinitely the stage 4b tariffs of 15 percent on approximately $160 billion worth of goods that were scheduled to take effect December 15 and to reduce the stage 4a tariffs from 15 percent to 7.5 percent in January 2020, reducing tariff revenues by $8.4 billion.
In May 2024, the Biden administration published its required statutory review of the Section 301 tariffs, deciding to retain them and impose higher rates on $18 billion worth of goods. The new tariff rates range from 25 to 100 percent on semiconductors, steel and aluminum products, electric vehicles, batteries and battery parts, natural graphite and other critical materials, medical goods, magnets, cranes, and solar cells. Some of the tariff increases go into effect immediately, while others are scheduled for 2025 or 2026. Based on 2023 import values, the increases will add $3.6 billion in new taxes.
Section 301 tariffs on China currently account for $77 billion of the $79 billion in tariffs, based on initial import values. China has responded to the United States’ Section 301 tariffs with several rounds of tariffs on more than $106 billion worth of US goods, for an estimated tax of nearly $11.6 billion.
WTO Dispute, European Union
In October 2019, the United States won a nearly 15-year-long World Trade Organization (WTO) dispute against the European Union. The WTO ruling authorized the United States to impose tariffs of up to 100 percent on $7.5 billion worth of EU goods. Beginning October 18, 2019, tariffs of 10 percent were to be applied on aircraft and 25 percent on agricultural and other products.
In summer 2021, the Biden administration reached an agreement to suspend the tariffs on the European Union for five years.
Section 201, Solar Panels and Washing Machines
In January 2018, the Trump administration announced it would begin imposing tariffs on washing machine imports for three years and solar cell and module imports for four years as the result of a Section 201 investigation.
In 2021, the Trump administration extended the washing machine tariffs for two years through February 2023, and they have now expired.
In 2022, the Biden administration extended the solar panel tariffs for four years, though later provided temporary two-year exemptions for imports from four Southeast Asian nations beginning in 2022, which account for a significant share of solar panel imports.
In 2024, the Biden administration removed separate exemptions for bifacial solar panels from the Section 201 tariffs. Additionally, the temporary two-year exemptions expired and the Biden administration is further investigating solar panel imports from the four Southeast Asian nations for additional tariffs.
We estimate the solar cell and module tariffs amounted to a $0.2 billion tax increase based on 2018 import values and quantities, while the washing machine tariffs amounted to a $0.4 billion tax increase based on 2018 import values and quantities.
We exclude the tariffs from our tariff totals given the broad exemptions and small magnitudes.
Trade Volumes Since Tariffs Were Imposed
Since the tariffs were imposed, imports of affected goods have fallen, even before the onset of the COVID-19 pandemic. Some of the biggest drops are the result of decreased trade with China, as affected imports decreased significantly after the tariffs and still remain below their pre-trade war levels. Even though trade with China fell after the imposition of tariffs, it did not fundamentally alter the overall balance of trade, as the reduction in trade with China was diverted to increased trade with other countries.

Table 8. Imports Affected by US Tariffs
| Tariff and Effective Date | 2017 | 2018 | 2019 | 2020 | 2021 | 2022 | 2023 | Rate |
|---|---|---|---|---|---|---|---|---|
| Section 232 Steel (March 2018) | $15.90 | $15.50 | $11.40 | $7.10 | $13.50 | $9.50 | $5.50 | 25% |
| Section 232 Aluminum (March 2018) | $9.00 | $9.60 | $8.40 | $5.20 | $7.50 | $9.80 | $5.60 | 10% |
| Section 232 Derivative Steel Articles (February 2020) | $0.40 | $0.50 | $0.50 | $0.40 | $0.50 | $0.60 | $0.30 | 25% |
| Section 232 Derivative Aluminum Articles (February 2020) | $0.20 | $0.30 | $0.20 | $0.20 | $0.30 | $0.30 | $0.30 | 10% |
| Section 301, List 1 (July 2018) | $31.90 | $30.30 | $22.00 | $20.10 | $24.10 | $26.10 | $23.60 | 25% |
| Section 301, List 2 (August 2018) | $13.80 | $14.80 | $8.50 | $9.60 | $10.30 | $10.70 | $8.20 | 25% |
| Section 301, List 3 (September 2018, increased May 2019) | $159.20 | $181.30 | $120.00 | $107.10 | $119.60 | $111.80 | $86.50 | 10% in 2019, then 25% |
| Section 301, List 4A (September 2019, lowered January 2020) | $101.90 | $112.20 | $113.90 | $101.40 | $104.70 | $102.00 | $84.90 | 15% in 2019; then 7.5% |
| Biden Admin Section 301 Expansion (2024 to 2026) | $7.50 | $8.00 | $5.60 | $8.90 | $9.00 | $15.70 | $18.00 | 25% to 100% |
Source: Federal Register notices; Tom Lee and Jacqueline Varas, “The Total Cost of U.S. Tariffs,” American Action Forum, Mar. 24, 2022, https://www.americanactionforum.org/research/the-total-cost-of-tariffs/; data retrieved from USITC DataWeb.
Timeline of Activity
- July 24, 2026: We updated estimates for the Section 232 tariffs on steel, aluminum, and copper to account for changes in June, the new Section 301 tariffs, and the new Section 338 tariff on Canada.
- April 27, 2026: We updated estimates for the Section 232 tariffs on steel, aluminum, and copper; provided new estimates for Section 232 tariffs on pharmaceuticals; and updated the applied rate time series to reflect more detailed steel and aluminum tariff modeling.
- March 13, 2026: We added a distribution table for Section 122 tariff, revenue for de minimis, and timelines on new Section 301 investigations.
- February 24, 2026: The Section 122 tariffs took effect at 10 percent, not the threatened 15 percent.
- February 23, 2026: Includes estimates of the new Section 122 tariff of 10 percent that applies to all countries and the increase of the Section 122 tariffs to 15 percent.
- February 20, 2026: The Supreme Court ruled the President cannot impose tariffs under IEEPA. Added average tariff rate for 2025, section on the trade deficit for 2025, and new estimates reflecting the recent Supreme Court ruling the IEEPA tariffs illegal.
- February 6, 2026: Economic and revenue estimates were updated to account for lower tariff rates on India, and the tariff timeline was updated with new threats on Canada and Mexico. New distributional details were added as well.
- January 23, 2026: Updated Revenue estimates for 2035 were added, moving the tracker into the next 10-year revenue baseline. We updated economic and revenue estimates to account for lower tariff rates on Taiwan (from 20 percent to 15 percent) and certain South Korea Section 232 covered imports. Revenue estimates for Canada and Mexico were adjusted based on the latest trade data for USMCA imports. We also updated the timeline section for new proclamations related to the Section 232 investigations into imports of semiconductors and critical minerals.
- January 9, 2026: Updated economic and revenue estimates for the tariffs with new adjustments to income and payroll tax offsets.
- December 1, 2025: Includes updated estimates to account for new Brazil exemptions on certain food and agricultural products and adjustments to the IEEPA Canada and Mexico estimates to account for higher shares of USMCA-compliant imports. Based on 2024 import shares, 38 percent of imports from Canada and 49 percent of imports from Mexico were brought in under USMCA; more recent data, averaged from April through July of 2025, show USMCA shares had risen to 65 percent for Canada and 57 percent for Mexico.
- November 17, 2025: Includes updated estimates to account for new exemptions on certain food and agricultural products, valued at about $51.5 billion based on 2024 import levels, and a lowering of Switzerland’s reciprocal tariff rate from 39 percent to 15 percent.
- November 11, 2025: Includes updated estimate for Mexico tariffs to account for pause in tariff increase, incorporates a 10 percent tariff on buses, and adds a new exemptions list for Cambodia.
- October 31, 2025: Includes new estimates incorporating the lower IEEPA tariff rate on China, as well as other adjustments to tariff stacking.
- October 27, 2025: Includes new estimates for the IEEPA and Section 232 tariffs, including taking the 100 percent tariff on China off the table, adding another 10 percent tariff on Canada, and placing Section 232 tariffs on heavy trucks. All estimates now reflect new income and payroll tax offsets to account for the One Big Beautiful Bill Act and refined elasticity effects.
- October 17, 2025: Includes new estimates for the Section 232 tariffs on lumber, furniture, and cabinets, and a new estimate for the additional 100 percent tariff on China.
- October 10, 2025: Includes updated estimates for the reciprocal tariffs to account for new EU exemptions.
- October 3, 2025: Includes updated timeline for new Section 232 tariffs on pharmaceuticals, lumber, heavy trucks, and furniture.
- September 26, 2025: Includes updated Section 232 revenue estimates to account for the reduced rate applied to auto imports from Japan.
- September 12, 2025: Updated estimates for the reciprocal tariffs to account for new exemptions issued on September 5.
- September 5, 2025: Includes updated timeline with US Court of Appeals ruling on IEEPA tariffs, and new estimates for the both the reciprocal tariffs and retaliatory tariffs.
- August 22, 2025: Includes updated timeline with EU trade deal details and new tariffs on steel and aluminum derivatives.
- August 15, 2025: Includes updated revenue and economic estimates for the China reciprocal tariffs due to the extension of the 90-day pause.
- August 8, 2025: Includes updated revenue and economic estimates for the reciprocal tariffs, copper tariffs, and eliminating the de minimis exemption.
- August 1, 2025: Includes updated revenue and economic estimates for the reciprocal tariff revisions released on July 31.
- July 29, 2025: Includes updated revenue and economic estimates for the reciprocal tariffs following new deals with the EU, Japan, and other countries
- July 15, 2025: Includes updated revenue and economic estimates for the reciprocal tariffs and an update on the EU retaliatory tariffs.
- July 14, 2025: Updated revenue and economic estimates for the reciprocal tariffs and the Section 232 copper tariffs.
- July 9, 2025: Includes update to timeline on implementation of reciprocal tariffs, and updated revenue and economic estimates for those tariffs.
- July 3, 2025: Includes updated tariff revenue and economic growth estimates reflecting the US-UK trade deal, and new details for the timeline on the forthcoming US-Vietnam trade deal.
- June 17, 2025: Includes additional chart on monthly customs duties revenues.
- June 13, 2025: Includes details on court case developments, 90-day tariff pause for China trade deal, and a further expansion to steel tariffs.
- June 2, 2025: Includes doubling of Section 232 steel and aluminum tariffs from 25 percent to 50 percent.
- May 30, 2025: Adds to the timeline the injunction issued by the US Court of International Trade that declared the IEEPA tariffs unconstitutional and shows the economic, revenue, and distributional impacts if the decision is upheld.
- May 27, 2025: Includes new chart showing daily deposits of tariff and certain excise tax payments in calendar year 2025 compared to calendar year 2024.
- May 27, 2025: Includes delay for 50 percent "reciprocal" tariffs on all imports from the EU.
- May 23, 2025: Includes 50 percent “reciprocal” tariff on all imports from the EU in economic, revenue, and distributional estimates.
- May 12, 2025: Includes 90-day reduction in tariffs on imports from China in revenue estimates, separates economic and revenue estimates to display 10 percent baseline tariff separately from scheduled increases in tariffs, updates all economic, revenue, and distributional results to the latest version of Tax Foundation’s model.
- May 9, 2025: Adds information on the US-UK deal to eventually reduce auto tariffs and steel and aluminum tariffs.
- May 5, 2025: Incorporates new stacking order executive order so that only one of the Section 232 tariffs or IEEPA “fentanyl” tariffs on Canada or Mexico applies.
- April 18, 2025: Includes new exemption for electronics imports from the “reciprocal” tariffs.
- April 11, 2025: New chart on weighted average tariff rates and incorporates China’s higher retaliatory rate on US exports.
- April 10, 2025: Includes the 90-day pause of escalating the so-called reciprocal tariffs that apply to nearly all US trading partners and the increase to 125 percent reciprocal tariffs on China.
- April 9, 2025: Update: Includes the additional 50 percent tariff on all imports from China.
- April 4, 2025: Update: Includes new retaliatory tariffs announced by China and Canada.
- April 3, 2025: Reflects exemption list published on April 3 for the April 2 universal tariffs.
- April 3, 2025: Update reflects President Trump’s new April 2 tariffs related to a national economic emergency on 60 trading partners at specific rates, other trading partners at 10 percent, and non-USMCA Canada and Mexico imports at a 12 percent rate after IEEPA fentanyl tariffs end, and updated auto, steel, and aluminum tariffs.
- April 1, 2025: Timeline includes new details on Section 232 auto and auto part tariffs and modeling includes new tariffs on auto imports and on Venezuela and trading partners that import oil from Venezuela.
- March 25, 2025: Updated timeline to add new “secondary” tariff threat on imports from Venezuela and countries that purchase oil or gas from Venezuela.
- March 21, 2025: Updated timeline for EU retaliation against US Section 232 tariffs.
- March 12, 2025: Update: New revenue and economic estimates for changes to IEEPA tariffs and implementation of Section 232 steel and aluminum tariffs.
- March 7, 2025: Updates timeline for Canada, Mexico, and China tariffs. Tax Foundation is in the process of updating economic and revenue estimates for these developments.
- March 4, 2025: President Trump imposed new tariffs on three of the country's largest trading partners: Canada, Mexico, and China.
- March 3, 2025: Added threatened lumber and agricultural tariffs to timeline.
- February 27, 2025: New estimates for the proposed 25 percent tariff on EU imports and the increase in tariff rates on China. The update also incorporates the latest version of Tax Foundation’s General Equilibrium Model and updates to our tariff modeling to reflect the latest tax and economic data and a refinement to our tariff noncompliance assumption.
- February 19, 2025: Updated to include details around the 2025 trade war timeline and provide analysis of Trump's auto, steel, and aluminum tariffs.
- February 13, 2025: Updated to include analysis of Trump's expanded steel and aluminum tariffs.
- February 11, 2025: Updated to include new revenue collection data for the Trump-Biden tariffs.
- February 10, 2025: We rearranged the tracker and added an estimate of the value of US exports targeted by China’s retaliatory tariffs.
- February 6, 2025: Updated to include the revenue effects of ending duty-free de minimis treatment of imports from China.
- February 4, 2025: Updated to include additional distributional and historical analysis.
- February 1, 2025: Updated to include the 10 percent tariff on Canadian energy resources.
- January 31, 2025: Updated to include additional analysis of the proposed 25 percent tariffs on Canada and Mexico that could begin February 1, 2025.
- January 23, 2025: Updated to separate out 25 percent tariffs on Canada and Mexico given recent threats that these tariffs could begin February 1, 2025.
- November 26, 2024: The update contains modeling of President-elect Trump’s proposed 25 percent tariffs on Canada and Mexico and 10 percent tariff on China.
- June 26, 2024: The update adds import data through 2023, new data on tariff collections, and updated model results for imposed, retaliatory, and proposed tariffs. The modeling updates reflect President Biden’s tariff increases and former President Trump’s tariff proposals. Nicolo Pastrone assisted with the research for this update.
- September 19, 2023: The update adds a new column to the “Imports Affected by U.S. Tariffs” table, reflecting import data for calendar year 2022, data updates for prior years, and tariff-rate quotas that took effect in 2022 for certain steel and aluminum imports.
- July 7, 2023: Tariffs on washing machines expired in February 2023 after an initial three-year period and a two-year extension. The Biden administration provided a two-year suspension of solar panel tariffs for four Southeast Asian nations beginning in 2022. The update adjusts the revenue and economic results for imposed tariffs.
- April 1, 2022: The Biden administration has reached deals to replace steel and aluminum tariffs with tariff rate quotas for the European Union and United Kingdom and steel tariffs with tariff-rate quotas for Japan. The deals also eliminate tariffs on derivative goods from the same jurisdictions and will bring an end to related retaliatory tariffs. The update adjusts revenue and economic estimates for imposed and retaliatory tariffs and adds a new table illustrating how import levels of affected goods have changed since 2017.
- October 19, 2021: Under President Biden, the U.S. will suspend tariffs on aircrafts and other goods from the E.U. under a five-year pause in the ongoing Boeing-Airbus dispute. We have reorganized the layout of the tracker.
- September 18, 2020: US to eliminate tariffs on $2.5 billion worth of Canadian aluminum that had been imposed on August 16, 2020, to avoid Canadian retaliatory tariffs.
- August 13, 2020: US to reimpose tariffs on $2.5 billion worth of Canadian aluminum on August 16, 2020, and Canada to impose retaliatory tariffs.
- February 14, 2020: US reduces tariffs on $120 billion of Chinese goods by half to 7.5% and China reduces tariffs on approximately $75 billion of US goods in half to 2.5% and 5%.
- December 16, 2019: US postpones indefinitely the scheduled tariff of 15% on $160 billion worth of goods from China and announces plans to decrease the 15% tariff on $120 billion worth of goods from China to 7.5% (date unknown, will be included in the model when the decrease takes effect). China took corresponding measures and canceled their schedule tariff increase.
- December 5, 2019: US concludes Section 301 investigation into France's Digital Services Tax, threatens tariffs on $2.4 billion French products. Our analysis now includes tariffs on solar panels and washing machines.
- October 18, 2019: US imposes 10% and 25% tariffs on $7.5 billion European Union goods under WTO ruling.
- October 15, 2019: US postpones scheduled tariff hike from 25% to 30% on $250 billion worth of goods from China.
- October 3, 2019: US announces 10% and 25% tariffs on $7.5 billion European Union goods under WTO ruling, with the authority to raise the tariffs to 100%.
- September 12, 2019: US delays tariff increase from 25% to 30% on $250 billion worth of Chinese goods from Oct. 1 until Oct. 15.
- August 26, 2019: US announces the 25% tariff on $250 billion of Chinese goods would increase to 30 percent, effective Oct. 1, after a comment period.
- August 23, 2019: China announces additional tariffs on $75 billion of U.S. imports, from 5-10%, and will resume tariffs on U.S. cars and car parts suspended earlier in 2019. Tariffs to begin Sept. 1 and end Dec. 15. U.S. announces 10% tariff on $300 billion of Chinese goods to increase to 15%, some beginning Sept. 1, others on Dec. 15.
- August 13, 2019: US announces 10% tariff on $300 billion of Chinese goods would be delayed from Sept. 1 until Dec. 15.
- August 1, 2019: US announces 10% tariff on $300 billion Chinese goods, to be levied on Sept. 1, lowered from the previously announced 25% on $325 billion.
- July 20, 2019: US confirms announced July 5 plans to impose tariffs on all Chinese imports, roughly $500 billion of goods, modeled as a 10% tariff.
- July 5, 2019: US again threatens additional tariffs on Chinese imports if China further retaliates, increasing threats from levies on $200 billion and another $200 billion to $200 billion and $300 billion.
- June 10, 2019: US “indefinitely suspended” previously announced tariffs against Mexican products, set to begin at a 5% rate in June and gradually rise to 25%.
- May 31, 2019: US threatens 5% tariff beginning June 10 on $346.5 billion of imports from Mexico until illegal immigration across the southern border stops. It would rise to 10% on July 1; 15% on Aug. 1; 20% on Sept. 1; and 25% on Oct. 1.
- May 22, 2019: US announces it will lift steel and aluminum tariffs on Canada and Mexico, and those nations will lift their retaliatory tariffs.
- May 10, 2019: US announces it will raise tariffs on $200 billion of imports from China from 10% to 25%, with threats to impose an additional 25% on $325 billion of goods.
- August 29, 2018: Tax Foundation separated our automobile tariff estimate to show auto imports from Canada, and made slight estimate adjustments to correct for rounding.
- August 16, 2018: US doubles the tariffs on steel and aluminum imports from Turkey, which responds by doubling its tariffs on 22 U.S. products.
- August 8, 2018: US threatens a 10% tariff on $200 billion of Chinese goods if China retaliates for the previous 10% tariff, and that would extend to an additional $200 billion of goods. This would amount to a $40 billion tax increase.
- August 1, 2018: US considers increasing the proposed 10% tariff to 25% on $200 billion of Chinese imports. That would be a $30 billion tax increase.
- July 20, 2018: US reaffirms plans to impose tariffs on all Chinese imports (roughly $500 billion).
- July 13, 2018: Russia will begin placing tariffs on U.S. goods, worth about $87.6 million. (Slight adjustments were made to our estimates to correct for rounding.)
- July 6, 2018: US announces readiness to target an additional $200 billion in Chinese imports, and an additional $300 billion after that—an increase of $100 billion from previous threats.
- June 28, 2018: Turkey will begin placing tariffs on U.S. goods, worth about $266.5 million.