Latest Updates
- Includes doubling of Section 232 steel and aluminum tariffs from 25 percent to 50 percent.
- Adds to the timeline the injunction issued by the US Court of International Trade that declared the IEEPA tariffs unconstitutional and shows the economic, revenue, and distributional impacts if the decision is upheld.
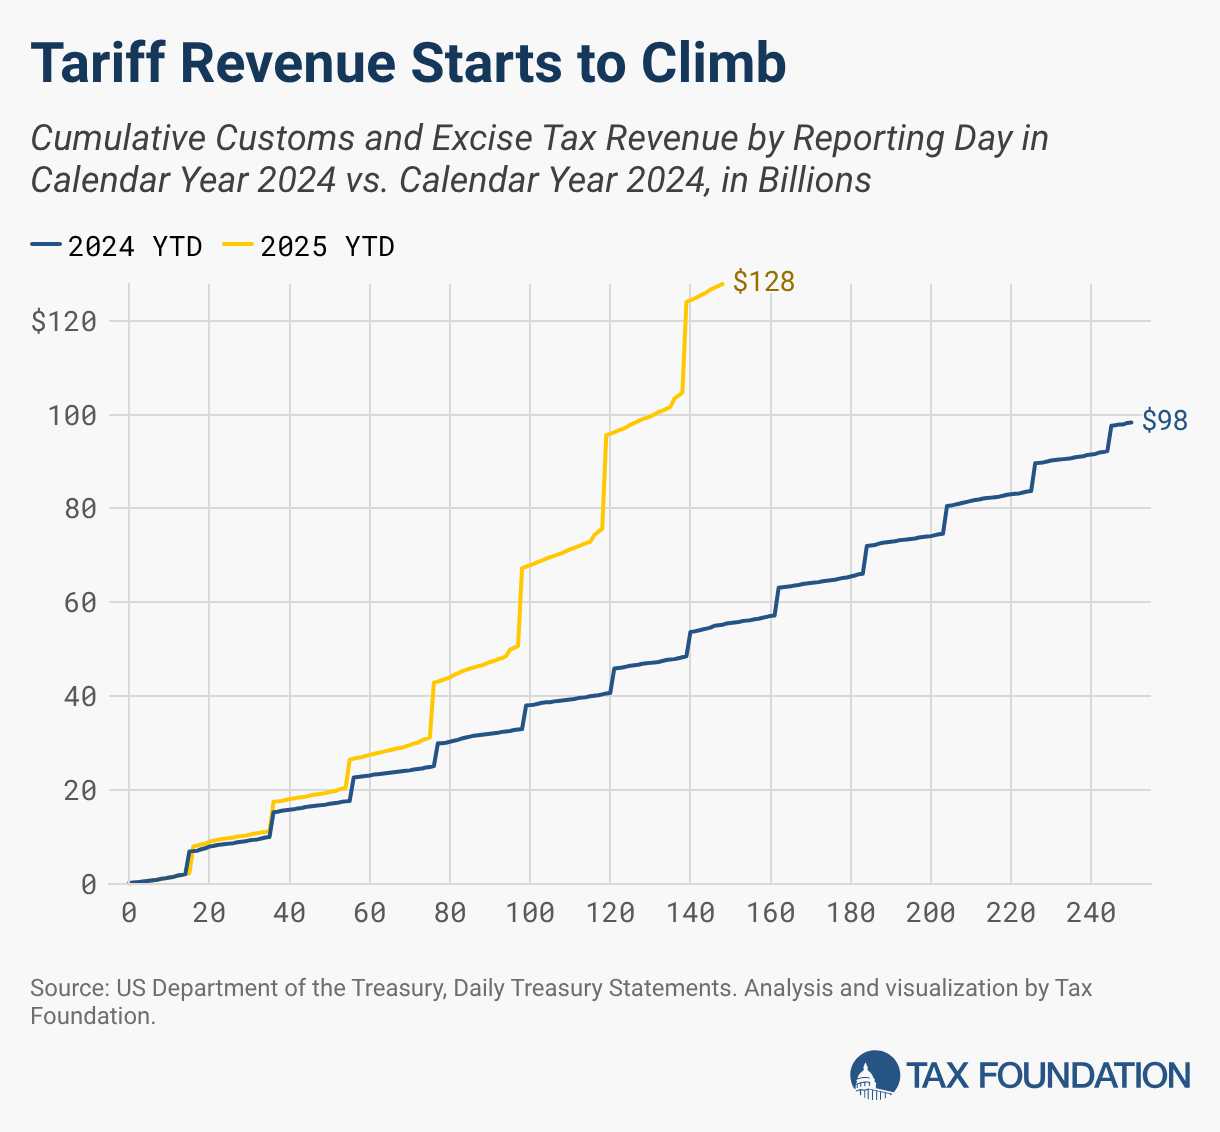
- Includes new chart showing daily deposits of tariff and certain excise tax payments in calendar year 2025 compared to calendar year 2024.
Key Findings
- President Trump has threatened to impose International Emergency Economic Powers Act (IEEPA) tariffs on Canada, Mexico, and China related to fentanyl; national security tariffs on autos, auto parts, steel, and aluminum from all countries; and IEEPA tariffs on all countries related to an economic national emergency at a baseline rate of 10 percent with scheduled increases for more than 50 trading partners later in 2025. The US Court of International Trade ruled in May 2025 that the IEEPA tariffs are illegal.
- Under all the imposed tariffs, the weighted average applied tariffTariffs are taxes imposed by one country on goods imported from another country. Tariffs are trade barriers that raise prices, reduce available quantities of goods and services for US businesses and consumers, and create an economic burden on foreign exporters. rate on all imports would rise to 16.1 percent, and the average effective tariff rate, reflecting how much tariff revenue the new tariffs would raise after incorporating behavioral responses, would rise to 12.4 percent under the current tariffs—the highest average rate since 1941. However, if the IEEPA tariffs are permanently enjoined, the applied tariff rate would rise by a smaller amount, to 6.2 percent, and the effective tariff rate to 4.7 percent, the highest since 1973.
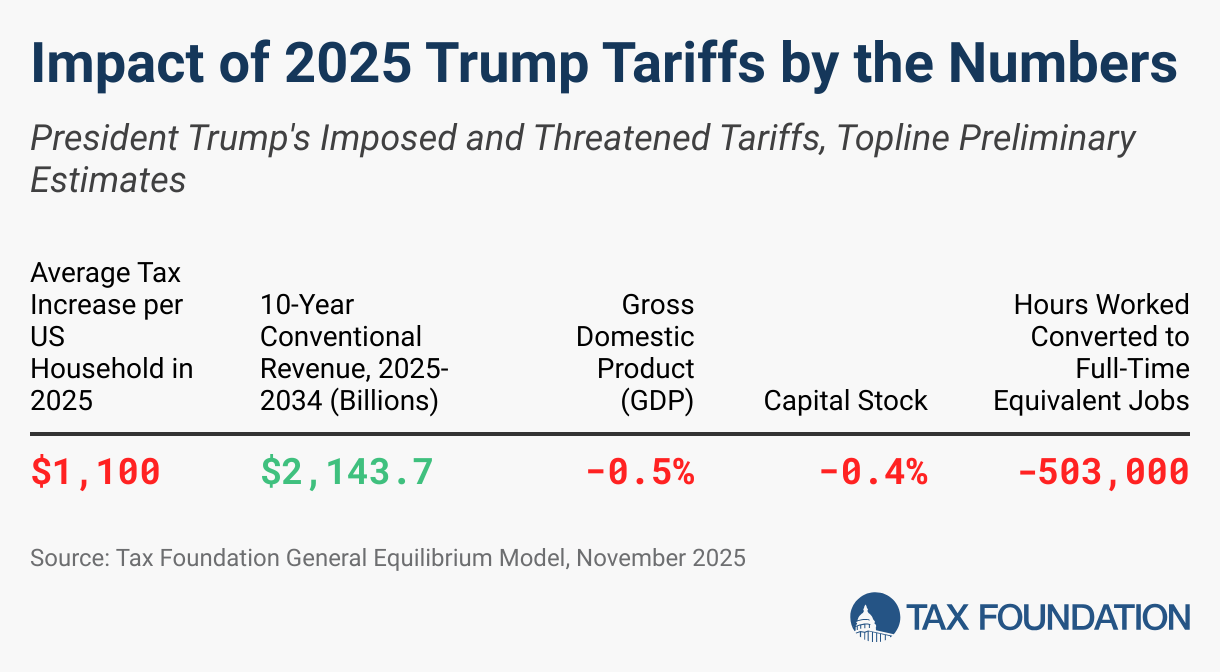
- Altogether, Trump’s imposed tariffs would raise $2.0 trillion in revenue over the next decade on a conventional basis ($1.4 trillion on a dynamic basis) and reduce US GDP by 0.8 percent, all before foreign retaliation. However, if the IEEPA tariffs are permanently enjoined, it would reduce the total revenue raised by Trump’s tariffs by $1.4 trillion to $603 billion over 10 years and reduce the negative GDP effect to 0.2 percent.
- In total, the imposed tariffs would reduce market income by 1.1 percent in 2026 (0.9 percent from the IEEPA tariffs and 0.3 percent from the other tariffs, totals don’t sum due to rounding) and amount to an average taxA tax is a mandatory payment or charge collected by local, state, and national governments from individuals or businesses to cover the costs of general government services, goods, and activities. increase per US household of $1,183 in 2025 and $1,445 in 2026. However, if the IEEPA tariffs are permanently enjoined, the tax increases would be smaller at $303 in 2025 and $406 in 2026. Our estimates of reductions in market income understate the totality of effects Americans will face, as they exclude the loss of choice and higher prices for substitute goods.
- As of April 4, China, Canada, and the European Union have announced or imposed retaliatory tariffs altogether affecting $330 billion of US exports. Imposed and threatened retaliation as of April 10 will reduce US GDP by another 0.2 percent and 10-year revenue by $132 billion on a dynamic basis.
- In 2025, Trump’s imposed and scheduled tariffs will increase federal tax revenues by $156.4 billion, or 0.51 percent of GDP, making the tariffs the largest tax hike since 1993. The tariffs are larger than the tax increases enacted under President Barack Obama and President Geroge H.W. Bush. If the IEEPA tariffs are permanently enjoined, federal tax revenues would rise by $40.0 billion in 2025, or 0.13 percent of GDP, making the tariffs fall outside of the top 20 tax increases since 1940.
- The first Trump administration-imposed tariffs on thousands of products valued at approximately $380 billion in 2018 and 2019, affecting approximately 15 percent of US goods imports.
- The second Trump administration tariffs threaten all United States imports excluding a few categories: USMCA trade (valued at $405 billion of imports in 2024) and certain energy-related and other imports under the April 2 tariffs (valued at $644 billion of imports in 2024, or $459 billion excluding Canada and Mexico). Based on 2024 import values, the tariffs affect approximately $2.3 trillion of US goods imports, or 71 percent of US goods imports. However, if the IEEPA tariffs are permanently enjoined, the remaining new tariffs would affect more than $500 billion, or 16 percent, of goods imports.
2025 Trump Tariffs Timeline
President Trump signed an executive order on January 20, 2025, instructing certain cabinet secretaries to develop reports on trade practices and recommendations for tariffs due by April 1, 2025. Since then, several new tariffs and tariff investigations have been threatened, initiated, and/or imposed, and at least two court rulings have found several of the tariff executive orders illegal.
Country-Specific Tariffs:
- IEEPA Border Security and Fentanyl Tariffs: President Trump signed three executive orders on February 1, 2025, to impose 25 percent tariffs on Canada and Mexico and 10 percent tariffs on China using International Emergency Economic Powers Act (IEEPA) authority, to go into effect on February 4.
- China: The 10 percent tariffs on all imports from China took effect on February 4, 2025. On February 27, Trump said the tariffs on China would increase by another 10 percent beginning March 4, which has taken effect.
- Canada: The tariffs on Canada received a 30-day suspension and took effect March 4. On March 5, the president exempted auto imports from the tariffs until April 2, and on March 6 the president exempted imports covered by the USMCA trade deal (approximately 38 percent of imports from Canada) until April 2 while lowering the tariff on non-USMCA potash (a fertilizer used in farming) to 10 percent. On April 2, the exemption was extended indefinitely. On March 11, the president said the 25 percent rate on steel and aluminum would double to 50 percent in response to Canada’s retaliation, but later in the day walked back the doubling.
- Mexico: The tariffs on Mexico received a 30-day suspension and took effect on March 4. On March 5, the president exempted auto imports from the tariffs until April 2, and on March 6 the president exempted imports covered by the USMCA trade deal (approximately 49 percent of imports from Mexico) until April 2. On April 2, the exemption was extended indefinitely.
- On May 28, a panel of judges at the US International Court of Trade unanimously ruled that the IEEPA tariffs were illegal. The Trump administration immediately filed an appeal. The ruling provided the president up to 10 days to begin the process of halting collections of the IEEPA tariffs. The ruling would not apply to the Section 232 and 301 tariffs that are currently in place. Importers that paid tariffs under the IEEPA would be eligible for retroactive relief.
- IEEPA “Reciprocal” Tariffs: President Trump signed a presidential memorandum on February 13, 2025, to develop a plan for increasing US tariffs in response to other countries’ tariffs, tax policies, and any other policies including exchange rates and unfair practices. The recommendations are due April 1, 2025, and the president has indicated they will begin taking effect on April 2. The so-called reciprocal tariffs are applied to imports from nearly every US trading partner, but do not include goods that face product-specific tariffs like steel, aluminum, autos, and auto parts, and they also exclude a specific list of energy-related and other goods.
- On April 2, the president announced a universal tariff of 10 percent, with higher tariffs on trading partners, as high as 50 percent, depending on their trade balance with the United States.
- On April 7, in response to China’s retaliation, President Trump indicated another 50 percent tariff would apply to China beginning April 9, which was increased on April 9 to a total rate of 125 percent under the reciprocal tariffs. The rate on most imports from China is 145 percent when accounting for the IEEPA border security and fentanyl tariffs.
- The 10 percent universal tariff took effect April 5, and on April 9, President Trump announced a 90-day pause on the reciprocal tariffs for all other countries excluding China.
- On April 11, the Trump administration announced certain electronics would be exempt from the “reciprocal” tariffs.
- On May 8, the president announced the outlines of a trade deal with the UK, which would maintain the 10 percent “reciprocal” tariff, but lower the 25 percent auto tariff to 10 percent on the first 100,000 vehicle imports and eliminate the 25 percent steel and aluminum tariffs. In 2024, the US imported about 180,000 autos worth $10.5 billion and $1.8 billion of steel and aluminum from the UK in 2024. The effective date for changes has not been scheduled.
- On May 12, the Treasury Secretary announced a 90-day pause on escalations with China, reducing the 125 percent tariff to 10 percent.
- On May 23, President Trump announced he would be imposing a 50 percent reciprocal tariff on the EU beginning June 1. On May 25, he announced these tariffs would take effect July 9 instead.
- On May 28, a panel of judges at the US International Court of Trade unanimously ruled that the IEEPA tariffs were illegal. The Trump administration immediately filed an appeal. The ruling provided the president up to 10 days to begin the process of halting collections of the IEEPA tariffs. The ruling would not apply to the Section 232 and 301 tariffs that are currently in place. Importers that paid tariffs under the IEEPA would be eligible for retroactive relief.
- On May 29, a second federal court ruled against the IEEPA tariffs.
- Venezuelan Oil Tariffs: President Trump signed an executive order on March 24, 2025, to impose an additional 25 percent tariff on Venezuela and any countries that purchase oil and gas from Venezuela, which could become effective April 2.
- European Union: President Trump announced plans on February 26, 2025, to impose tariffs of 25 percent on imports from the European Union. The authority to impose these tariffs has not been specified. On April 2, President Trump specified the “reciprocal” tariff rate on imports from the EU would be 20 percent.
- Tariff Stacking: On April 29, 2025, the president signed an executive order to prevent certain tariffs from stacking; rather than add on, the executive order specifies a hierarchy for which tariffs apply. The top priority is auto tariffs, followed by IEEPA “fentanyl” tariffs on Canada and Mexico, followed by steel and aluminum tariffs.
Product-Specific Tariffs:
- Semiconductors and Pharmaceuticals: President Trump said on January 27, 2025, he would announce new tariffs on computer chips, semiconductors, and pharmaceuticals. On February 18 he announced the rates on semiconductors and pharmaceuticals would be “25 percent and higher.” The authority to impose these tariffs has not been specified.
- Steel and Aluminum: President Trump signed two proclamations on February 10, 2025, to expand the existing Section 232 tariffs on steel and aluminum. The orders end all existing exemptions for the tariffs, expand the list of derivative articles, and raise the tariff rate on aluminum from 10 percent to 25 percent. The changes took effect March 12, 2025. On May 30, 2025, President Trump announced the steel and aluminum tariffs would double to 50 percent beginning on June 4, 2025.
- Autos: President Trump announced on February 14, 2025, that he plans to impose tariffs on auto imports beginning on April 2, 2025. He said on February 18 the rate on autos would be “in the neighborhood of 25 percent” while the rates on semiconductors and pharmaceuticals would be “25 percent and higher.” On March 26, 2025, Trump signed a proclamation authorizing 25 percent tariffs on autos and certain auto parts under Section 232 to take effect April 3 for autos and before May 3 for auto parts. US-based content of certain imports from Canada and Mexico will be exempt.
- Copper: President Trump directed the Commerce Department on February 25, 2025, to begin a Section 232 national security investigation for copper imports; the findings of the report are due by November 22, 2025.
- Lumber: President Trump directed the Commerce Department on March 1, 2025, to begin a Section 232 national security investigation into timber, lumber, and derivative imports; the findings of the report are due by November 26, 2025.
- Agricultural Products: President Trump posted on March 3, 2025, that tariffs on “external” agricultural products would begin April 2, 2025.
- Apple: President Trump announced on May 23 that Apple would face additional 25 percent tariffs if it did not source its iPhone components from the US.
Retaliation:
-
- China
- IEEPA fentanyl retaliation: 10 percent and 15 percent tariffs on $13.9 billion of US exports (including ag equipment and oil) effective on February 10; 10 percent and 15 percent tariffs on $19.5 billion of US exports (including agricultural products) effective on March 10
- IEEPA universal retaliation: 34 percent tariffs on all $144 billion of US exports announced on April 4; on April 9, China increased its retaliation to 84 percent on all US exports; on April 11, China increased its retaliation to 125 percent on all US exports; on May 12, China reduced its retaliation to 10 percent on all US exports under a 90-day pause.
- Canada
- IEEPA fentanyl retaliation: 25 percent tariffs on $20.8 billion of US exports effective on March 4; 25 percent tariffs on $86.7 billion of US exports scheduled for March 23; planned 25 percent tax on electricity exports from Ontario to the US, currently suspended
- Section 232 steel and aluminum retaliation: 25 percent tariffs on $20.7 billion of US exports effective March 13
- Section 232 auto retaliation: 25 percent tariffs on $30.5 billion of US autos
- European Union
- Section 232 retaliation: Lift suspension of previous tariffs, with rates of up to 50 percent, affecting $8 billion of US exports scheduled for April 1 (including whiskey); expand tariffs to an additional $20 billion of US exports intially scheduled for April 13, but delayed for 90-days along with the US 90-day delay.
- China
Economic Effects of 2025 Trump Tariffs
President Trump has imposed and threatened a variety of tariffs. We model the following policies:
- A 20 percent tariffon all imports from China plus a 125 percent tariff on all imports from China excluding those subject to Section 232 tariffs or on the exclusion list (resulting in a 145 percent tariff on most imports from China). Ending de minimis treatment for all imports from China.
- A 25 percent tariffon all imports from Mexico in 2025, which we assume is reduced to 12 percent after 2025 under the April 2 tariffs. USMCA-compliant imports are exempt from the tariffs indefinitely.
- A 10 percent tariff on energy and potash imports in 2025 plus a 25 percent tariff on all remaining imports from Canada in 2025. After 2025, we assume the energy and potash tariffs end and the tariffs on all remaining imports from Canada are reduced to 12 percent under the April 2 tariffs. USMCA-compliant imports are exempt from the tariffs indefinitely. Excluding USMCA trade, tariffs will apply to $256 billion of Canadian imports based on 2024 trade data.
- A 10 percent baseline tariff on all countries from April through June of 2025, exempting Section 232 goods, Annex II goods, and specified electronics.
- A range of “reciprocal” tariffs on most US trading partners, exempting Section 232 goods, Annex II goods, and specified electronics. Excluding the EU, China, Canada, and Mexico, the so-called reciprocal tariffs on the rest of the world result in a trade-weighted average tariff rate of 25 percent. We currently exclude the changes under the US-UK trade deal as they have not been given an effective date.
- Expansions to the Section 232 steel and aluminum tariffs, including ending country exemptions, raising the rate to 50 percent, expanding steel and aluminum products covered. We do not model the expanded derivatives list due to data limitations.
- Ending the country exemptions for the existing steel and steel derivatives tariffs, which increases imports subject to the tariffs from $5.5 billion to $34.6 billion (excluding interactions with tariff rate quotas)
- Ending the country exemptions for the existing aluminum and aluminum derivatives tariffs, which increases imports subject to the tariffs from $6.1 billion to $18.5 billion (excluding interactions with tariff rate quotas)
- Increasing the tariff rate on aluminum and aluminum derivatives from 10 percent to 50 percent
- Increasing the covered products, excluding the full derivatives list due to data limitations
- Excluding the changes under the US-UK trade deal as they have not been given an effective date
- A 25 percent tariff on all autos and certain auto parts, excluding US content of imports from Canada and Mexico. We illustrate the effects of this policy with 25 percent tariffs on all auto and auto parts specified in the Federal Register excluding USMCA trade. We currently exclude the changes under the US-UK trade deal as they have not been given an effective date.
- Retaliation announced as of April 10.
We estimate that before accounting for any foreign retaliation, the Section 232 tariffs will reduce long-run US GDP by 0.2 percent. The IEPPA tariffs, including the scheduled “reciprocal” tariffs, would reduce GDP by an additional 0.6 percent if they are upheld by the courts.
As of April 10, threatened and imposed retaliatory tariffs affect $330 billion of US exports based on 2024 US import values; if fully imposed, we estimate they would reduce US GDP by 0.2 percent. Combined, the US-imposed tariffs and the threatened and imposed retaliatory tariffs reduce US GDP by 0.9 percent. Totals may not sum due to rounding.
Table 1. Estimated Impact of President Trump’s Proposed Tariffs
Long-Run GDP Capital Stock Pre-Tax Wages Hours Worked Converted to Full-Time Equivalent Jobs
Tariffs Excluding IEEPA -0.2% -0.1% 0.0% -156,000
Section 232 Steel and Aluminum Less than -0.05% Less than -0.05% 0.0% -36,000
Section 232 Autos and Auto Parts -0.1% -0.1% 0.0% -120,000
IEEPA Tariffs, Total -0.6% -0.5% 0.0% -570,000
IEEPA Fentanyl China -0.1% -0.1% 0.0% -104,000
IEEPA Mexico Less than -0.05% Less than -0.05% 0.0% -41,000
IEEPA Canada Less than -0.05% Less than -0.05% 0.0% -27,000
IEEPA 10% Baseline Tariff Excluding Canada and Mexico -0.2% -0.1% 0.0% -160,000
IEEPA "Reciprocal" Tariff Increases Excluding Canada and Mexico -0.3% -0.2% 0.0% -238,000
Imposed and Threatened Retaliation -0.2% -0.1% 0.0% -141,000
Source: Tax Foundation General Equilibrium Model, February 2025.
Revenue Effects of 2025 Trump Tariffs
If imposed on a permanent basis, the tariffs would increase tax revenue for the federal government. We model the imposed tariffs together, accounting for interactions between the different rounds of tariffs and timing of implementation. Revenue is lower on a dynamic basis, a reflection of the negative effect tariffs have on US economic output, reducing incomes and resulting tax revenues. Revenue would fall more when factoring in foreign retaliation, as retaliation would cause US output and incomes to shrink further.
On a conventional basis, before incorporating the negative effects of tariffs on the US economy, we estimate that the Section 232 tariffs would increase US federal tax revenue by $603 billion over the next decade. The IEEPA tariffs would raise an additional $1.4 trillion in revenue over the next decade. The IEEPA tariffs raise less in 2025 than in later years because they will not be in effect for the full calendar year. The 10 percent baseline tariffs, excluding Canada and Mexico, raise $726 billion in revenue from 2025 through 2034. The scheduled increase in so-called reciprocal tariffs would reduce revenue by $64 billion from 2025 through 2034; notably, the scheduled increases in the rate on imports from China to 125 percent and the EU to 50 percent lose revenue.
On a dynamic basis, incorporating the negative effects of the US-imposed tariffs on the US economy, we estimate that the Section 232 tariff would raise $469 billion over the next decade, about $134 billion less than the conventional estimate. The IEEPA tariffs would raise an additional $924 billion over the next decade, about $502 billion less than the conventional estimate. Incorporating the negative effects of imposed and threatened retaliatory tariffs as of April 9, 2025, further reduces 10-year revenue by $132 billion.
Table 2. Revenue Effects of President Trump’s Tariffs
| Conventional Revenue | 2025 | 2026 | 2027 | 2028 | 2029 | 2030 | 2031 | 2032 | 2033 | 2034 | 2025-2034 |
|---|---|---|---|---|---|---|---|---|---|---|---|
| Total Tariffs Currently in Effect, Excluding IEEPA | $40.0 | $53.7 | $56.1 | $58.0 | $59.9 | $62.0 | $64.4 | $67.0 | $69.5 | $72.1 | $602.9 |
| Section 232 Steel and Aluminum | $11.0 | $13.9 | $14.5 | $15.0 | $15.5 | $16.0 | $16.7 | $17.3 | $18.0 | $18.6 | $156.5 |
| Section 232 Autos and Auto Parts | $29.0 | $39.8 | $41.6 | $43.0 | $44.4 | $46.0 | $47.8 | $49.7 | $51.6 | $53.5 | $446.4 |
| Total Tariffs Ruled Illegal | $116.4 | $137.3 | $140.3 | $141.5 | $142.9 | $144.9 | $147.3 | $149.5 | $151.7 | $153.9 | $1,425.6 |
| IEEPA Fentanyl China | $37.9 | $39.0 | $40.8 | $42.2 | $43.6 | $45.1 | $46.8 | $48.7 | $50.5 | $52.4 | $447.0 |
| IEEPA Mexico (Fentanyl in 2025, Reciprocal Thereafter) | $13.9 | $17.0 | $17.7 | $18.3 | $18.9 | $19.6 | $20.4 | $21.1 | $22.0 | $22.8 | $191.7 |
| IEEPA Canada (Fentanyl in 2025, Reciprocal Thereafter) | $11.7 | $10.7 | $11.2 | $11.6 | $12.0 | $12.4 | $12.9 | $13.4 | $13.9 | $14.4 | $123.9 |
| IEEPA 10% Baseline Tariff Excluding Canada and Mexico | $51.8 | $69.8 | $71.7 | $72.5 | $73.4 | $74.6 | $76.1 | $77.5 | $78.9 | $80.3 | $726.7 |
| IEEPA "Reciprocal" Tariff Increases Excluding Canada and Mexico | $1.10 | $0.74 | -$1.03 | -$3.09 | -$4.90 | -$6.76 | -$8.87 | -$11.19 | -$13.59 | -$16.00 | -$63.60 |
| Total Conventional Revenue | $156.40 | $191.00 | $196.41 | $199.52 | $202.89 | $206.87 | $211.74 | $216.45 | $221.23 | $226.03 | $2,028.53 |
| Dynamic Revenue | |||||||||||
| Total Tariffs Currently in Effect, Excluding IEEPA | $29.0 | $42.1 | $43.7 | $45.4 | $46.6 | $48.6 | $50.6 | $52.3 | $54.5 | $56.4 | $469.2 |
| Section 232 Steel and Aluminum | $10.1 | $13.0 | $13.5 | $14.0 | $14.5 | $15.0 | $15.6 | $16.2 | $16.8 | $17.4 | $156.5 |
| Section 232 Autos and Auto Parts | $18.9 | $29.1 | $30.2 | $31.4 | $32.1 | $33.6 | $35.1 | $36.1 | $37.6 | $39.0 | $323.0 |
| Total Tariffs Ruled Illegal | $75.0 | $93.7 | $93.9 | $93.9 | $93.1 | $94.0 | $95.0 | $95.1 | $95.6 | $94.7 | $923.9 |
| IEEPA Fentanyl China | $29.1 | $29.7 | $30.9 | $32.0 | $32.8 | $34.3 | $35.7 | $37.0 | $38.5 | $39.9 | $339.9 |
| IEEPA Mexico (Fentanyl in 2025, Reciprocal Thereafter) | $13.8 | $16.8 | $17.6 | $18.2 | $18.8 | $19.5 | $20.3 | $21.0 | $21.9 | $22.7 | $190.6 |
| IEEPA Canada (Fentanyl in 2025, Reciprocal Thereafter) | $11.6 | $10.6 | $11.1 | $11.5 | $11.9 | $12.3 | $12.8 | $13.3 | $13.8 | $14.3 | $123.3 |
| IEEPA 10% Baseline Tariff Excluding Canada and Mexico | $37.9 | $55.2 | $56.2 | $56.5 | $56.8 | $57.7 | $58.6 | $59.2 | $60.1 | $60.4 | $558.6 |
| IEEPA "Reciprocal" Tariff Increases Excluding Canada and Mexico | -$17.4 | -$18.7 | -$21.9 | -$24.3 | -$27.2 | -$29.9 | -$32.4 | -$35.4 | -$38.7 | -$42.5 | -$288.4 |
| Total Dynamic Revenue | $103.9 | $135.8 | $137.6 | $139.3 | $139.7 | $142.5 | $145.7 | $147.3 | $150.0 | $151.2 | $1,393.1 |
| Dynamic Revenue with Threatened and Imposed Retaliation | $93.1 | $124.3 | $125.3 | $126.9 | $126.8 | $128.9 | $131.9 | $133.1 | $135.2 | $135.5 | $1,261.0 |
Distributional Effects of 2025 Trump Tariffs
In 2026, the Section 232 tariffs would reduce after-tax incomes by 0.3 percent on average, while the IEEPA tariffs would reduce after-tax incomes by 0.9 percent on average. The top 1 percent would see a smaller reduction in after-tax incomeAfter-tax income is the net amount of income available to invest, save, or consume after federal, state, and withholding taxes have been applied—your disposable income. Companies and, to a lesser extent, individuals, make economic decisions in light of how they can best maximize their earnings. . Per US household, the tariffs altogether would amount to an average tax increase of $1,183 in 2025 and $1,445 in 2026. However, if the IEEPA tariffs are permanently enjoined, the tax increases would be smaller at $303 in 2025 and $406 in 2026. Notably, these averages do not capture additional costs to US households stemming from higher-priced alternative goods and loss of consumer choice.
Table 3. Distributional Effects of President Trump's Tariffs
| AGI Percentile | Percent Change in After-Tax Income under Imposed Tariffs, 2026 | |
|---|---|---|
| Tariffs Currently in Effect, Excluding IEEPA | IEEPA Tariffs Ruled Illegal | |
| 0% - 20.0% | -0.3% | -0.9% |
| 20.0% - 40.0% | -0.3% | -0.9% |
| 40.0% - 60.0% | -0.3% | -0.9% |
| 60.0% - 80.0% | -0.3% | -0.9% |
| 80.0% - 100% | -0.3% | -0.8% |
| 80.0% - 90.0% | -0.3% | -0.9% |
| 90.0% - 95.0% | -0.3% | -0.9% |
| 95.0% - 99.0% | -0.3% | -0.9% |
| 99.0% - 100% | -0.3% | -0.7% |
| Total | -0.3% | -0.9% |
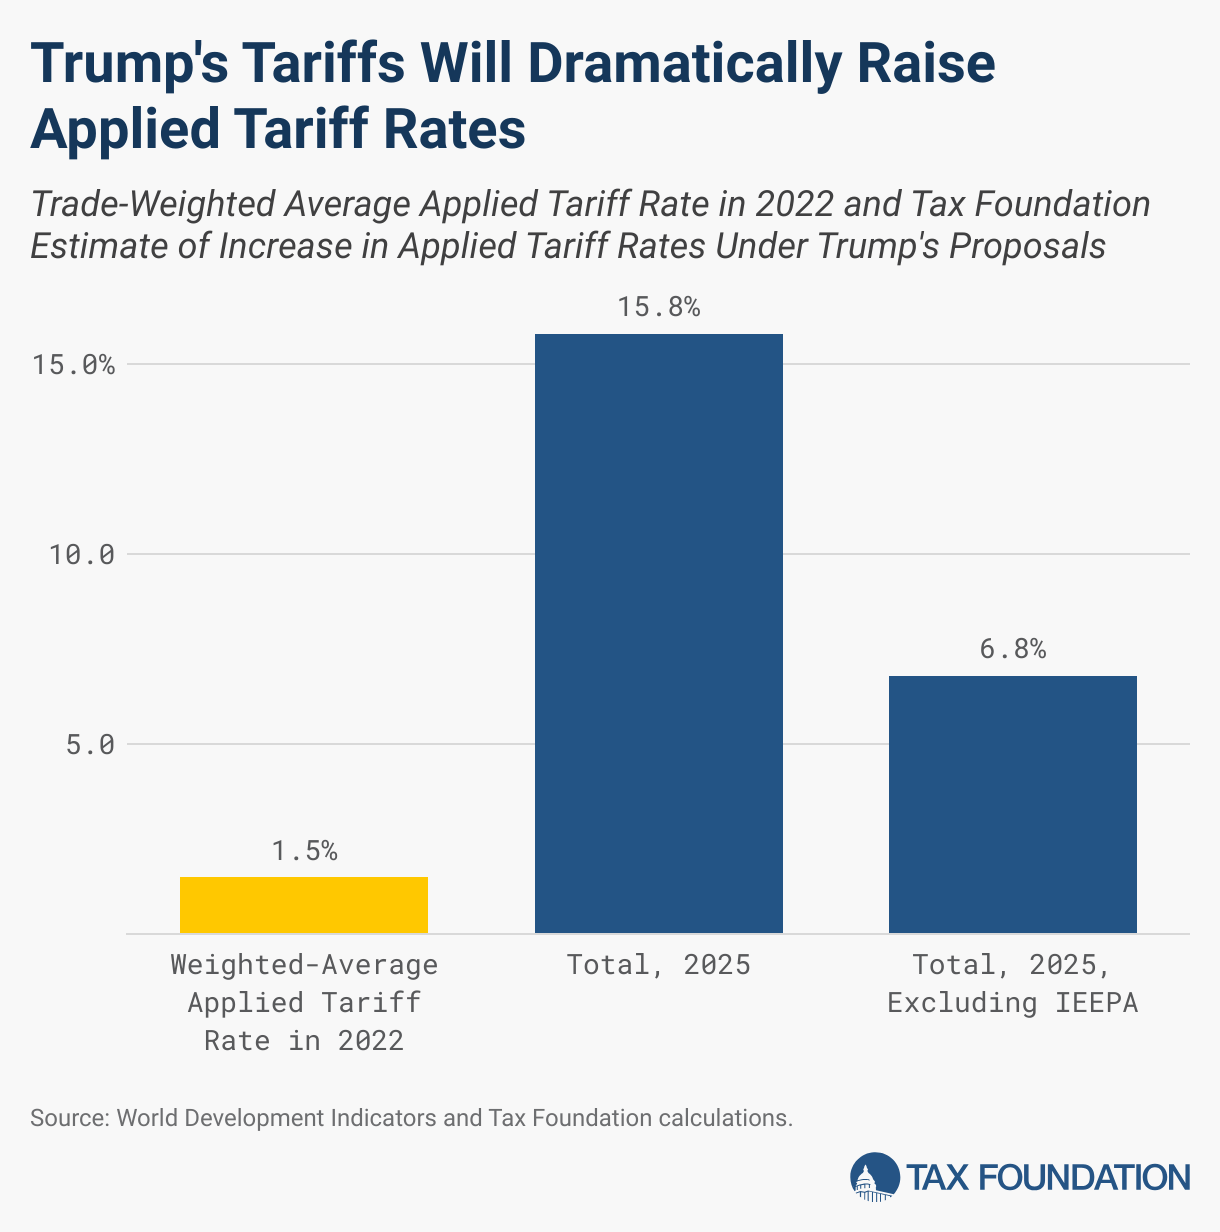
The new tariffs will significantly raise the tariff rates the US applies to most imports. According to the World Bank, the weighted average applied tariff was 1.5 percent in 2022. We estimate that under the tariffs currently imposed, it rises by 14.6 percentage points to 16.1 percent. However, if the IEEPA tariffs are permanently enjoined, it would rise by 4.7 percentage points to 6.2 percent. The weighted average applied tariff rate measures the rate imposed on different products from different countries, and it differs from averages measured by actual tariff revenues as a share of total goods imports.
We estimate the average effective tariff rate by estimating how tariff revenues as a share of total goods imports will change. On a static basis, without considering behavioral changes, such as a decrease in imports, we estimate the average effective tariff rate would rise to 14.5 percent. After incorporating behavioral responses, including our estimated drop in imports of about $560 billion (17 percent), we estimate the average effective tariff rate would rise to 12.4 percent—the highest rate since 1941. However, if the IEEPA tariffs are permanently enjoined, we estimate the average effective tariff rate would rise to 4.7 percent with behavioral adjustments—the highest rate since 1973.
In 2025, Trump’s tariffs will increase federal tax revenues by $156.4 billion, or 0.51 percent of GDP, making the tariffs the largest tax hike since 1993. The tariffs are larger than the tax increases enacted under Presidents Barack Obama and George H.W. Bush. However, if the IEEPA tariffs are permanently enjoined, the remaining tariffs would increase federal tax revenues by $40 billion in 2025, or 0.13 percent of GDP, falling outside of the top 20 tax increases since 1940.
Trump’s 2024 Campaign Proposals
Tariffs featured heavily in the 2024 presidential campaign as candidate Trump proposed a new 10 percent to 20 percent universal tariff on all imports, a 60 percent tariff on all imports from China, higher tariffs on EVs from China or across the board, 25 percent tariffs on Canada and Mexico, and 10 percent tariffs on China.
We estimate Trump’s proposed 20 percent universal tariffs and an additional 50 percent tariff on China to reach 60 percent would reduce long-run economic output by 1.3 percent before any foreign retaliation. They would increase federal tax revenues by $3.8 trillion ($3.1 trillion on a dynamic basis before retaliation) from 2025 through 2034.
2018-2019 Trade War: Economic Effects of Imposed and Retaliatory Tariffs
Using the Tax Foundation’s General Equilibrium Model, we estimate the Trump-Biden Section 301 and Section 232 tariffs will reduce long-run GDP by 0.2 percent, the capital stock by 0.1 percent, and hours worked by 142,000 full-time equivalent jobs. The reason tariffs have no impact on pre-tax wages in our estimates is that, in the long run, the capital stock shrinks in proportion to the reduction in hours worked, so that the capital-to-labor ratio, and thus the level of wages, remains unchanged. Removing the tariffs would boost GDP and employment, as Tax Foundation estimates have shown for the Section 232 steel and aluminum tariffs.
Table 4. Estimated Impact of US Imposed Tariffs
| 2018-2019 Trade War Tariffs | |
|---|---|
| GDP | -0.2% |
| Capital Stock | -0.1% |
| Pre-Tax Wages | 0.0% |
| Full-Time Equivalent (FTE) Jobs | -142,000 |
Source: Tax Foundation General Equilibrium Model, June 2024.
We estimate the retaliatory tariffs stemming from Section 232 and Section 301 actions total approximately $13.2 billion in tariff revenues. Retaliatory tariffs are imposed by foreign governments on their country’s importers. While they are not direct taxes on US exports, they raise the after-tax price of US goods in foreign jurisdictions, making them less competitively priced in foreign markets. We estimate the retaliatory tariffs will reduce US GDP and the capital stock by less than 0.05 percent and reduce full-time employment by 27,000 full-time equivalent jobs. Unlike the tariffs imposed by the United States, which raise federal revenue, tariffs imposed by foreign jurisdictions raise no revenue for the US but result in lower US output.
Table 5. Estimated Impact of US Retaliatory Tariffs
| 2018-2019 Retaliation | |
|---|---|
| GDP | Less than -0.05% |
| Capital Stock | Less than -0.05% |
| Pre-Tax Wages | 0.0% |
| Full-Time Equivalent (FTE) Jobs | -27,000 |
Source: Tax Foundation General Equilibrium Model, June 2024.
Tariff Revenue Collections Under the Trump-Biden Tariffs
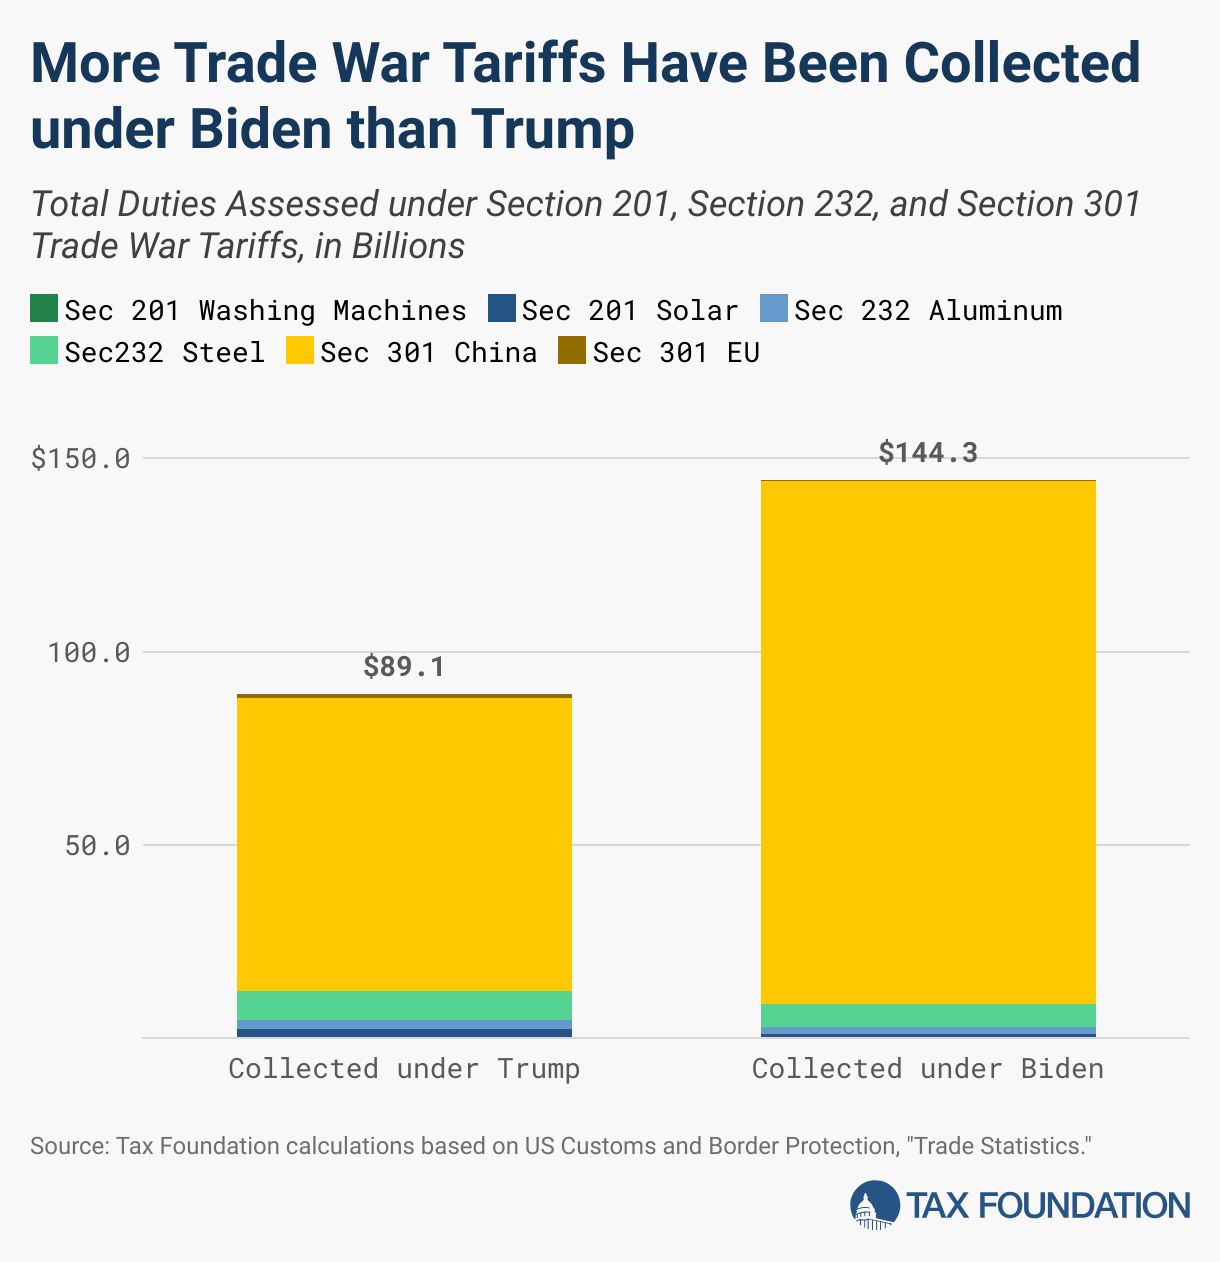
As of the end of 2024, the trade war tariffs have generated more than $264 billion of higher customs duties collected for the US government from US importers. Of that total, $89 billion, or about 34 percent, was collected during the Trump administration, while the remaining $175 billion, or about 64 percent, was collected during the Biden administration.
Before accounting for behavioral effects, the $79 billion in higher tariffs amount to an average annual tax increase on US households of $625. Based on actual revenue collections data, trade war tariffs have directly increased tax collections by $200 to $300 annually per US household, on average. The actual cost to households is higher than both the $600 estimate before behavioral effects and the $200 to $300 after, because neither accounts for lower incomes as tariffs shrink output, nor the loss in consumer choice as people switch to alternatives that do not face tariffs.

Historical Evidence: Tariffs Raise Prices and Reduce Economic Growth
Economists generally agree free trade increases the level of economic output and income, while conversely, trade barriers reduce economic output and income. Historical evidence shows tariffs raise prices and reduce available quantities of goods and services for US businesses and consumers, resulting in lower income, reduced employment, and lower economic output.
Tariffs could reduce US output through a few channels. One possibility is a tariff may be passed on to producers and consumers in the form of higher prices. Tariffs can raise the cost of parts and materials, which would raise the price of goods using those inputs and reduce private sector output. This would result in lower incomes for both owners of capital and workers. Similarly, higher consumer prices due to tariffs would reduce the after-tax value of both labor and capital income. Because higher prices would reduce the return to labor and capital, they would incentivize Americans to work and invest less, leading to lower output.
Alternatively, the US dollar may appreciate in response to tariffs, offsetting the potential price increase for US consumers. The more valuable dollar, however, would make it more difficult for exporters to sell their goods on the global market, resulting in lower revenues for exporters. This would also result in lower US output and incomes for both workers and owners of capital, reducing incentives for work and investment and leading to a smaller economy.
Many economists have evaluated the consequences of the trade war tariffs on the American economy, with results suggesting the tariffs have raised prices and lowered economic output and employment since the start of the trade war in 2018.
- A February 2018 analysis by economists Kadee Russ and Lydia Cox found that steel‐consuming jobs outnumber steel‐producing jobs 80 to 1, indicating greater job losses from steel tariffs than job gains.
- A March 2018 Chicago Booth survey of 43 economic experts revealed that 0 percent thought a US tariff on steel and aluminum would improve Americans’ welfare.
- An August 2018 analysis from economists at the Federal Reserve Bank of New York warned the Trump administration’s intent to use tariffs to narrow the trade deficit would reduce imports and US exports, resulting in little to no change in the trade deficit.
- A March 2019 National Bureau of Economic Research study conducted by Pablo D. Fajgelbaum and others found that the trade war tariffs did not lower the before-duties import prices of Chinese goods, resulting in US importers taking on the entire burden of import duties in the form of higher after-duty prices.
- An April 2019 University of Chicago study conducted by Aaron Flaaen, Ali Hortacsu, and Felix Tintelnot found that after the Trump administration imposed tariffs on washing machines, washer prices increased by $86 per unit and dryer prices increased by $92 per unit, due to package deals, ultimately resulting in an aggregate increase in consumer costs of over $1.5 billion.
- An April 2019 research publication from the International Monetary Fund used a range of general equilibrium models to estimate the effects of a 25 percent increase in tariffs on all trade between China and the US, and each model estimated that the higher tariffs would bring both countries significant economic losses.
- An October 2019 study by Alberto Cavallo and coauthors found tariffs on imports from China were almost fully passed through to US import prices but only partially to retail consumers, implying some businesses absorbed the higher tariffs, reducing retail margins, instead of passing them on to retail consumers.
- In December 2019, Federal Reserve economists Aaron Flaaen and Justin Pierce found a net decrease in manufacturing employment due to the tariffs, suggesting that the benefit of increased production in protected industries was outweighed by the consequences of rising input costs and retaliatory tariffs.
- A February 2020 paper from economists Kyle Handley, Fariha Kamal, and Ryan Monarch estimated the 2018–2019 import tariffs were equivalent to a 2 percent tariff on all US exports.
- A December 2021 review of the data and methods used to estimate the trade war effects through 2021, by Pablo Fajgelbaum and Amit Khandelwal, concluded that “US consumers of imported goods have borne the brunt of the tariffs through higher prices, and that the trade war has lowered aggregate real income in both the US and China, although not by large magnitudes relative to GDP.”
- A January 2022 study from the US Department of Agriculture estimated the direct export losses from the retaliatory tariffs totaled $27 billion from 2018 through the end of 2019.
- A May 2023 United States International Trade Commission report from Peter Herman and others found evidence for near complete pass-through of the steel, aluminum, and Chinese tariffs to US prices. It also found an estimated $2.8 billion production increase in industries protected by the steel and aluminum tariffs was met with a $3.4 billion production decrease in downstream industries affected by higher input prices.
- A January 2024 International Monetary Fund paper found that unexpected tariff shocks tend to reduce imports more than exports, leading to slight decreases in the trade deficit at the expense of persistent gross domestic product losses—for example, the study estimates reversing the 2018–2019 tariffs would increase US output by 4 percent over three years.
- A January 2024 study by David Autor and others concludes that the 2018–2019 tariffs failed to provide economic help to the heartland: import tariffs had “neither a sizable nor significant effect on US employment in regions with newly‐protected sectors” and foreign retaliation “by contrast had clear negative employment impacts, particularly in agriculture.”
2018-2019 Trump Trade War Timeline
The Trump administration imposed several rounds of tariffs on steel, aluminum, washing machines, solar panels, and goods from China, affecting more than $380 billion worth of trade at the time of implementation and amounting to a tax increase of nearly $80 billion. The Biden administration maintained most tariffs, except for the suspension of certain tariffs on imports from the European Union, the replacement of tariffs with tariff-rate quotas (TRQs) on steel and aluminum from the European Union and United Kingdom and imports of steel from Japan, and the expiration of the tariffs on washing machines after a two-year extension. In May 2024, the Biden administration announced additional tariffs on $18 billion of Chinese goods for a tax increase of $3.6 billion.
Altogether, the trade war policies currently in place add up to $79 billion in tariffs based on trade levels at the time of tariff implementation. Note the total revenue generated will be less than our static estimate because tariffs reduce the volume of imports and are subject to evasion and avoidance (which directly lowers tariff revenues) and they reduce real income (which lowers other tax revenues).
Section 232, Steel and Aluminum
In March 2018, President Trump announced the administration would impose a 25 percent tariff on imported steel and a 10 percent tariff on imported aluminum. The value of imported steel totaled $29.4 billion, and the value of imported aluminum totaled $17.6 billion in 2018. Based on 2018 levels, the steel tariffs would have amounted to $9 billion and the aluminum tariffs to $1.8 billion. Several countries, however, have been excluded from the tariffs.
In early 2018, the US reached agreements to permanently exclude Australia from steel and aluminum tariffs, use quotas for steel imports from Brazil and South Korea, and use quotas for steel and aluminum imports from Argentina.
In May 2019, President Trump announced that the US was lifting tariffs on steel and aluminum from Canada and Mexico.
In 2020, President Trump expanded the scope of steel and aluminum tariffs to cover certain derivative products, totaling approximately $0.8 billion based on 2018 import levels.
In August 2020, President Trump announced that the US was reimposing tariffs on aluminum imports from Canada. The US imported approximately $2.5 billion worth of non-alloyed unwrought aluminum, resulting in a $0.25 billion tax increase. About a month later, the US eliminated the 10 percent tariff on Canadian aluminum that had just been reimposed.
In 2021 and 2022, the Biden administration reached deals to replace certain steel and aluminum tariffs with tariff rate quota systems, whereby certain levels of imports will not face tariffs, but imports above the thresholds will. TRQs for the European Union took effect on January 1, 2022; TRQs for Japan took effect on April 1, 2022; and TRQs for the UK took effect on June 1, 2022. Though the agreements on steel and aluminum tariffs will reduce the cost of tariffs paid by some US businesses, a quota system similarly leads to higher prices, and further, retaining tariffs at the margin continues the negative economic impact of the previous tariff policy.
Tariffs on steel, aluminum, and derivative goods currently account for $2.7 billion of the $79 billion in tariffs, based on initial import values. Current retaliation against Section 232 steel and aluminum tariffs targets more than $6 billion worth of American products for an estimated total tax of approximately $1.6 billion.
Section 301, Chinese Products
Under the Trump administration, the United States Trade Representative began an investigation of China in August 2017, which culminated in a March 2018 report that found China was conducting unfair trade practices.
In March 2018, President Trump announced tariffs on up to $60 billion of imports from China. The administration soon published a list of about $50 billion worth of Chinese products to be subject to a new 25 percent tariff. The first tariffs began July 6, 2018, on $34 billion worth of Chinese imports, while tariffs on the remaining $16 billion went into effect August 23, 2018. These tariffs amount to a $12.5 billion tax increase.
In September 2018, the Trump administration imposed another round of Section 301 tariffs—10 percent on $200 billion worth of goods from China, amounting to a $20 billion tax increase.
In May 2019, the 10 percent tariffs increased to 25 percent, amounting to a $30 billion increase. That increase had been scheduled to take effect beginning in January 2019, but was delayed.
In August 2019, the Trump administration announced plans to impose a 10 percent tariff on approximately $300 billion worth of additional Chinese goods beginning on September 1, 2019, but soon followed with an announcement of schedule changes and certain exemptions.
In August 2019, the Trump administration decided that 4a tariffs would be 15 percent rather than the previously announced 10 percent, a $5.6 billion tax increase.
In September 2019, the Trump administration imposed “List 4a,” a 15 percent tariff on $112 billion of imports, an $11 billion tax increase. They announced plans for tariffs on the remaining $160 billion to take effect on December 15, 2019.
In December 2019, the administration reached a “Phase One” trade deal with China and agreed to postpone indefinitely the stage 4b tariffs of 15 percent on approximately $160 billion worth of goods that were scheduled to take effect December 15 and to reduce the stage 4a tariffs from 15 percent to 7.5 percent in January 2020, reducing tariff revenues by $8.4 billion.
In May 2024, the Biden administration published its required statutory review of the Section 301 tariffs, deciding to retain them and impose higher rates on $18 billion worth of goods. The new tariff rates range from 25 to 100 percent on semiconductors, steel and aluminum products, electric vehicles, batteries and battery parts, natural graphite and other critical materials, medical goods, magnets, cranes, and solar cells. Some of the tariff increases go into effect immediately, while others are scheduled for 2025 or 2026. Based on 2023 import values, the increases will add $3.6 billion in new taxes.
Section 301 tariffs on China currently account for $77 billion of the $79 billion in tariffs, based on initial import values. China has responded to the United States’ Section 301 tariffs with several rounds of tariffs on more than $106 billion worth of US goods, for an estimated tax of nearly $11.6 billion.
WTO Dispute, European Union
In October 2019, the United States won a nearly 15-year-long World Trade Organization (WTO) dispute against the European Union. The WTO ruling authorized the United States to impose tariffs of up to 100 percent on $7.5 billion worth of EU goods. Beginning October 18, 2019, tariffs of 10 percent were to be applied on aircraft and 25 percent on agricultural and other products.
In summer 2021, the Biden administration reached an agreement to suspend the tariffs on the European Union for five years.
Section 201, Solar Panels and Washing Machines
In January 2018, the Trump administration announced it would begin imposing tariffs on washing machine imports for three years and solar cell and module imports for four years as the result of a Section 201 investigation.
In 2021, the Trump administration extended the washing machine tariffs for two years through February 2023, and they have now expired.
In 2022, the Biden administration extended the solar panel tariffs for four years, though later provided temporary two-year exemptions for imports from four Southeast Asian nations beginning in 2022, which account for a significant share of solar panel imports.
In 2024, the Biden administration removed separate exemptions for bifacial solar panels from the Section 201 tariffs. Additionally, the temporary two-year exemptions expired and the Biden administration is further investigating solar panel imports from the four Southeast Asian nations for additional tariffs.
We estimate the solar cell and module tariffs amounted to a $0.2 billion tax increase based on 2018 import values and quantities, while the washing machine tariffs amounted to a $0.4 billion tax increase based on 2018 import values and quantities.
We exclude the tariffs from our tariff totals given the broad exemptions and small magnitudes.
Trade Volumes Since Tariffs Were Imposed
Since the tariffs were imposed, imports of affected goods have fallen, even before the onset of the COVID-19 pandemic. Some of the biggest drops are the result of decreased trade with China, as affected imports decreased significantly after the tariffs and still remain below their pre-trade war levels. Even though trade with China fell after the imposition of tariffs, it did not fundamentally alter the overall balance of trade, as the reduction in trade with China was diverted to increased trade with other countries.

Table 6. Imports Affected by US Tariffs
| Tariff and Effective Date | 2017 | 2018 | 2019 | 2020 | 2021 | 2022 | 2023 | Rate |
|---|---|---|---|---|---|---|---|---|
| Section 232 Steel (March 2018) | $15.90 | $15.50 | $11.40 | $7.10 | $13.50 | $9.50 | $5.50 | 25% |
| Section 232 Aluminum (March 2018) | $9.00 | $9.60 | $8.40 | $5.20 | $7.50 | $9.80 | $5.60 | 10% |
| Section 232 Derivative Steel Articles (February 2020) | $0.40 | $0.50 | $0.50 | $0.40 | $0.50 | $0.60 | $0.30 | 25% |
| Section 232 Derivative Aluminum Articles (February 2020) | $0.20 | $0.30 | $0.20 | $0.20 | $0.30 | $0.30 | $0.30 | 10% |
| Section 301, List 1 (July 2018) | $31.90 | $30.30 | $22.00 | $20.10 | $24.10 | $26.10 | $23.60 | 25% |
| Section 301, List 2 (August 2018) | $13.80 | $14.80 | $8.50 | $9.60 | $10.30 | $10.70 | $8.20 | 25% |
| Section 301, List 3 (September 2018, increased May 2019) | $159.20 | $181.30 | $120.00 | $107.10 | $119.60 | $111.80 | $86.50 | 10% in 2019, then 25% |
| Section 301, List 4A (September 2019, lowered January 2020) | $101.90 | $112.20 | $113.90 | $101.40 | $104.70 | $102.00 | $84.90 | 15% in 2019; then 7.5% |
| Biden Admin Section 301 Expansion (2024 to 2026) | $7.50 | $8.00 | $5.60 | $8.90 | $9.00 | $15.70 | $18.00 | 25% to 100% |
Source: Federal Register notices; Tom Lee and Jacqueline Varas, “The Total Cost of U.S. Tariffs,” American Action Forum, Mar. 24, 2022, https://www.americanactionforum.org/research/the-total-cost-of-tariffs/; data retrieved from USITC DataWeb.
Stay informed on the tax policies impacting you.
Subscribe to get insights from our trusted experts delivered straight to your inbox.
Subscribe