

Key Findings
- The cost of physical assets to achieve a net-zero[1] global economy by 2050 could be around €8.1 trillion ($9.2 trillion) per year—an increase of €3.1 trillion ($3.5 trillion)[2] compared to current spending on capital investment.
- One estimate suggests that the EU will need around €22 trillion of investment from the private sector between 2021-2050 to achieve the goals of the green transition.
- The EU’s Net-Zero Industry Act alone will require between €42-96 billion of private investment between 2023-2030 to boost EU manufacturing capacity.
- A Member State’s corporate taxA tax is a mandatory payment or charge collected by local, state, and national governments from individuals or businesses to cover the costs of general government services, goods, and activities. rate, corporate tax baseThe tax base is the total amount of income, property, assets, consumption, transactions, or other economic activity subject to taxation by a tax authority. A narrow tax base is non-neutral and inefficient. A broad tax base reduces tax administration costs and allows more revenue to be raised at lower rates. , and capital allowances policy significantly impact marginal investment decisions.
- Thirteen Member States have special tax policies targeted at increasing green investment.
- Rather than using narrow policies to promote specific investments, Member States should adopt full expensingFull expensing allows businesses to immediately deduct the full cost of certain investments in new or improved technology, equipment, or buildings. It alleviates a bias in the tax code and incentivizes companies to invest more, which, in the long run, raises worker productivity, boosts wages, and creates more jobs. to allow businesses to deduct the full cost of a capital investment in the year of acquisition rather than following a multiyear depreciationDepreciation is a measurement of the “useful life” of a business asset, such as machinery or a factory, to determine the multiyear period over which the cost of that asset can be deducted from taxable income. Instead of allowing businesses to deduct the cost of investments immediately (i.e., full expensing), depreciation requires deductions to be taken over time, reducing their value and discouraging investment. schedule or complying with narrow definitions of preferred investments.[3]
Table of Contents
- Introduction
- The Cost of the EU’s Green Transition
- The Role of Public and Private Investment
- Impact of Tax Policy on General Capital Stock Investment
- Impact of EU Policies on General Capital Stock Investment
- Inventory of Capital Allowances for Green Investment in the EU
- Pro-Growth Tax Policy Recommendations to Mobilize Private Investment
- Conclusion
Introduction
Globally, climate policies to reduce carbon emissions and limit the negative effects of climate change are becoming a priority for governments. Specifically, signatories of the 2015 Paris Agreement aim to keep global warming to well below 2°C and are pursuing efforts to limit it to 1.5°C.[4]
While many policy pathways exist to reduce these emissions, more than 70 countries, including the biggest polluters—China and the United States—have set a net-zero target, covering about 76 percent of global emissions.[5] To achieve this by 2050, one estimate suggests the cost of necessary physical assets to support a greener economy could be around €8.1 trillion per year. This would be an increase of €3.1 trillion above current investment levels.[6]
For its part, the European Union’s green transition follows targets set by the Paris Agreement. Outlined in the European Green Deal, primarily implemented through the Fit for 55 package, and legally enshrined in the European Climate Law, the transition aims to achieve EU climate neutrality by 2050. Protecting the planet is no longer a debate for European policymakers, it is a legal obligation.
The EU will therefore need both public and private investment to “green” the existing physical capital stock, build new energy infrastructure, and manage the societal changes associated with shifting market dynamics. While political leaders have recently come to acknowledge[7] the importance of private investment to achieve the green transition’s goals, much of the policy debate in Brussels has focused on EU spending programs and harmful subsidies.[8] In other words, governments at the EU and Member State levels are exploring ways to spend money to “boost competitiveness.”[9]
However, this focus on public spending distracts from a larger issue. Proxy estimates suggest that only about 17 to 20 percent of the needed investment will come from public spending.[10] Some argue the public-private ratio may be closer to 1:4 with some variation between eastern and western Europe.[11] Even without a precise number, most policymakers believe a “lion’s share” of the investment must come from the private sector.[12]
This raises three important questions for policymakers to consider:
- How much will the green transition ultimately cost?
- How much of this investment cost will be borne by taxpayers?
- What are the most efficient and neutral tax policies to drive enough private sector investment before 2050?
Given the environmental need to reduce carbon emissions amidst geopolitical competition, time is of the essence. A “socially just and environmentally sustainable transition” does not only refer to who pays for government spending programs or what amount of financial relief a household will receive for higher energy bills.[13] It is also about what happens if the allocation of private investment fails to materialize because, simply put, this will mean that policies stood in the way of private sector investments necessary to achieve the transition.
Consider how fair it would be for those citizens most negatively affected by climate change or higher energy costs to suffer because policymakers spent too much time on government spending programs and ignored the role of tax policy in driving the transition’s private investment and innovation needs. If climate change is the existential threat that policymakers believe it to be, then governments should be using every weapon in their arsenal to meet the green transition’s targets.
Therefore, it is critical that policymakers stop limiting economic growth with the tax code and start making investing in net-zero capital stock as frictionless as possible.
This report focuses on these questions with the goal of educating European policymakers on how principled, pro-growth tax policy can help achieve the targets of the green transition. We do so by analyzing cost estimates of the transition, considering the role of public and private investment, and comparing principled tax policy options to special green tax policies already in place across EU Member States.
Tax policy is just one tool, however, and the activation of private investment through the completion of the capital markets union will be vital as well.
The Cost of the EU’s Green Transition
What Is Green Transition Spending?
One of the most important questions about the green transition is still unknown: how much will it cost? Naturally, the answer is important for governments and firms to decide how to allocate resources and for markets to set expectations. However, the final cost is difficult to calculate for multiple reasons.
First, there is no standard definition of what encompasses “green transition” spending. Some policymakers only consider spending on physical capital to achieve carbon emissions reduction as transition spending. Others take a more holistic approach to include society-wide costs due to changes in the economy caused by the transition. Even using the Commission’s Green Deal goal of a “a socially just and environmentally sustainable transition,” there remains much ambiguity as to what exactly is included. For example, the cost of a new machine used for renewable energy generation could be considered transition spending, but is the cost of training the plant’s workers on how to use the machine? Or if a household is negatively impacted by increasing energy prices due to the transition, what level of financial support should governments provide to reduce the burden?
Second, inflationInflation is when the general price of goods and services increases across the economy, reducing the purchasing power of a currency and the value of certain assets. The same paycheck covers less goods, services, and bills. It is sometimes referred to as a “hidden tax,” as it leaves taxpayers less well-off due to higher costs and “bracket creep,” while increasing the government’s spending power. and the cost of capital are difficult to predict over a 30-year time horizon. The rate of inflation, and consequentially an investor’s real rate of return on an investment, will significantly impact the final cost of the transition. Inflation will also have a distributional effect as it is not consistent across all EU Member States.
Third, it is not obvious how many new machines or plants will be required to achieve the EU’s climate goals. The cost of new equipment will determine whether it is more cost-effective for governments and firms to invest in new physical capital or update the existing capital stock. In this vein, it is important for policymakers to avoid falling for the broken window fallacy,[14] and set policy that allows private firms to make improvements to existing physical capital when it is efficient to do so. Over time, physical capital needs may vary due to changes in efficiency or technological development, and this is something the government should neither seek to control nor dictate through narrow tax policy preferences.
The Capital Stock in European Union Member States
To this end, it is important to examine a country’s capital stock[15] because it is a broad measure of existing capital (physical tools, plants, and equipment) in the economy.[16] Table 1 below shows the annual capital stock growth rate in all EU Member States and the electricity sector growth rate specifically in most EU Member States from 2010 to 2019.
| Country | Total Growth (%) | Electricity Growth (%) | |
|---|---|---|---|
| Belgium | 0.11 | -3.42 | |
| Bulgaria | 1.61 | NA | |
| Czechia | 0.22 | -3.37 | |
| Denmark | 0.39 | -1.18 | |
| Germany (until 1990 former territory of tde FRG) | 0.83 | 0.49 | |
| Estonia | 0.23 | -5.30 | |
| Ireland | -2.45 | 1.30 | |
| Greece | 0.36 | 0.12 | |
| Spain | 0.26 | -2.97 | |
| France | 0.64 | -2.31 | |
| Croatia | -1.01 | NA | |
| Italy | 0.22 | 0.68 | |
| Cyprus | 0.37 | NA | |
| Latvia | 2.75 | -5.72 | |
| Litduania | 1.27 | -5.84 | |
| Luxembourg | -0.84 | 2.67 | |
| Hungary | 1.81 | 0.45 | |
| Malta | 3.23 | NA | |
| Netherlands | 0.41 | -1.59 | |
| Austria | 0.13 | -1.72 | |
| Poland | 0.05 | 0.85 | |
| Portugal | 1.23 | NA | |
| Romania | 0.44 | -4.72 | |
| Slovenia | 2.20 | 0.79 | |
| Slovakia | 0.96 | 1.14 | |
| Finland | -0.33 | -2.74 | |
| Sweden | 0.20 | -1.02 | |
|
Note: Some member states do not provide industry level data for the electricity sector. Source: Eurostat,https://ec.europa.eu/eurostat/databrowser/view/NAMA_10_CP_A21__custom_5863172/default/table?lang=en |
|||
These results can be insightful for the green transition in three main ways.
One, older capital tends to be dirtier in terms of carbon emissions. Therefore, if one Member State has an older capital stock than another, it will likely need more investment to update its capital to cleaner technologies.
Second, by looking at the annual growth rate, one could surmise how well a country’s tax code is able to facilitate investment in capital. This is important in the context of the green transition’s heavy investment needs especially as firms make decisions on the margin.
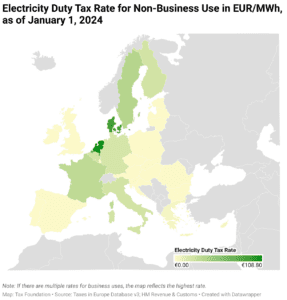
Third, investment specifically in the electricity sector will be crucial. As renewable energy becomes the basis of the EU’s energy mix, modernizing the EU-wide electricity grid to move energy from where it is produced to where it is consumed will be necessary.[17] The European Commission estimates that this modernization effort will cost €584 billion to achieve the targets of the Fit for 55 legislative package[18] and the REPowerEU plan between 2020 and 2030. If the level of a country’s stock is already high, the growth rate may not be high. However, in general, the higher a country’s annual capital stock growth rate is in the electricity sector, the more likely it is that the country will be able to efficiently guide enough private investment into updating its grid system.
With most Member States experiencing low or negative capital stock growth rates overall and specifically in the electricity sector, policymakers need to look at changing tax policies to reverse the trend over the next decade.
Green Transition Cost Estimates
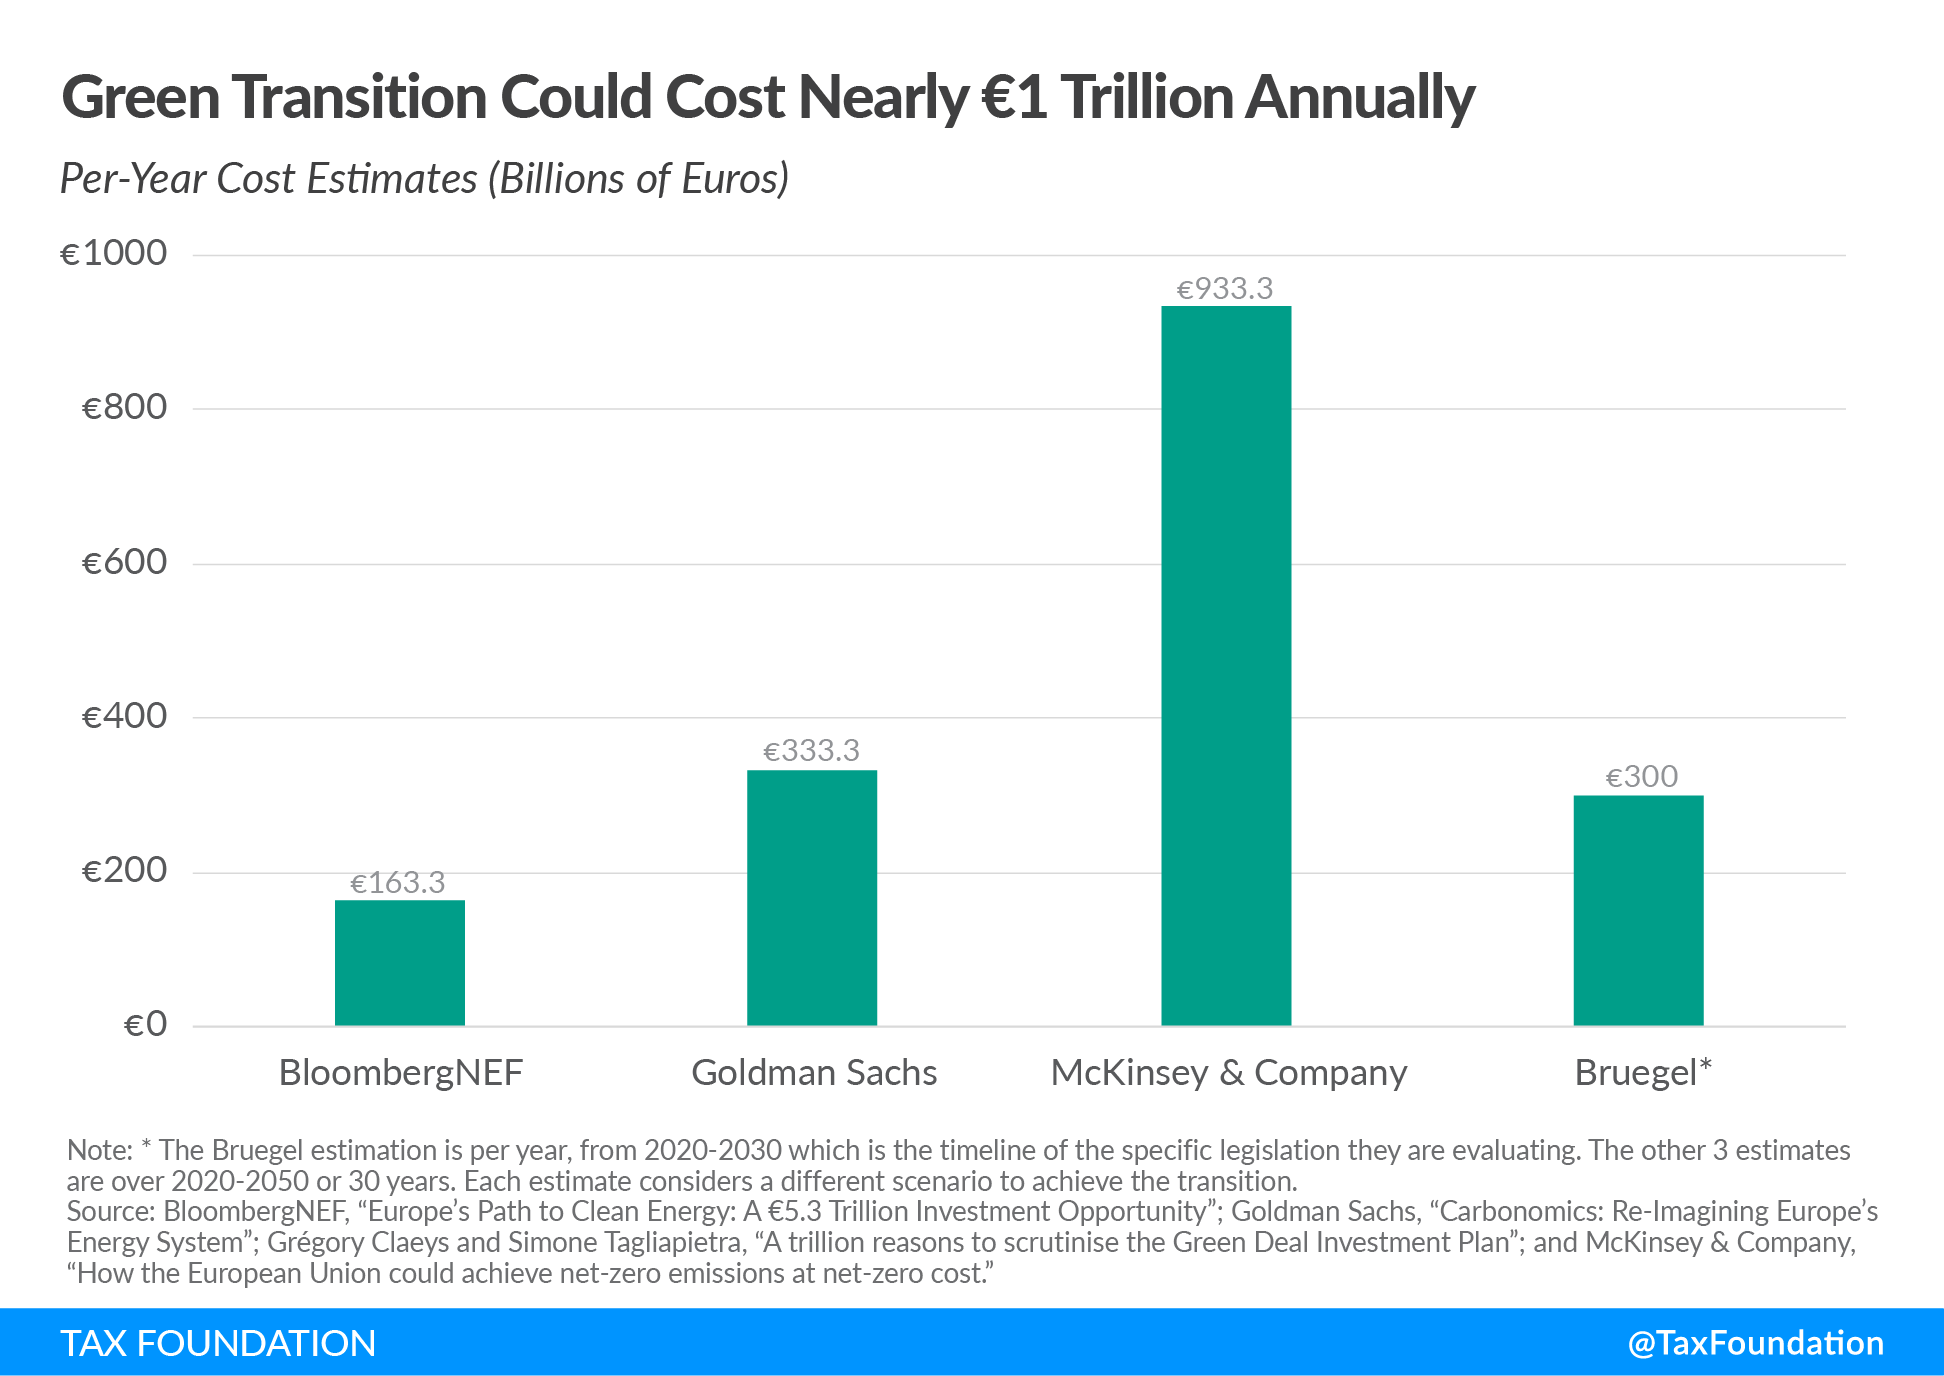
While the exact cost of the transition may be impossible to accurately calculate, experts have produced wide-ranging estimates using different policy scenarios. BloombergNEF estimates that new electricity generation and green hydrogen production capacity could cost nearly €4.9 trillion.[19] Goldman Sachs estimates that cumulative infrastructure investments in the EU will cost €10 trillion by 2050.[20] Just looking at the European Green Deal legislation over 10 years, Bruegel suggests that the cost may be around €300 billion per year instead of the seeming consensus range of €175 billion to €290 billion.[21] Finally, a more holistic estimate done by McKinsey & Company puts the total transition cost at €28 trillion over 30 years.[22]
Even without a precise estimate, it is clear that the EU is going to need a significant amount of public and private investment before 2050 to achieve the goals of the transition.
The Role of Public and Private Investment
A second important question for policymakers is how much of the total investment will need to be financed by European governments versus the private sector.
The European Court of Auditors estimates that EU financial support could help provide over €200 billion per year from 2021 to 2027 of the nearly €1 trillion per year needed.[23] This figure includes public spending under the Multiannual Financial Framework (MFF), the Recovery and Resilience Facility (RFF), and the European Investment Bank (EIB). However, beyond the current MFF, it is unclear how many resources the EU and Member States will dedicate to the transition.
Importantly though, proxy estimates suggest that only about 17 to 20 percent of the total necessary investment will come from public spending.[24] Some argue the public-private ratio may be closer to 1:4 with some variation between eastern and western Europe.[25]
Using McKinsey’s €28 trillion total cost estimate, €200 billion per year in public spending would be significantly less than the required €933.3 billion per year. One option would be for all subsequent MFFs between 2027 and 2050 to fill in the roughly €733 billion gap. However, more realistically, this gap will need to be filled by private investment.
Because private investment will play such a critical role in the future of EU growth and in achieving the goals of the green transition, the public sector’s role should be calibrated to support that investment.
Often, well-intended public policies can deter, rather than support, investment. The “crowding-out” effect is when higher levels of government spending increase deficits and interest rates and create higher costs for private investment. The same crowding-out could occur in the context of the green transition if governments add additional barriers to investment or fail to remove existing ones.
European lawmakers are trying to use industrial policy measures and public-private partnerships to drive more private investment believing that the policies will instead have a crowding-in effect, supporting investments that might not otherwise happen.
The most effective option is for governments to use regulatory, permitting, and tax policies to create an investment-friendly environment. Policies that push investment decisions away from more carbon-intensive production and electricity generation should be paired with investment-friendly approaches that support the capital investment necessary to fund the green transition.
Public spending is only one tool governments can use to support crucial private investment in the green transition. Policymakers should be prudent as public spending can do more harm than good if it causes crowding-out of private investment or starts a subsidy race to the bottom between governments. Principled tax policy that supports marginal investment decisions is often less politically attractive to focus on but is fundamentally important.
Impact of Tax Policy on General Capital Stock Investment
The third important question for policymakers: what are the most efficient and neutral tax policies to drive enough private sector investment into the transition before 2050?
To answer this question, it is important to first consider Member State tax systems and the broad impacts tax policy has on general investment. In particular, the efficiency of a Member State’s corporate tax rate, corporate tax base, and capital allowanceA capital allowance is the amount of capital investment costs, or money directed towards a company’s long-term growth, a business can deduct each year from its revenue via depreciation. These are also sometimes referred to as depreciation allowances. s policy compared to like-countries (such as those in the OECD) significantly impacts marginal investment decisions.
Corporate Tax Rates
According to economists at the Organisation for Economic Co-operation and Development (OECD), corporate income taxes are the most harmful for long-term economic growth, followed by high personal income taxes. Consumption taxes and property taxes were found to be less harmful to economic growth relative to taxes on capital and income.[26] This is primarily because financial capital is the most mobile and therefore most sensitive to changes in tax policy while land is the least mobile.
Furthermore, the tax incidenceTax incidence is a measure of who ultimately pays a tax, either directly or through the tax burden. This burden can be split between buyers and consumers, or different groups in the economy. of corporate income taxes falls on workers in the form of lower wages, shareholders through lower dividends, or consumers through higher prices. Therefore, a high corporate income taxA corporate income tax (CIT) is levied by federal and state governments on business profits. Many companies are not subject to the CIT because they are taxed as pass-through businesses, with income reportable under the individual income tax. rate makes an economy less competitive for highly mobile private investment, reduces government revenue, and hampers growth.
In the EU, corporate tax rates range widely compared to the OECD average of 21.5 percent and the worldwide average of 23.4 percent.[27] Taking into account central and subcentral taxes, Portugal has the highest statutory corporate income tax rate among European OECD countries at 31.5 percent. Germany, Italy, and France follow at 29.8 percent, 27.8 percent, and 25.8 percent, respectively. Lithuania (15 percent), Ireland (12.5 percent), and Hungary (9 percent) have the lowest rates. Among EU Member States not in the OECD, Malta has the highest rate at 35 percent, followed by Croatia (18 percent), Romania (16 percent), Cyprus (12.5 percent), and Bulgaria (10 percent).[28]
Even when all EU Member States implement a 15 percent minimum corporate tax rate under Pillar Two of the OECD BEPS project, countries will still need to compete for investment within the EU and with countries outside the EU. In addition, the more corporate tax rate harmonization countries have, the more they will need to compete for private investment using favorable policies within their corporate tax base.
Corporate Tax Bases
The corporate tax base is about defining what is, and is not, part of taxable profits. An economically efficient corporate tax base would subtract all relevant costs from corporate profits and have sufficient loss provisions to allow a company to be taxed on its average profitability over time.
Key elements of the corporate tax base include:
- Capital Cost RecoveryCost recovery is the ability of businesses to recover (deduct) the costs of their investments. It plays an important role in defining a business’ tax base and can impact investment decisions. When businesses cannot fully deduct capital expenditures, they spend less on capital, which reduces worker’s productivity and wages. : Cost recovery is the ability of businesses to recover (deduct) the costs of their investments. It plays an important role in defining a business’s tax base and can impact investment decisions. When businesses cannot fully deduct capital expenditures, they spend less on capital, which reduces workers’ productivity and wages.[29]
- Loss Provisions: A net operating loss (NOL) carryforward allows businesses suffering losses in one year to deduct them from future years’ profits. A net operating loss carrybackA Net Operating Loss (NOL) Carryback allows businesses suffering losses in one year to deduct them from previous years’ profits. Businesses thus are taxed on their average profitability, making the tax code more neutral. In the U.S., a Net Operating Loss cannot be carried back (only carried forward). allows businesses suffering losses in one year to deduct them from previous years’ profits. Businesses thus are taxed on their average profitability, making the tax code more neutral.[30]
- Treatment of Inventory: Last-in, first-out (LIFO) inventory deductions allow companies to deduct the cost of inventory at the price of the most recently acquired items and assumes that the last inventory purchased is the first to be sold. LIFO limits the impacts of volatile prices or inflation and lowers the tax cost of new inventory. In contrast, first-in, first-out (FIFO) inventory deductions are the least preferred method because they result in the highest taxable incomeTaxable income is the amount of income subject to tax, after deductions and exemptions. For both individuals and corporations, taxable income differs from—and is less than—gross income. . The average cost method is between FIFO and LIFO.[31]
- Special Credits and Deductions: A tax creditA tax credit is a provision that reduces a taxpayer’s final tax bill, dollar-for-dollar. A tax credit differs from deductions and exemptions, which reduce taxable income, rather than the taxpayer’s tax bill directly. is a provision that reduces a taxpayer’s final tax bill, euro-for-euro. A tax credit differs from deductions and exemptions, which reduce taxable income, rather than the taxpayer’s tax bill directly.[32] A patent boxA patent box—also referred to as intellectual property (IP) regime—taxes business income earned from IP at a rate below the statutory corporate income tax rate, aiming to encourage local research and development. Many patent boxes around the world have undergone substantial reforms due to profit shifting concerns. —also referred to as intellectual property (IP) regime—taxes business income earned from IP at a rate below the statutory corporate income tax rate, aiming to encourage local research and development.[33]
Capital cost recovery will be discussed in more detail below, but it is worth summarizing the other three areas here.
Capital Cost Recovery
The amount of investment costs a business can deduct in a year is called a capital allowance. Capital cost recovery rates reflect the net present value of capital allowances a business can deduct for a given capital investment over the full depreciation period.
Tax rules allow businesses to determine their profits by subtracting costs (such as wages, raw materials, and equipment) from revenue.[34] However, in most jurisdictions, capital investments are not treated like other costs that can be subtracted from revenue in the year that the money is spent. This introduces a bias toward short-term projects, with little or no capital investment.[35]
Instead, depreciation schedules specify the life span of an asset—often derived from the economic life of an asset—and determine the number of years over which an asset must be written off. By the end of the depreciation period, the business would have deducted the initial euro cost of the asset.[36]
However, in most cases, depreciation schedules do not consider the time value of money (a normal return plus inflation).[37] Therefore, lower capital allowances, and thus a higher cost of capital, can lead to a decline in business investment, reductions in the productivity of capital, and lower wages.[38]
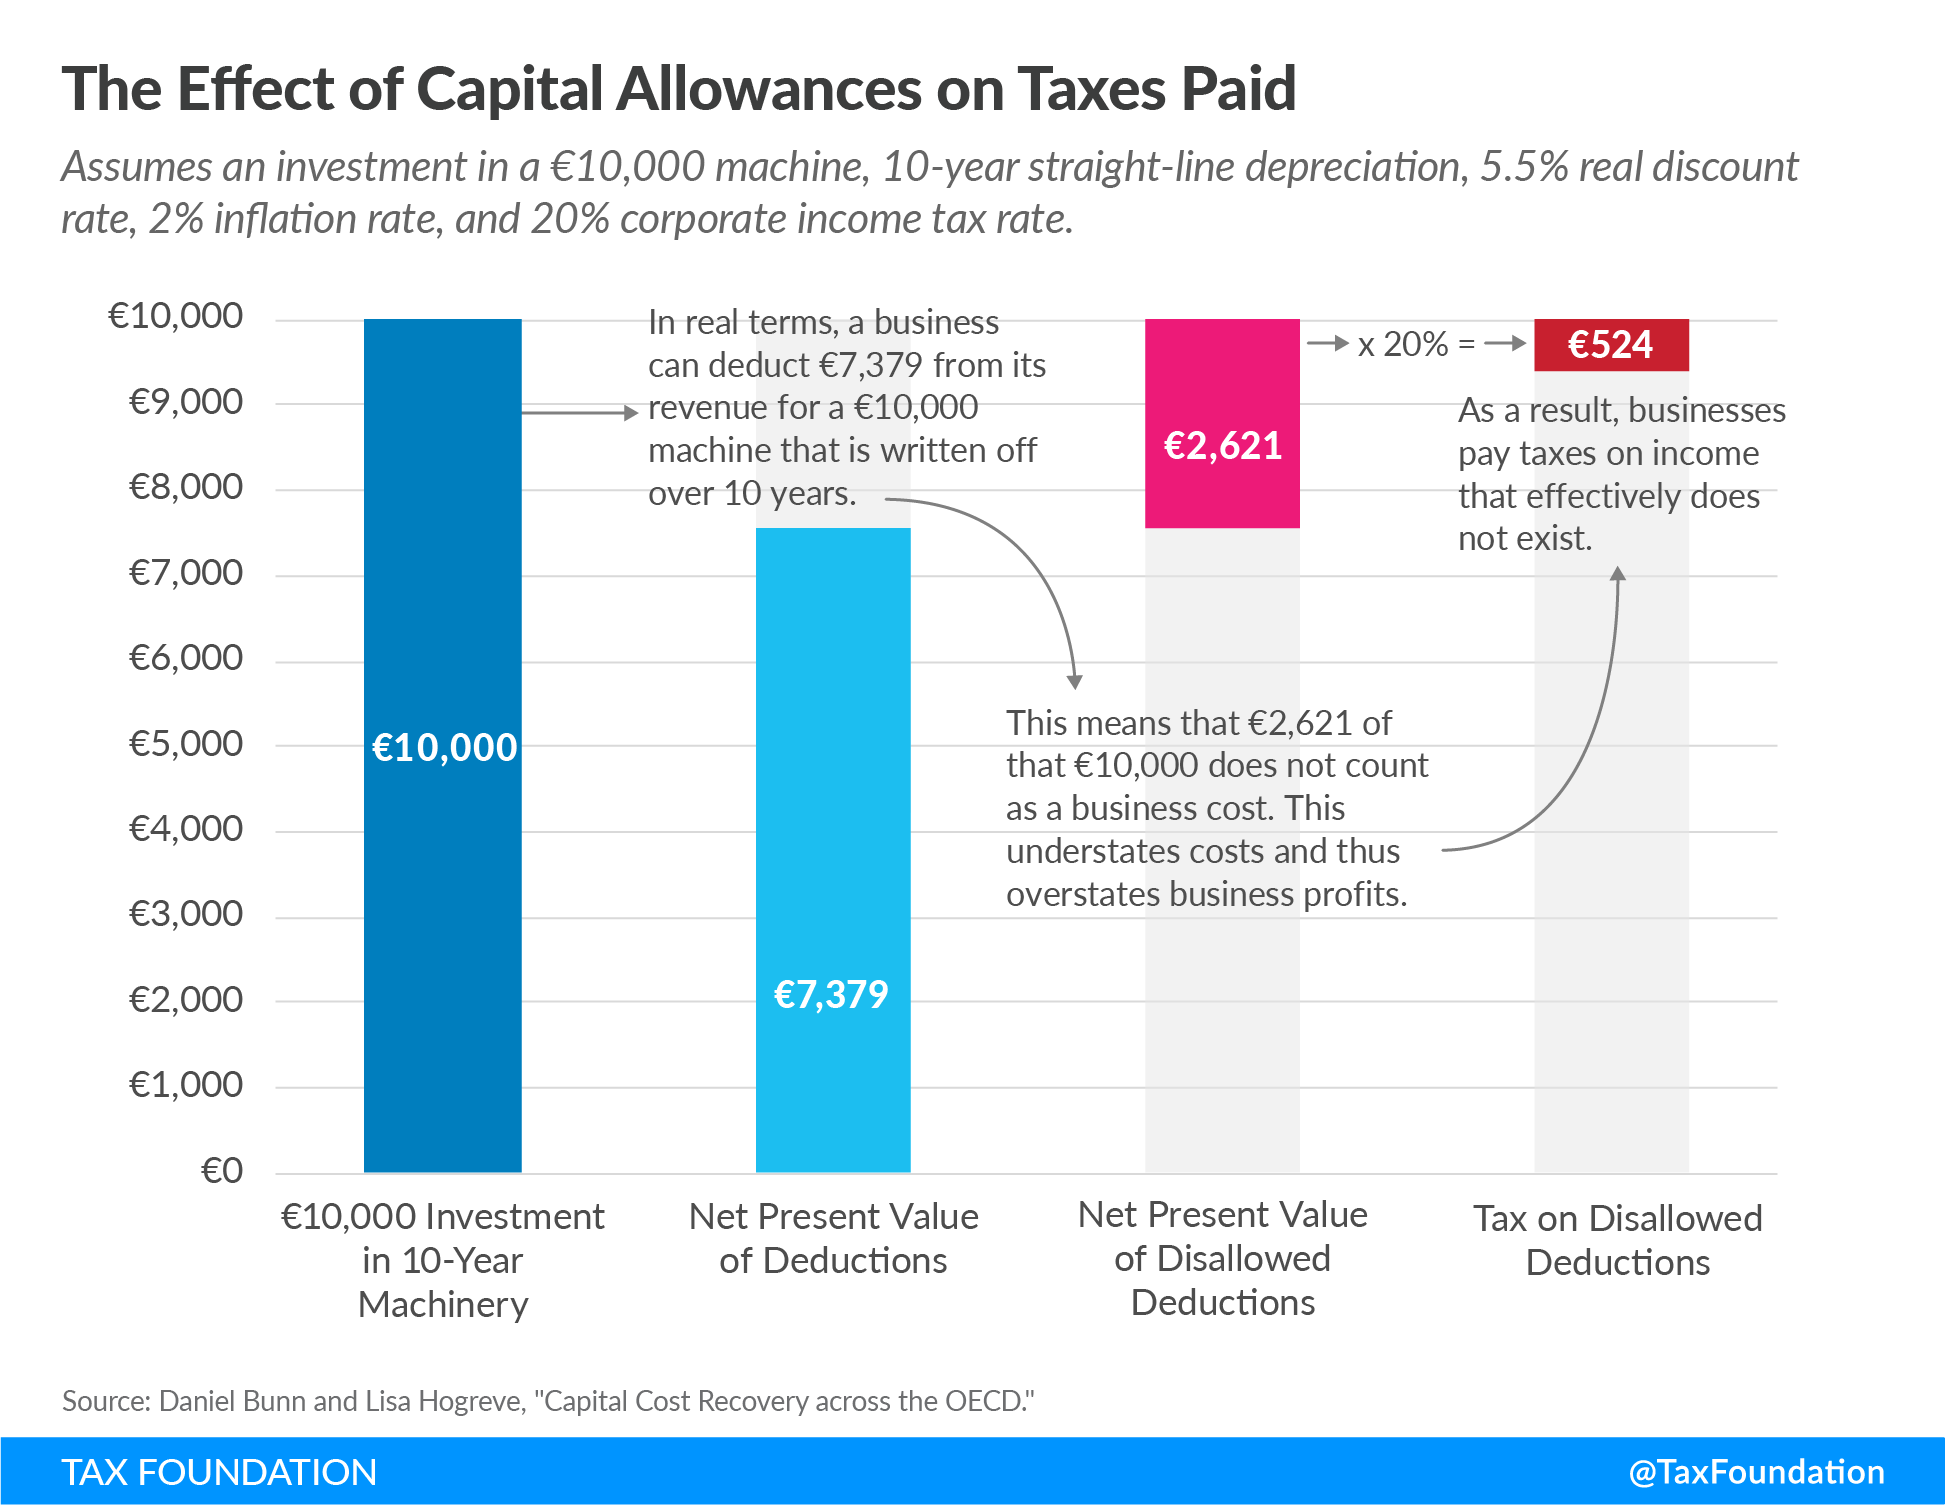
Figure 2 shows an example of how a low capital allowance leads to “phantom taxable income.” This is because a firm that makes a €10.000 investment into physical capital cannot deduct the full investment amount. This results in the firm’s profits being overstated by €2.621 and therefore, paying €524 more in taxes on income that effectively does not exist. This reduces investment and can hurt economic growth.
Investment in industrial buildings has relatively poor tax treatment in the OECD, with an average allowance of only 50.7 percent in 2022.[39] In the EU, Estonia and Latvia had the best treatment of industrial buildings at 100 percent because they operate cash-flow tax systems. Hungary (27.9 percent) had the lowest capital cost recovery rate.
The average capital allowance for intangibles is 77.5 percent in OECD countries.[40] In 2022 in the EU, Estonia and Latvia led at 100 percent. Ireland has the worst tax treatment of investments in intangibles at 64.6 percent, followed by Hungary, Malta, Spain, Slovenia, Greece, Cyprus, Finland, Portugal, and Austria at 73.8 percent.
Machinery generally has the best tax treatment, with an OECD average allowance of 87.2 percent.[41] As of 2022 in the EU, Estonia and Latvia have full cost recovery of investments in machinery again due to their cash-flow tax systems. The countries with the worst tax treatment of investments in machinery are Poland, Greece, and Cyprus with an allowance of only 73.8 percent.
In Germany, for example, the net present value of its machine capital allowance is only 84.7 percent.[42] This means that for a €100 investment in a machine, the firm will only be able to deduct €84.7 of it. As Figure 2 shows, this will create phantom taxable income. In turn, this additional tax burden reduces incentives to invest in Germany.
The following figure shows that the extent to which businesses can deduct their overall capital investment costs varies greatly across the EU.
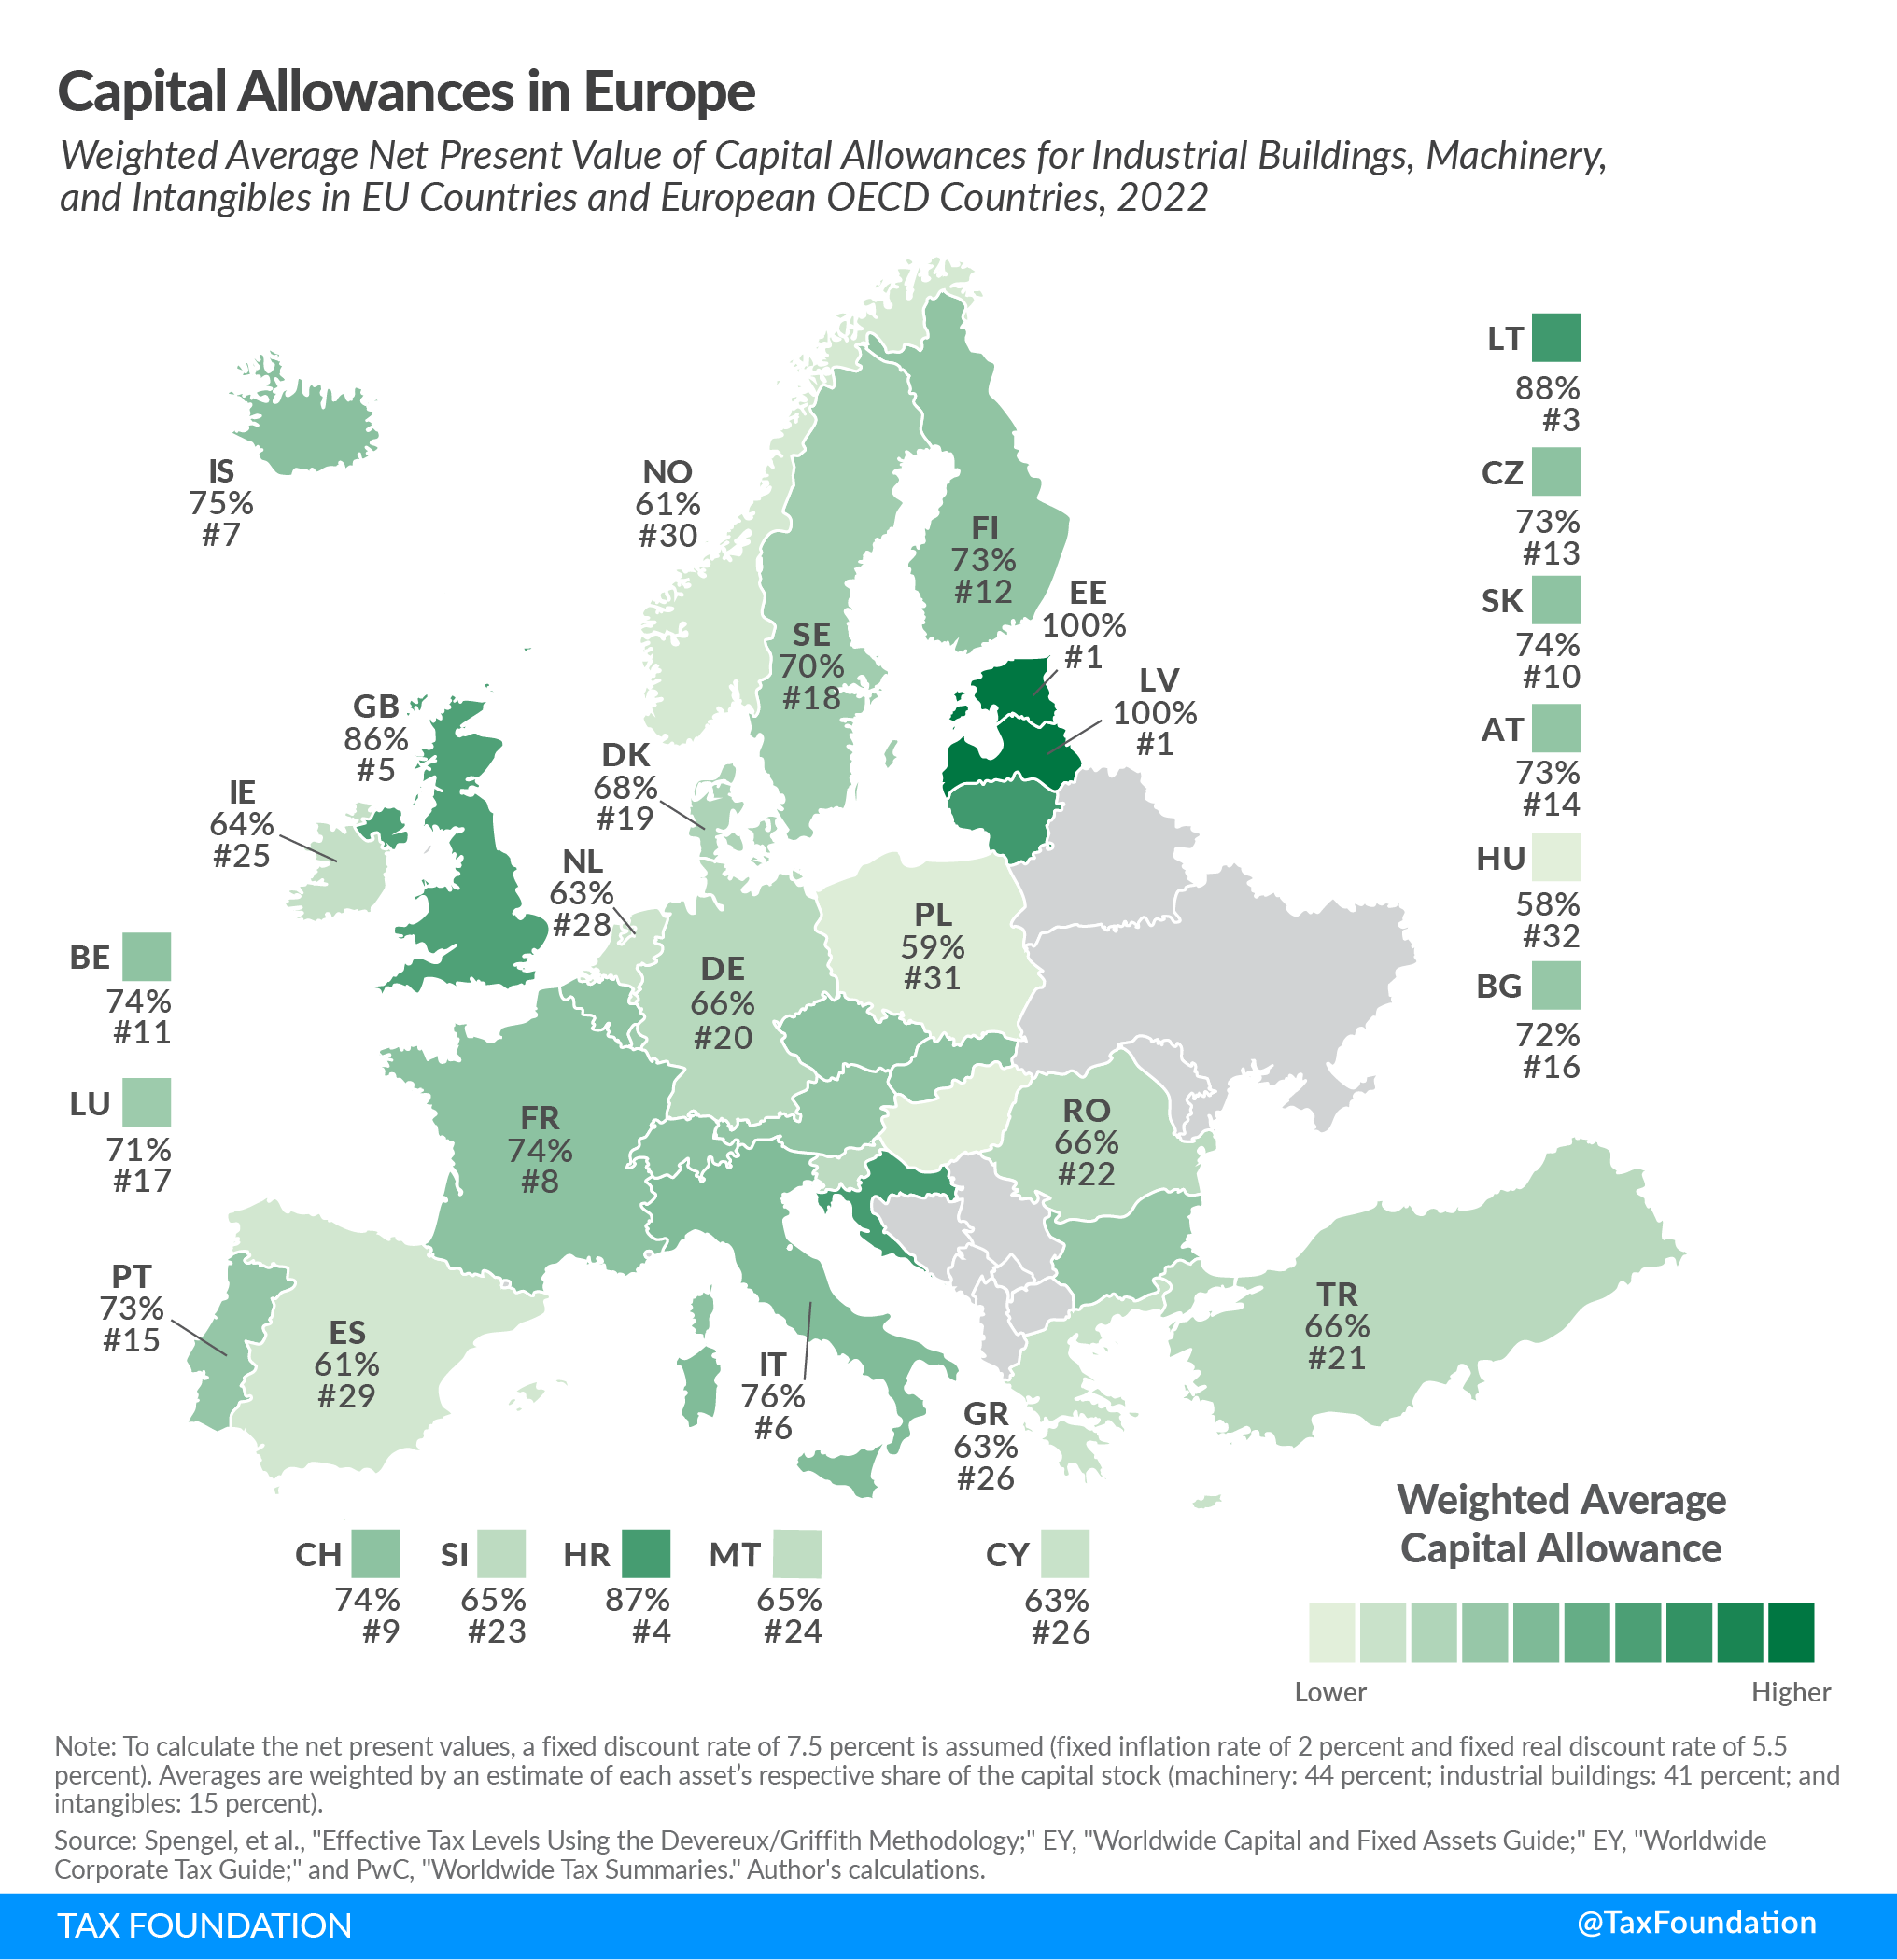
Many EU Member States rank below the OECD average in these important tax policies.[43] In the context of the green transition, this means that these Member States (and the EU overall) are marginally at a disadvantage in attracting the required levels of private investment in physical capital within Member States and between the EU and third countries.
Impact of EU Policies on General Capital Stock Investment
In addition to corporate tax rates, corporate tax bases, and capital allowance policies at the Member State level, there are multiple policies at the EU level that affect investment.
First, state aid rules are enshrined in Article 107 of the Treaty on the Functioning of the European Union (TFEU).[44] These rules are generally designed to protect and maintain fair economic competition between Member States by limiting economically harmful government subsidies. Well-designed and properly enforced rules can encourage investment by ensuring that the market functions efficiently and capital is allocated where it is most productive. Effectively, the rules can protect governments in the Single Market from engaging in a subsidy race.
However, in response to the United States’ Inflation Reduction Act, the European Commission released a proposal called the Green Deal Industrial Plan. The plan includes multiple subsidy-reliant measures such as the Net-Zero Industry Act (NZIA), which is specifically focused on boosting EU manufacturing capacity, the Temporary Crisis and Transition Framework, and a revision of the General Block Exemption Regulation (GBER), which enables Member States to directly implement aid measures, without having to notify the Commission beforehand for approval.[45] These measures could directly affect the level of investment in the transition and increase the costs to taxpayers.
The Commission also released an assessment of NZIA and found that there are three main scenarios the EU could take to implement the Act by 2030. Figure 4 below shows the cost estimates for each scenario, the amount of public funding that would be available, and the investment gap that will need to be filled with private investment.
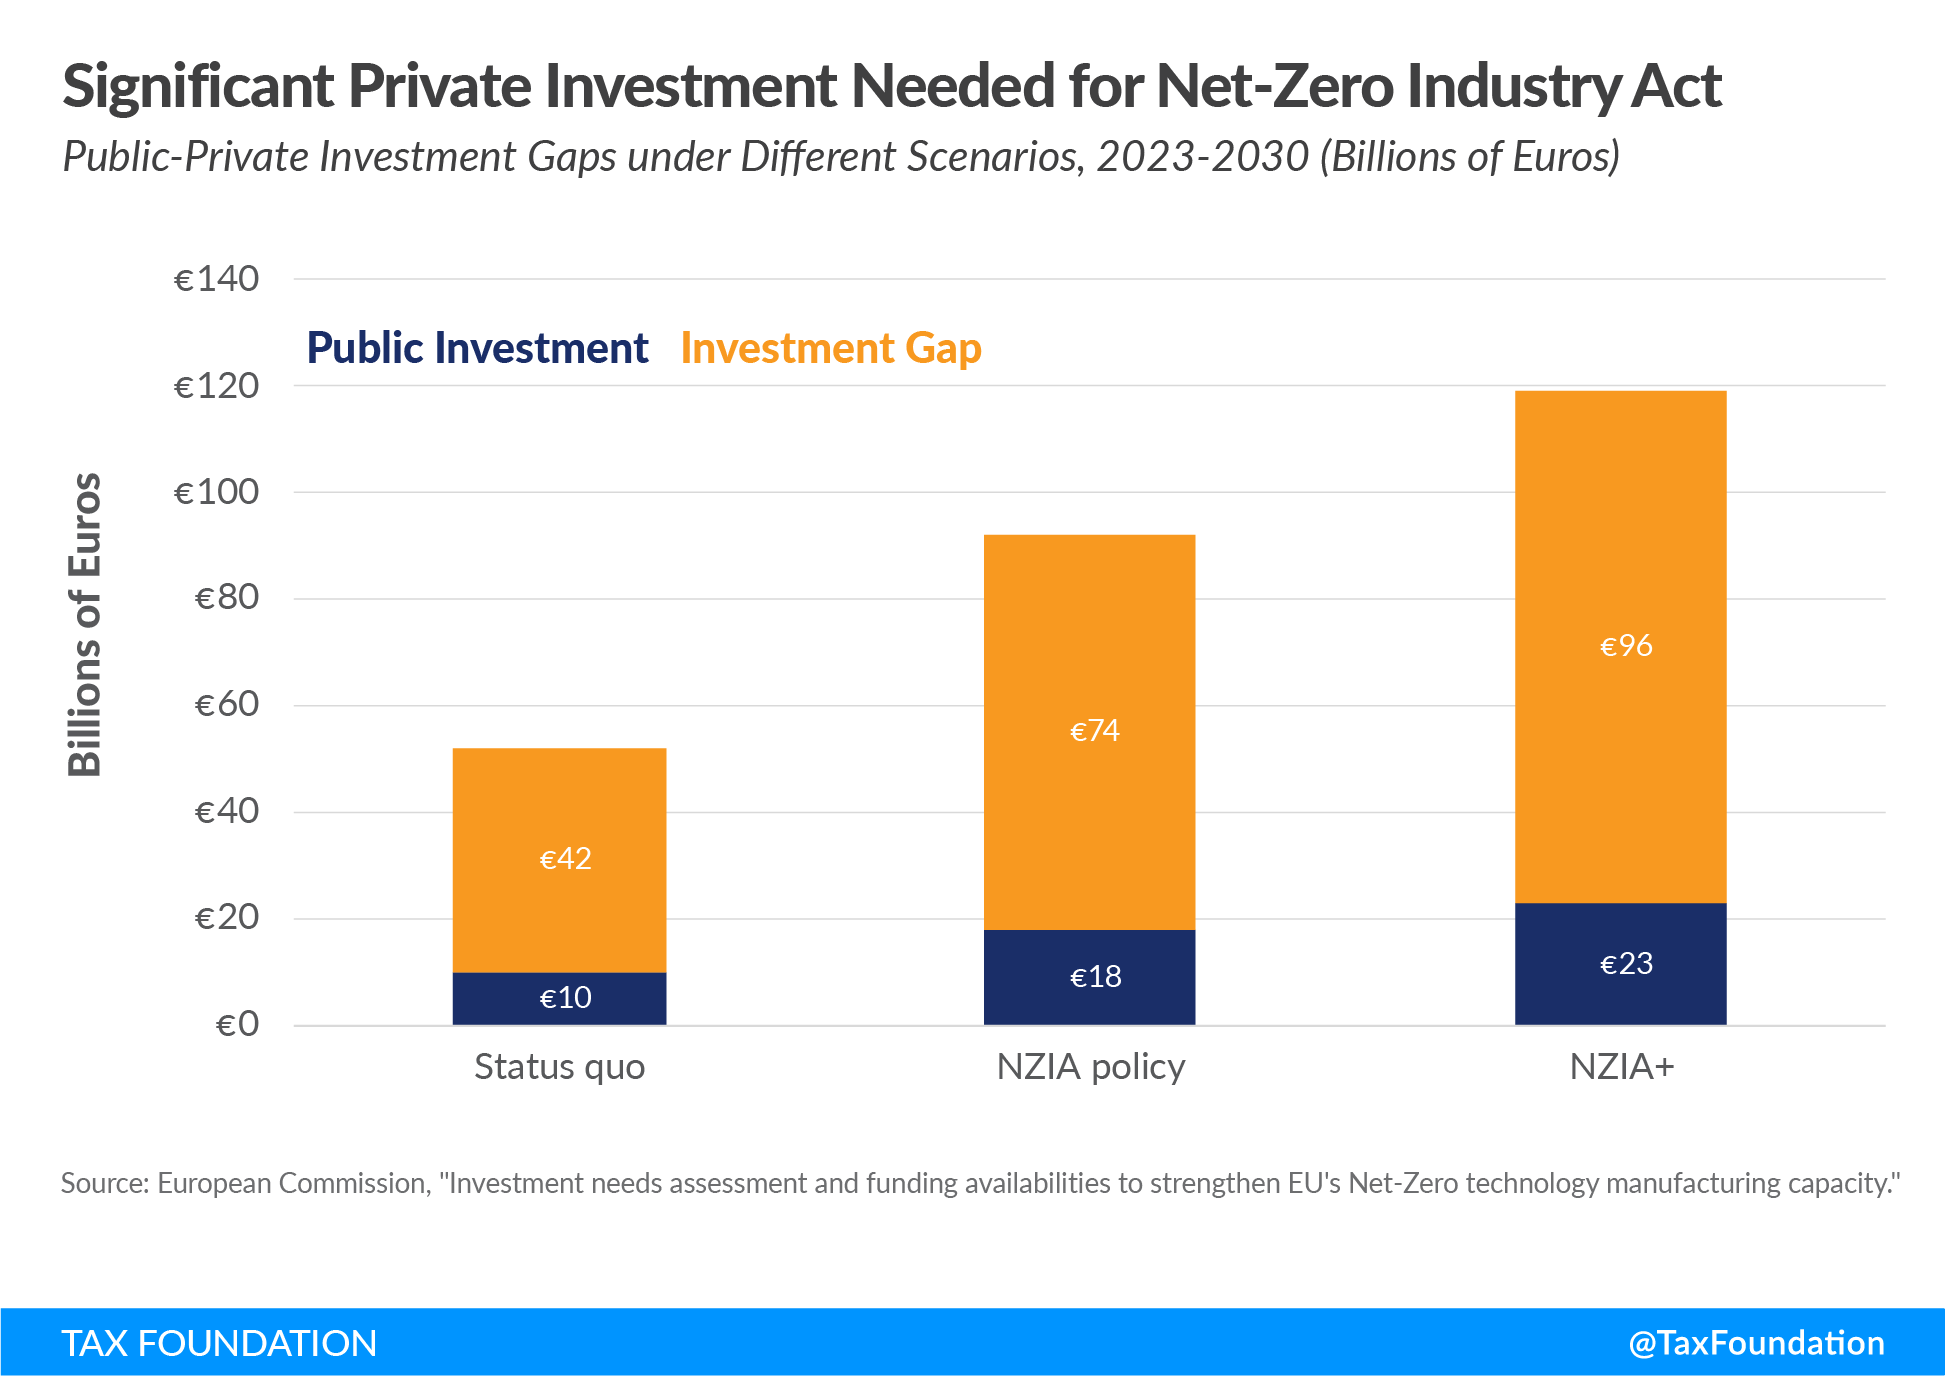
The conclusions are stark. NZIA alone will require between €42-96 billion of private investment between 2023-2030. Reforms such as better capital cost recovery policies in Member States, a completed EU Capital Markets Union, and a full Banking Union would go a long way to facilitating this amount of investment.
Second, it is well documented that the lack of a completed Capital Markets Union (CMU) hinders investment and economic growth. As one of the EU’s four freedoms is free movement of capital, finishing CMU is not only a political objective, but also an economic one. For example, the euro area has the world’s largest pool of savings with the surplus of domestic savings over investment amounting to €340 billion[46] in 2019.[47] The CMU would facilitate better capital flows from savers to investors for productive projects.[48] It would also help stabilize the EU during macroeconomic shocks which, in turn, would likely increase investor confidence.[49]
Third, the lack of a completed Banking Union has negative effects on investment. This is primarily the case because firms in the EU rely heavily on national banking systems for capital.[50] Meanwhile, American firms more often turn to capital markets for capital. Therefore, if banking systems in the EU become destabilized, as was the case after the 2008 financial crisis, investment is negatively impacted. This, combined with no CMU, is at least part of the reason why the European household saving rate hit an all-time high in 2020—but since 2008, investment has been declining, especially in southern and eastern Europe.
Finally, the EU’s Emissions Trading System (ETS) and the Carbon Border Adjustment Mechanism (CBAM) impact investment by putting a price on carbon emissions within the EU and, starting in 2026, emissions embedded in imports from outside the EU. While these policies are primarily designed to combat carbon emissions and are therefore considered climate policies rather than economic policies per se, the extra cost of emissions can cause European firms to be less competitive than firms producing in countries without a carbon price. The EU hopes CBAM will solve this competition issue (and consequentially increase investment in the EU), but without an export rebate for European firms, the negative result on investment could be significant.
In addition to Member State tax policies, EU-level policies directly impact the amount of general investment in the EU. Reforming Member State tax policies to be more competitive, adding export rebates for European firms under CBAM, and completing the EU’s CMU and the Banking Union would be efficient and neutral ways to increase the level of overall investment.
Inventory of Capital Allowances for Green Investment in the EU
In the pursuit of the green transition, some Member State governments have implemented tax policies targeted at increasing investment in greener capital stock.
Below are a few notable Member State tax policies that aim to increase the investment needed for the transition. A higher net present value reflects a more investment-friendly policy because the firm can recoup a larger percentage of the investment cost. For a complete inventory of Member State accelerated depreciation policies aimed at achieving the green transition, see Appendix Table 1.
- France: Equipment designed to save energy and equipment for the production of renewable energies can benefit from accelerated depreciation. The applicable coefficients are 2, 2.5, and 3 (multiplied by the normal depreciation rate), depending on the standard write-off period for tax purposes.
- Germany: For electric delivery vehicles, a 50 percent deduction in the first year is provided in addition to normal straight-line depreciation. This applies to vehicles purchased after December 31, 2019, and before January 1, 2031.
- Greece: Special depreciation rates (up to 100 percent) apply for zero- or low-emission means of transportation and related construction (such as electric vehicle charging points).
- Netherlands: Accelerated depreciation applies to investments in assets that are in the interest of environmental protection in the Netherlands and that appear on the so-called VAMIL (Vervroegde Afschrijving Milieu-investeringen) list.
As Appendix Table 1 indicates, there is no uniform, EU-wide standard. Member State governments have various ways of changing the depreciation amount that can be applied, the investments to which these special depreciations can be applied, and the years over which an investment can be written off. This can lead to a complex system of special green tax preferences that increase compliance costs for firms looking to make green investments.
Pro-Growth Tax Policy Recommendations to Mobilize Private Investment
Clearly, a large percentage of the green transition’s financing must come from private investment. Going back to the question above, what are the most efficient and neutral tax policies to drive enough private sector investment into the transition before 2050?
As discussed, there are many areas of general tax policy that governments should focus on to create investment-friendly environments. Most of these recommendations rely on shifting the EU’s overall tax mix away from distortionary corporate taxes to broader-based consumption taxA consumption tax is typically levied on the purchase of goods or services and is paid directly or indirectly by the consumer in the form of retail sales taxes, excise taxes, tariffs, value-added taxes (VAT), or an income tax where all savings is tax-deductible. es. Furthermore, special temporary green tax incentives can help guide investment decisions but come with a compliance cost that hampers investment and may not support all reasonable “green” investment options. However, there is a principled, pro-growth tax policy that could help accelerate marginal green investment decisions: full expensing.
Full expensing allows businesses to immediately deduct the full cost of certain investments in new or improved technology, equipment, or buildings.[51] It alleviates a bias in the tax code and incentivizes companies to invest more, which, in the long run, raises worker productivity, boosts wages, and creates more jobs.[52] In addition, making full expensing permanent rather than temporary smooths out the business cycle, ensures confidence in long-term investment planning, and results in higher levels of investment.[53]
Case Study: Permanent Full Expensing or Special Capital Allowances for Green Investment in the EU?
To show the power of permanent full expensing relative to special temporary green tax incentives, we consider green investments in Estonia, Latvia, Greece, and Spain.
Imagine that, in line with the objectives of the green transition, a delivery business wants to update its fleet of company vehicles from combustion engine cars to electric vehicles at a total cost of €1 million. If this investment were to take place in Spain under its special accelerated depreciation schedule for greener vehicles, the firm would only benefit from a net present value of 92.7 percent of the investment cost.
In Greece, the percentage of capital cost recovery for this same investment would be subjected to what classification of emissions the new vehicles would release into the air. If the vehicle fell under the “low emission” category, meaning emissions up to 50g CO2/km, the firm would be able to recover 90.1 percent of the initial investment cost. On the other hand, if the vehicle was considered “zero emissions,” then the firm could recover 96.5 percent.
If the firm made a €1 million investment in Estonia or Latvia, however, it could recover the entire €1 million investment. This is because Estonia and Latvia both operate cash-flow tax systems. In essence, this means that both countries have permanent full expensing for all business expenditures, not just those related to the green transition.
Furthermore, instead of having multiple layers of special tax policies, Estonia and Latvia have one simplified tax policy with which to comply. This keeps compliance costs for firms and enforcement costs for governments low. With more money at their disposal, firms can increase investment in productive projects and accelerate green transition investment.
| Country | Eligible Investment | Depreciation Rate | Net Present Value of Capital Allowances |
|---|---|---|---|
| Estonia | There is no special accelerated depreciation schedule for green invesetments. | 100% | 100% |
| Latvia | There is no special accelerated depreciation schedule for green invesetments. | 100% | 100% |
| Greece | Constructions and installations for charging of vehicles of zero or low emissions up to 50 g CO2/Km | 100% | 100% |
| Zero-emission means of transportation of individuals | 50% | 96.50% | |
| Low-emission means of transportation of individuals up to 50 g CO2/Km | 25% | 90.00% | |
| Zero-emission means of transportation of goods | 50% | 96.50% | |
| Low-emission means of transportation of goods up to 50 g CO2/Km | 25% | 90.00% | |
| Zero-emission means of mass transportation of individuals | 50% | 96.50% | |
| Low-emission means of mass transportation of individuals up to 50 g CO2/Km | 25% | 90.00% | |
| Spain | New vehicles classified as FCV, FCHV, BEV, REEV or PHEV that are used for business purposes and that come into operation in the tax periods starting in 2023, 2024 and 2025. These vehicles may be depreciated for tax purposes by applying the maximum depreciation rates multiplied by 2. | 32% | 92.70% |
| Sources: PwC, “Worldwide Tax Summaries Online,” https://taxsummaries.pwc.com/belgium/corporate/tax-credits-andincentives; EY, “Worldwide Capital and Fixed Assets Guide 2022”, Jul. 22, 2022, https://www.ey.com/en_gl/tax-guides/; worldwide-capital-and-fixed-assets-guide; EY, “Worldwide Corporate Tax Guide”, Aug. 1, 2022, https://www.ey.com/en_gl/tax-guides/worldwide-corporate-tax-guide; Author’s calculations using the methodology described in Cristina Enache, “Capital Cost Recovery across the OECD, 2022,” Tax Foundation, Apr. 4, 2023 | |||
Conclusion
Climate change will have lasting impacts on the European way of life. The green transition is a bold attempt by the European Union to mitigate these negative effects both environmentally and economically by moving the European economy to net zero by 2050.
To achieve these goals, the EU will need around 80 percent of the roughly €28 trillion to come from private investment. While public spending programs can help guide investment into risky projects, principled tax policy will be significantly more important to firms making marginal investment decisions.
Permanent full expensing is an efficient and neutral tax policy that will allow markets to allocate private investment effectively while moving the economy towards the climate goals of the EU. With the addition of a completed EU Capital Markets Union, Banking Union, and sound state aid rules to avoid a subsidy race to the bottom between governments, European policymakers have a chance to deliver for their citizens by making the transition a reality.
Stay informed on the tax policies impacting you.
Subscribe to get insights from our trusted experts delivered straight to your inbox.
SubscribeAppendix
| Country | Green Investment Incentive | Eligible Investment | Net Present Value of Capital Allowances |
|---|---|---|---|
| Belgium | A company can benefit from a one-shot investment deduction of 13.5 percent of the acquisition value of qualifying investments. With respect to environmentally friendly R&D investments, a company can opt for a spread investment deduction of 20.5 percent (for tax year 2023) of the depreciation on qualifying environmentally friendly R&D investments. | The deduction applies to qualifying patents, environmentally friendly R&D investments, and energy-saving investments. | Environmentally friendly R&D: 95.0% Environmentally friendly R&D (spread): 87.3% |
| Denmark | An increased depreciation basis of 116 percent is available for “green equipment” for the period of 23 November 2020 to 31 December 2022. Annual depreciation allowances on machinery and equipment may be claimed under the diminishing-balance method at up to 25 percent. | This applies to operating equipment | 84.60% |
| Finland | A qualifying investment can be depreciated in four years. | This applies to environmental investments | 90.10% |
| France | Equipment designed to save energy and equipment for the production of renewable energies can benefit from an accelerated depreciation. The applicable coefficients are 2, 2.5, and 3 (times the normal depreciation rate), depending on the standard write-off period for tax purposes. | This applies to equipment designed to save energy and equipment for the production of renewable energies can benefit from the accelerated depreciation. | The net present value is difficult to determine given the wide range of qualifying assets and depreciation schedules. Standard machinery allowance is 88 percent. |
| Germany | For electric delivery vehicles, a 50 percent deduction in the first year is provided in addition to normal straight-line depreciation. This applies to vehicles purchased after December 31, 2019 and before January 1, 2031. | New electric delivery vehicles. | 92.3-93.3% |
| Greece | Special depreciation rates (up to 100 percent) apply for zero- or low-emission means of transportation and related construction (such as electric vehicle charging points). | Zero- or low-emission means of transportation and related construction | ŸZero-emission means of transportation of individuals: 96.5% ŸLow-emission means of transportation of individuals: 90.1% |
| Ireland | Accelerated capital allowances provide 100 percent tax relief under certain conditions in the first year and are available to companies for expenditure on certain energy-efficient equipment. | This applies to energy-efficient equipment. | 100% |
| Italy (see note) | A Superbonus tax credit covers 110 percent of a qualifying expense. | This applies to energy-efficient upgrades on residential buildings and concurrent installations of energy-efficient measures. | 110% |
| Netherlands | Accelerated depreciation applies to investments in assets that are in the interest of the protection of the environment in the Netherlands and that appear on the so-called VAMIL (Vervroegde Afschrijving Milieu-investeringen) list. | The Environmental Investment Allowance (MIA) and the Random Depreciation of Environmental Investments (VAMIL) are tax benefits for entrepreneurs who invest in environmentally friendly business assets. | Ÿ VAMIL Equipment: 97.9% MIA: 95.5% |
| Hungary | A 33 percent accerlerated depreciation rate is available. | Automation equipment, equipment for environmental protection. | 93.20% |
| Luxembourg | A special accelerated depreciation on 80 percet of the cost of fixed assets is available. | This applies to assets that protect the national environment or save energy. | ŸBuldings: 96.2% ŸPlant/Machine: 97.9% Ÿmotor vehicles: 98.6% |
| Slovenia | As of 1 January 2022, a new tax allowance shall be recognised at 40 percent amount of the investment. The investment allowances can be utilised up to a maximum of 63 percent of the actual tax base. | This applies to environmentally friendly technologies, cleaner, cheaper public and private transport, decarbonisation of the energy sector, energy efficiency of buildings, and implementing of other standards for climate neutrality. | Equipment/vehicles/machinery: 92.0% |
| Spain | Certain electric vehicles may be depreciated for tax purposes by applying the maximum depreciation rates multiplied by 2. The standard depreciation rate for motor cars is 16 percent. | New vehicles classified as FCV, FCHV, BEV, REEV or PHEV that are used for business purposes and that come into operation in the tax periods starting in 2023, 2024 and 2025. | 92.7% |
|
Note: Italy is in the process of changing some of its policies, but this table reflects the policies as of 2022. Source: PwC, “Worldwide Tax Summaries Online,” https://taxsummaries.PwC.com/belgium/corporate/tax-credits-and-incentives; |
|||
References
[1] As the United Nations puts it, “net zero means cutting greenhouse gas emissions to as close to zero as possible, with any remaining emissions re-absorbed from the atmosphere, by oceans and forests for instance.” See United Nations, “For a livable climate: Net-zero commitments must be backed by credible action,” https://www.un.org/en/climatechange/net-zero-coalition.
[2] The original dollar values were converted to euros using a 1 EUR = 1.13 USD exchange rate.
[3] Tax Foundation, “Full Expensing,” https://taxfoundation.org/tax-basics/full-expensing/.
[4] European Commission, “Paris Agreement,” https://climate.ec.europa.eu/eu-action/international-action-climate-change.
[5] United Nations, “For a livable climate: Net-zero commitments must be backed by credible action,” https://www.un.org/en/climatechange/net-zero-coalition.
[6] McKinsey & Company, “The net-zero transition: What it would cost, what it could bring,” https://www.mckinsey.com/capabilities/sustainability/our-insights/the-net-zero-transition-what-it-would-cost-what-it-could-bring
[7] European Council “’Channeling Europe’s savings into growth’ – Op-ed article by European Council, European Commission, Eurogroup, ECB and EIB Presidents,” Mar. 9, 2023, https://www.consilium.europa.eu/en/press/press-releases/2023/03/09/channeling-europe-s-savings-into-growth-op-ed-article-by-european-council-european-commission-eurogroup-ecb-and-eib-presidents/
[8] https://www.politico.eu/article/europes-new-climate-plan-dont-burn-coal-burn-your-eu-ideals-european-commission-brussels-gunther-oettinger-beijing-us-pascal-lamy/
[9] European Commission, “The Green Deal Industrial Plan: putting Europe’s net-zero industry in the lead,” Feb. 1, 2023, https://ec.europa.eu/commission/presscorner/detail/en/IP_23_510.
[10] European Commission, “Investment needs assessment and funding availabilities to strengthen EU’s Net-Zero technology manufacturing capacity,” Mar. 23, 2023, https://single-market-economy.ec.europa.eu/system/files/2023-03/SWD_2023_68_F1_STAFF_WORKING_PAPER_EN_V4_P1_2629849.PDF
[11] Zsolt Darvas and Guntram Wolff, “A green fiscal pact: climate investment in times of budget
Consolidation,” Bruegel 18 (September 2021), https://www.bruegel.org/sites/default/files/wp_attachments/PC-2021-18-0909.pdf
[12] European Council “’Channeling Europe’s savings into growth’ – Op-ed article by European Council, European Commission, Eurogroup, ECB and EIB Presidents,” Mar. 9, 2023, https://www.consilium.europa.eu/en/press/press-releases/2023/03/09/channeling-europe-s-savings-into-growth-op-ed-article-by-european-council-european-commission-eurogroup-ecb-and-eib-presidents/.
[13] European Commission, “A European Green Deal,” https://commission.europa.eu/strategy-and-policy/priorities-2019-2024/european-green-deal_en.
[14] The broken window fallacy “argues that there is no economic gain from fixing the destruction caused by a certain event. Even though capital will be spent to repair any damages, that is only a maintenance cost that does not spur the economy in the long run, as it is not a true increase in economic output. The money and time spent on repairing damages could be spent on more productive goods and services.” In the green transition’s case, this could apply to old capital stock that policymakers deem “broken” rather than upgrading it to be environmentally friendly. See Andrew Beattie, “The Broken Window Fallacy: Definition and Examples in Economics,” Investopedia, Jul. 30, 2021, https://www.investopedia.com/ask/answers/08/broken-window-fallacy.asp#:~:text=By%20forcing%20his%20father%20to,been%20put%20to%20better%20use.
[15] Nicholas Borst, “Capital Stock…and Flow,” Peterson Institute for International Economics, May. 31, 2012, https://www.piie.com/blogs/china-economic-watch/capital-stockand-flow#:~:text=Just%20to%20recap%2C%20the%20capital,using%20the%20perpetual%20inventory%20method.
[16] IMF, “Estimating Public, Private, and PPP Capital Stocks,” https://www.imf.org/external/np/fad/publicinvestment/data/info.pdf
[17] Hal Hodson, “The electric grid is about to be transformed,” The Economist, Apr. 5, 2023, https://www.economist.com/technology-quarterly/2023/04/05/the-electric-grid-is-about-to-be-transformed?giftId=eb75bd38-ed5e-4733-9ae3-2794171a78cb.
[18] European Commission, “Digitalising the energy system – EU action plan,” Oct. 18, 2022, https://eur-lex.europa.eu/legal-content/EN/TXT/?uri=CELEX%3A52022DC0552&qid=1666369684560.
[19] BloombergNEF, “Europe’s Path to Clean Energy: A $5.3 Trillion Investment Opportunity,” Apr. 13, 2022, https://about.bnef.com/blog/europes-path-to-clean-energy-a-5-3-trillion-investment-opportunity/.
[20] Goldman Sachs, “Carbonomics: Re-Imagining Europe’s Energy System,” Jul. 21, 2022, https://www.goldmansachs.com/insights/pages/carbonomics-re-imagining-europes-energy-system.html.
[21] Grégory Claeys and Simone Tagliapietra, “A trillion reasons to scrutinise the Green Deal Investment Plan,” Jan. 15, 2020, https://www.bruegel.org/blog-post/trillion-reasons-scrutinise-green-deal-investment-plan.
[22] McKinsey & Company, “How the European Union could achieve net-zero emissions at net-zero cost,” Dec. 3, 2020, https://www.mckinsey.com/capabilities/sustainability/our-insights/how-the-european-union-could-achieve-net-zero-emissions-at-net-zero-cost.
[23] European Court of Auditors, “Sustainable finance: More consistent EU action needed to redirect finance towards sustainable investment,” 2021, https://www.eca.europa.eu/Lists/ECADocuments/SR21_22/SR_sustainable-finance_EN.pdf.
[24] European Commission, “Investment needs assessment and funding availabilities to strengthen EU’s Net-Zero technology manufacturing capacity,” Mar. 23, 2023, https://single-market-economy.ec.europa.eu/system/files/2023-03/SWD_2023_68_F1_STAFF_WORKING_PAPER_EN_V4_P1_2629849.PDF.
[25] Zsolt Darvas and Guntram Wolff, “A green fiscal pact: climate investment in times of budget
Consolidation,” Bruegel 18 (September 2021), https://www.bruegel.org/sites/default/files/wp_attachments/PC-2021-18-0909.pdf.
[26] Laura Vartia, “How do Taxes Affect Investment and Productivity?: An Industry-Level Analysis of OECD Countries,” OECD Economics Department Working Papers 656 (Dec. 19, 2008), https://doi.org/10.1787/230022721067.
[27] Sean Bray, “2023 Corporate Income Tax Rates in Europe,” Tax Foundation, Feb. 14, 2023, https://taxfoundation.org/corporate-tax-rates-europe-2023/
[28] PwC, “Worldwide Tax Summaries Guide,” Dec. 30, 2022, https://taxsummaries.PwC.com/croatia/corporate/taxes-on-corporate-income
[29] Tax Foundation, “Cost Recovery,” https://taxfoundation.org/tax-basics/cost-recovery/.
[30] Tax Foundation, “Net Operating Loss Carryback,” https://taxfoundation.org/tax-basics/net-operating-loss-carryback/.
[31] Tax Foundation, “Last-In, First-Out (LIFO),” https://taxfoundation.org/tax-basics/last-in-first-out-lifo/.
[32] Tax Foundation, “Tax Credit,” https://taxfoundation.org/tax-basics/tax-credit/.
[33] Tax Foundation, “Patent Box,” https://taxfoundation.org/tax-basics/patent-box/.
[34] Cristina Enache, “Capital Cost Recovery across the OECD, 2022,” Tax Foundation, Apr. 4, 2023.
[35] Ibid.
[36] Stephen J. Entin, “The Tax Treatment of Capital Assets and Its Effect on Growth: Expensing, Depreciation, and the Concept of Cost Recovery in the Tax System,” Tax Foundation, Apr. 24, 2013, https://taxfoundation.org/tax-treatment-capital-assets-and-its-effect-growth-expensing-depreciation-and-concept-cost-recovery/.
[37] This can be thought of as the opportunity cost of tying up the money in a particular investment. See Stephen J. Entin, “The Neutral Cost Recovery System: A Pro-Growth Solution for Capital Cost Recovery,” Tax Foundation, Oct. 29, 2013, https://taxfoundation.org/neutral-cost-recovery-system-pro-growth-solution-capital-cost-recovery/.
[38] Stephen J. Entin, “The Tax Treatment of Capital Assets and Its Effect on Growth: Expensing, Depreciation, and the Concept of Cost Recovery in the Tax System.”
[39] Cristina Enache, “Capital Cost Recovery across the OECD, 2022,” Tax Foundation, Apr. 4, 2023.
[40] Ibid.
[41] Ibid.
[42] Ibid.
[43] Daniel Bunn and Lisa Hogreve, “International Tax Competitiveness Index 2022,” Tax Foundation, Oct. 17, 2022, https://taxfoundation.org/2022-international-tax-competitiveness-index/.
[44] European Commission, “State Aid Overview,” https://competition-policy.ec.europa.eu/state-aid/state-aid-overview_en.
[45] European Commission, “State aid: Commission consults Member States on proposal for a Temporary Crisis and Transition Framework,” Feb. 1, 2023, https://ec.europa.eu/commission/presscorner/detail/en/ip_23_513.
[46] François Villeroy de Galhau, “Capital Markets Union: unleashing Europe’s potential,” transcript of speech delivered November 30, 2021, https://www.banque-france.fr/en/intervention/capital-markets-union-unleashing-europes-potential.
[47] This amount of €338.2 billion in 2019 corresponds to the net lending surplus of the euro area (i.e., net lending minus net borrowing or balance of the current account, plus the balance of the capital account). See François Villeroy de Galhau, “Capital Markets Union: unleashing Europe’s potential,” transcript of speech delivered November 30, 2021, https://www.banque-france.fr/en/intervention/capital-markets-union-unleashing-europes-potential.
[48] “Channeling Europe’s savings into growth” – Op-ed article by European Council, European Commission, Eurogroup, ECB and EIB Presidents,” https://www.ecb.europa.eu/press/blog/date/2023/html/ecb.blog.230309~addaac5e08.en.html.
[49] Vítor Constâncio, Karel Lannoo, and Apostolos Thomadakis, “Rebranding Capital Markets Union A market finance action plan,” CEPS, June 2019, https://www.ceps.eu/wp-content/uploads/2019/07/Rebranding-Capital-Markets-Union.pdf.
[50] Ashok Vir Bhatia, Srobona Mitra, and Anke Weber, “A Capital Market Union for Europe: Why It’s Needed and How to Get There,” IMF Blog, Sep. 10, 2019, https://www.imf.org/en/Blogs/Articles/2019/09/10/blog-a-capital-market-union-for-europe.
[51] Tax Foundation, “Full Expensing,” https://taxfoundation.org/tax-basics/full-expensing/.
[52] Kevin A. Hassett and R. Glenn Hubbard, “Tax Policy and Business Investment,” Handbook of Public Economics 3 (2002), https://www.sciencedirect.com/science/article/pii/S1573442002800246.
[53] Giorgia Maffini, Jing Xing, and Michael P. Devereux, “The Impact of Investment Incentives: Evidence from UK Corporation Tax Returns,” American Economic Journal: Economic Policy 11:3 (August 2019): 361-89, https://www.aeaweb.org/articles?id=10.1257/pol.20170254.
Share