Today’s map is the final in our series examining each of the five major components of the 2020 State Business Tax Climate Index. Compared to individual, corporate, sales, and property taxes, unemployment insurance (UI) taxes are less widely understood, but they have important implications for a state’s business climate. A state’s performance on the UI tax component accounts for 9.5 percent of that state’s overall Index score.
Unemployment insurance is a joint federal-state social insurance program that finances benefits for recently unemployed workers through taxes on employers. State UI taxA tax is a mandatory payment or charge collected by local, state, and national governments from individuals or businesses to cover the costs of general government services, goods, and activities. systems are often quite complex, using variable-rate structures that impose different rates depending on how well-established a business is, its layoff history, and the health of the state’s UI trust fund, among other factors. All 50 states and the District of Columbia levy UI taxes, but some states structure their systems better than others.
The least-damaging UI tax systems are those that adhere closely to the federal taxable wage base, have low minimum and maximum tax rates on each rate schedule, avoid levying surtaxes or creating benefit add-ons, and have straightforward experience formulas and charging methods. More harmful UI tax systems are those that have high minimum and maximum rates, wage bases that far exceed the federal level, complicated experience formulas and charging methods, and surtaxes or benefit add-ons that go beyond the core functions of the UI program.
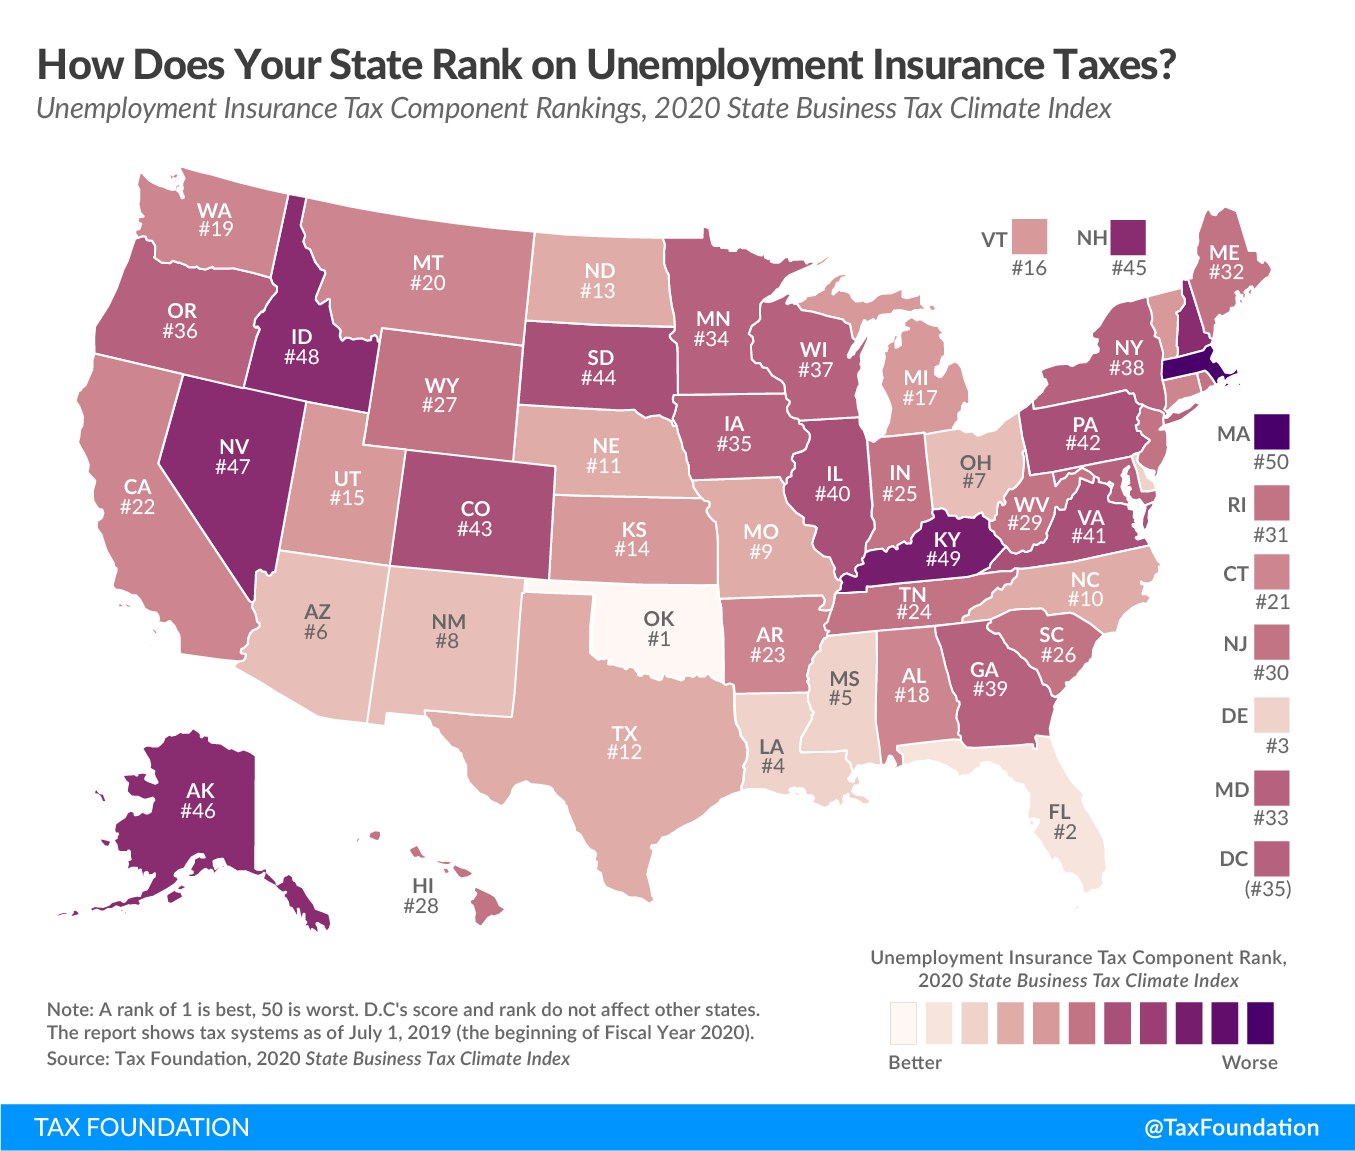
On this year’s Index, the states with the best-scoring UI tax systems are Oklahoma, Florida, Delaware, Louisiana, Mississippi, and Arizona. The worst-structured UI tax systems are found in Massachusetts, Kentucky, Idaho, Nevada, Alaska, and New Hampshire.
There are several reasons UI taxes may impact employers’ location decisions. One simple reason is that some states have high statutory minimum and maximum tax rates that apply to large taxable wage bases, while others have low minimum and maximum rates and low taxable wage bases. For example, Arizona, California, Florida, and Tennessee align their taxable wage base with the federal base of $7,000 per employee, while other states extend the taxable wage base far beyond the federal minimum, such that the tax is applied on tens of thousands of dollars of each employee’s wages. (Currently, Washington is the state with the highest taxable wage base, at $49,800.) Rates can only be understood in tandem with wage bases. A 10 percent tax on a $7,000 wage base raises $700, while the same rate on a $49,800 wage base generates $4,980.
Another important consideration is a state’s experience rating formula, which varies from state to state. The concept behind experience ratings is that each employer’s UI tax liability should be adjusted by their own past experience with layoffs. Companies with frequent layoffs face greater liability than companies with steadier track records. But there are different ways that these ratings can be calculated, and different approaches for handling new businesses which have yet to develop a meaningful track record.
Some states lean more heavily on aggregate state “experience,” while others focus more specifically on individual businesses. Some use what is called a benefit ratio formula, based on the ratio of unemployment benefits to payroll. Others use a benefit wage ratio formula, or a reserve ratio formula, defined as the balance in the employer’s state unemployment insurance account divided by payroll.
One of the most harmful aspects of UI taxes is that financially troubled businesses, for which layoffs may be a matter of survival, are shifted into higher tax rate schedules when they can least afford to pay a higher tax bill. Failing businesses face ever-higher UI taxes, sending them into further decline. Similarly, surtaxes imposed when UI fund reserves are low mean higher tax liability right when businesses are struggling most. Well-designed UI tax systems emphasize greater stability and predictability.
To read more about how UI tax systems are evaluated in the Index, click here.
For even more information about UI taxes, read our background paper, “Unemployment Insurance Taxes: Options for Program Design and Insolvent Trust Funds.”
To determine whether your state’s unemployment insurance tax has risen or fallen in the ranks in recent years, see the table below.
|
Note: A rank of 1 is best, 50 is worst. All scores are for fiscal years. DC’s score and rank do not affect other states. Source: Tax Foundation. |
|||||
| State | 2017 Rank | 2018 Rank | 2019 Rank | 2020 Rank | Change from 2019 to 2020 |
|---|---|---|---|---|---|
| Alabama | 14 | 11 | 12 | 18 | -6 |
| Alaska | 29 | 25 | 35 | 46 | -11 |
| Arizona | 11 | 15 | 13 | 6 | 7 |
| Arkansas | 30 | 32 | 34 | 23 | 11 |
| California | 16 | 13 | 17 | 22 | -5 |
| Colorado | 42 | 35 | 40 | 43 | -3 |
| Connecticut | 21 | 19 | 23 | 21 | 2 |
| Delaware | 3 | 3 | 3 | 3 | 0 |
| Florida | 2 | 2 | 2 | 2 | 0 |
| Georgia | 35 | 38 | 38 | 39 | -1 |
| Hawaii | 24 | 27 | 26 | 28 | -2 |
| Idaho | 46 | 46 | 48 | 48 | 0 |
| Illinois | 38 | 42 | 42 | 40 | 2 |
| Indiana | 10 | 10 | 11 | 25 | -14 |
| Iowa | 34 | 34 | 33 | 35 | -2 |
| Kansas | 12 | 12 | 15 | 14 | 1 |
| Kentucky | 48 | 47 | 47 | 49 | -2 |
| Louisiana | 9 | 4 | 4 | 4 | 0 |
| Maine | 44 | 44 | 24 | 32 | -8 |
| Maryland | 26 | 24 | 28 | 33 | -5 |
| Massachusetts | 49 | 49 | 50 | 50 | 0 |
| Michigan | 47 | 48 | 49 | 17 | 32 |
| Minnesota | 28 | 37 | 25 | 34 | -9 |
| Mississippi | 5 | 5 | 5 | 5 | 0 |
| Missouri | 7 | 7 | 8 | 9 | -1 |
| Montana | 19 | 20 | 21 | 20 | 1 |
| Nebraska | 8 | 9 | 9 | 11 | -2 |
| Nevada | 43 | 45 | 45 | 47 | -2 |
| New Hampshire | 41 | 43 | 44 | 45 | -1 |
| New Jersey | 25 | 36 | 32 | 30 | 2 |
| New Mexico | 17 | 16 | 10 | 8 | 2 |
| New York | 32 | 30 | 31 | 38 | -7 |
| North Carolina | 6 | 6 | 7 | 10 | -3 |
| North Dakota | 15 | 14 | 14 | 13 | 1 |
| Ohio | 4 | 8 | 6 | 7 | -1 |
| Oklahoma | 1 | 1 | 1 | 1 | 0 |
| Oregon | 33 | 31 | 37 | 36 | 1 |
| Pennsylvania | 45 | 50 | 46 | 42 | 4 |
| Rhode Island | 50 | 23 | 29 | 31 | -2 |
| South Carolina | 37 | 29 | 27 | 26 | 1 |
| South Dakota | 40 | 39 | 39 | 44 | -5 |
| Tennessee | 23 | 22 | 22 | 24 | -2 |
| Texas | 13 | 26 | 18 | 12 | 6 |
| Utah | 22 | 21 | 16 | 15 | 1 |
| Vermont | 20 | 18 | 20 | 16 | 4 |
| Virginia | 39 | 41 | 43 | 41 | 2 |
| Washington | 18 | 17 | 19 | 19 | 0 |
| West Virginia | 27 | 28 | 30 | 29 | 1 |
| Wisconsin | 36 | 40 | 41 | 37 | 4 |
| Wyoming | 31 | 33 | 36 | 27 | 9 |
| District of Columbia | 27 | 30 | 33 | 35 | -2 |
To learn more about how we determined these rankings, read our full methodology here.
Note: This map is part of a series in which we will examine each of the five major components of our 2020 State Business Tax Climate Index.
Taxes make more sense with us in your inbox.
Subscribe to our newsletter for tax insights that cut through the noise—and make sense of it.
Sign Up