Patterns of food consumption have changed considerably over the last 50 years. Economic progress, prosperity, and higher standards of living are generally associated with food declining as a share of consumption.
Fifty years ago, food purchased for home consumption and food services (mostly in the form of prepared food and restaurant meals) accounted for 18.8 percent of personal consumption expenditures in the United States. In 2023, food accounted for only 12.9 percent of personal consumption expenditures. More importantly, the composition of food consumption has changed drastically. As shown below, 68.5 percent of food expenditures (in monetary terms) were for home consumption in 1973. By 2023, this figure had decreased to 51 percent, while prepared meals accounted for 49 percent of food expenditures last year.
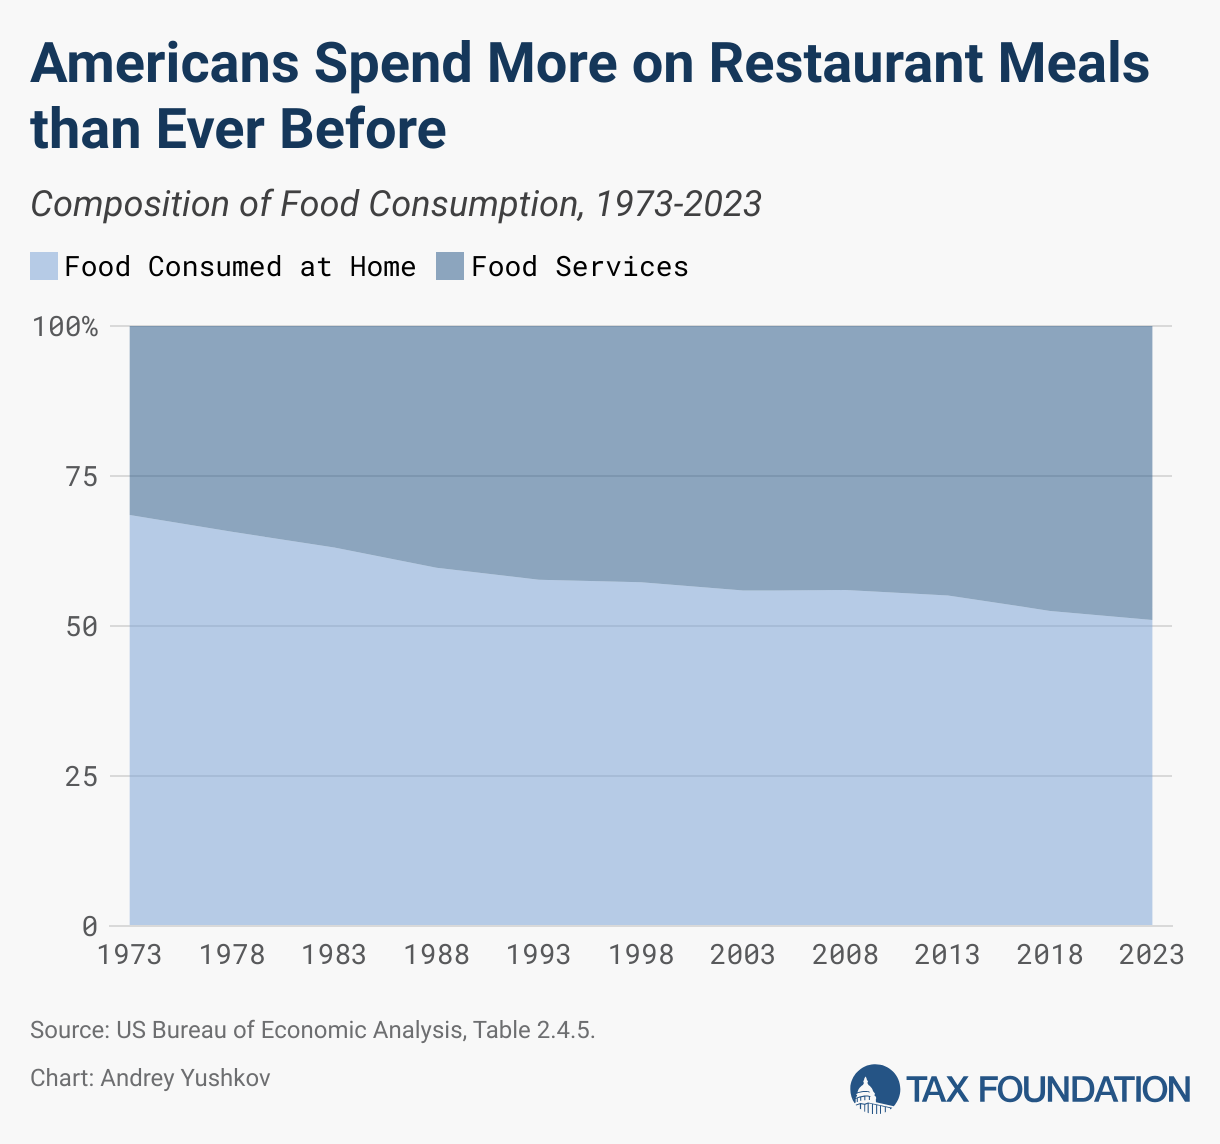
The bottom line is that people now spend much more on prepared food and restaurant meals than they did half a century ago, even as they spend less on food overall. In 2022, consumer spending on food services reached $1 trillion in nominal terms for the first time in the country’s history. By 2023, due to inflationInflation is when the general price of goods and services increases across the economy, reducing the purchasing power of a currency and the value of certain assets. The same paycheck covers less goods, services, and bills. It is sometimes referred to as a “hidden tax,” as it leaves taxpayers less well-off due to higher costs and “bracket creep,” while increasing the government’s spending power. and robust spending growth, this figure increased to $1.17 trillion.
For state and local policymakers, this trend toward restaurant meals and prepared foods offers an opportunity to generate additional taxA tax is a mandatory payment or charge collected by local, state, and national governments from individuals or businesses to cover the costs of general government services, goods, and activities. revenue with relatively minimal effort. In most US states, prepared food—unlike food purchased for home consumption, which is often tax-exempt—is subject to the general sales taxA sales tax is levied on retail sales of goods and services and, ideally, should apply to all final consumption with few exemptions. Many governments exempt goods like groceries; base broadening, such as including groceries, could keep rates lower. A sales tax should exempt business-to-business transactions which, when taxed, cause tax pyramiding. . Therefore, increased spending on restaurant meals automatically leads to higher sales tax receipts. As sales tax bases erode in most states, having an element of the base that grows consistently is very attractive. This is especially true as it helps cover gaps in other areas, including consumer digital goods and services that are not yet taxed in many states. Additionally, a significant portion of food services are consumed by visitors, tourists, and other nonresidents, which incentivizes policymakers to raise the tax rate on prepared food and restaurant meals above the general sales tax rate.
The largest US cities generally have higher sales tax rates compared to their smaller counterparts in states where local sales taxes are authorized. Additionally, 13 of the 50 largest cities impose extra meals taxes—i.e., special taxes that apply to purchases of prepared foods for immediate consumption—while 37 do not charge a higher tax on meals than on other goods. The map and table below show the rates that apply to prepared food and restaurant meals in the 50 largest US cities, as well as changes in those rates from 2012 to 2024. The highest combined tax rates on meals (including both sales taxes and additional meals taxes, where applicable) are found in Minneapolis, MN (12.03 percent); Chicago, IL (up to 11.75 percent); Virginia Beach, VA (11.5 percent); Kansas City, MO (10.85 percent); and Seattle, WA (10.35 percent). The rates are also equal to or greater than 10 percent in Long Beach and Oakland, CA, and Washington, DC. Alone among major cities, Portland, OR, has no tax on restaurant meals, as Oregon forgoes a sales tax, nor is there a city meals tax. Among the largest cities where sales taxes are authorized, the lowest rates are in Baltimore, MD; Detroit, MI; and Louisville, KY, each at 6 percent.
In 29 cities, combined meals tax rates increased over the past decade; in 19 cities, they remained constant; and only two cities—Phoenix, AZ, and Denver, CO—experienced rate decreases. All the large cities on the West Coast, except San Diego, CA, were among those with meals tax increases. The biggest increases occurred in Milwaukee, WI (+2.3 percentage points); Kansas City, MO (+1.77 percentage points); Long Beach and Oakland, CA (+1.5 percentage points); Minneapolis, MN (+1.25 percentage points); and Tulsa, OK (+1.02 percentage points).
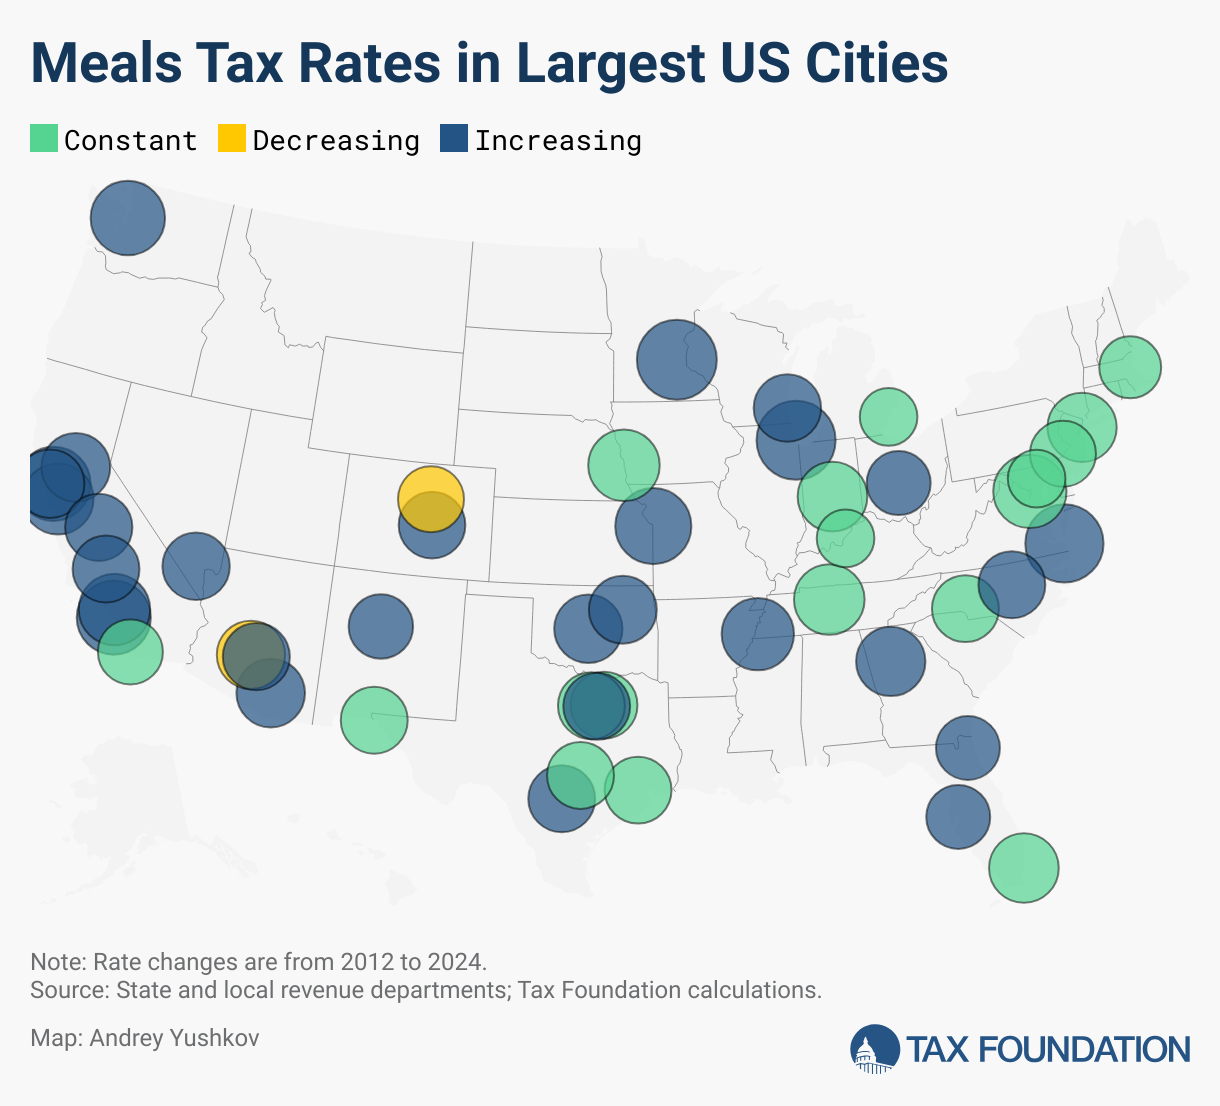
Table 1. Meals Tax Rates in the 50 Largest US Cities
| Population Rank | City | State | General Sales Tax | Additional Meals Tax | Combined Tax on Meals (2024) | Combined Rank (2024) | Combined Tax on Meals (2012) | Difference (2024 - 2012) |
|---|---|---|---|---|---|---|---|---|
| 1 | New York City | NY | 8.875% | 0.00% | 8.88% | 17 | 8.88% | 0.00% |
| 2 | Los Angeles | CA | 9.50% | 0.00% | 9.50% | 10 | 8.75% | 0.75% |
| 3 | Chicago | IL | 10.25% | 1.50% | 11.75% | 2 | 10.75% | 1.00% |
| 4 | Houston | TX | 8.25% | 0.00% | 8.25% | 28 | 8.25% | 0.00% |
| 5 | Phoenix | AZ | 8.60% | 0.00% | 8.60% | 22 | 9.30% | -0.70% |
| 6 | Philadelphia | PA | 8.00% | 0.00% | 8.00% | 39 | 8% | 0.00% |
| 7 | San Antonio | TX | 8.25% | 0.00% | 8.25% | 28 | 8.13% | 0.12% |
| 8 | San Diego | CA | 7.75% | 0.00% | 7.75% | 41 | 7.75% | 0.00% |
| 9 | Dallas | TX | 8.25% | 0.00% | 8.25% | 28 | 8.25% | 0.00% |
| 10 | Jacksonville | FL | 7.50% | 0.00% | 7.50% | 43 | 7% | 0.50% |
| 11 | Austin | TX | 8.25% | 0.00% | 8.25% | 28 | 8.25% | 0.00% |
| 12 | Fort Worth | TX | 8.25% | 0.00% | 8.25% | 28 | 8.25% | 0.00% |
| 13 | San Jose | CA | 9.375% | 0.00% | 9.38% | 12 | 8.50% | 0.87% |
| 14 | Columbus | OH | 7.50% | 0.00% | 7.50% | 43 | 6.75% | 0.75% |
| 15 | Charlotte | NC | 7.25% | 1.00% | 8.25% | 28 | 8.25% | 0.00% |
| 16 | Indianapolis | IN | 7.00% | 2.00% | 9.00% | 14 | 9% | 0.00% |
| 17 | San Francisco | CA | 8.625% | 0.00% | 8.63% | 20 | 8.50% | 0.12% |
| 18 | Seattle | WA | 10.35% | 0.00% | 10.35% | 5 | 10% | 0.35% |
| 19 | Denver | CO | 4.00% | 4.00% | 8.00% | 39 | 8.10% | -0.10% |
| 20 | Oklahoma City | OK | 8.625% | 0.00% | 8.63% | 20 | 8.38% | 0.25% |
| 21 | Nashville | TN | 9.25% | 0.00% | 9.25% | 13 | 9.25% | 0.00% |
| 22 | Washington | DC | 6.00% | 4.00% | 10.00% | 8 | 10% | 0.00% |
| 23 | El Paso | TX | 8.25% | 0.00% | 8.25% | 28 | 8.25% | 0.00% |
| 24 | Las Vegas | NV | 8.375% | 0.00% | 8.38% | 25 | 8.10% | 0.27% |
| 25 | Boston | MA | 6.25% | 0.75% | 7.00% | 46 | 7% | 0.00% |
| 26 | Detroit | MI | 6.00% | 0.00% | 6.00% | 47 | 6% | 0.00% |
| 27 | Portland | OR | 0.00% | 0.00% | 0.00% | 50 | 0% | 0.00% |
| 28 | Louisville | KY | 6.00% | 0.00% | 6.00% | 47 | 6% | 0.00% |
| 29 | Memphis | TN | 9.75% | 0.00% | 9.75% | 9 | 9.25% | 0.50% |
| 30 | Baltimore | MD | 6.00% | 0.00% | 6.00% | 47 | 6% | 0.00% |
| 31 | Milwaukee | WI | 7.90% | 0.50% | 8.40% | 24 | 6.10% | 2.30% |
| 32 | Albuquerque | NM | 7.625% | 0.00% | 7.63% | 42 | 7.00% | 0.63% |
| 33 | Tucson | AZ | 8.70% | 0.00% | 8.70% | 19 | 8.10% | 0.60% |
| 34 | Fresno | CA | 8.35% | 0.00% | 8.35% | 26 | 7.98% | 0.38% |
| 35 | Sacramento | CA | 8.75% | 0.00% | 8.75% | 18 | 7.75% | 1.00% |
| 36 | Mesa | AZ | 8.30% | 0.00% | 8.30% | 27 | 8.05% | 0.25% |
| 37 | Atlanta | GA | 8.90% | 0.00% | 8.90% | 16 | 8% | 0.90% |
| 38 | Kansas City | MO | 8.85% | 2.00% | 10.85% | 4 | 9.08% | 1.77% |
| 39 | Colorado Springs | CO | 8.20% | 0.00% | 8.20% | 38 | 7.40% | 0.80% |
| 40 | Omaha | NE | 7.00% | 2.50% | 9.50% | 10 | 9.50% | 0.00% |
| 41 | Raleigh | NC | 7.25% | 1.00% | 8.25% | 28 | 7.75% | 0.50% |
| 42 | Miami | FL | 7.00% | 2.00% | 9.00% | 14 | 9% | 0.00% |
| 43 | Virginia Beach | VA | 6.00% | 5.50% | 11.50% | 3 | 10.50% | 1.00% |
| 44 | Long Beach | CA | 10.25% | 0.00% | 10.25% | 6 | 8.75% | 1.50% |
| 45 | Oakland | CA | 10.25% | 0.00% | 10.25% | 6 | 8.75% | 1.50% |
| 46 | Minneapolis | MN | 9.025% | 3.00% | 12.03% | 1 | 10.78% | 1.25% |
| 47 | Bakersfield | CA | 8.25% | 0.00% | 8.25% | 28 | 7.25% | 1.00% |
| 48 | Tulsa | OK | 8.517% | 0.00% | 8.52% | 23 | 7.50% | 1.02% |
| 49 | Tampa | FL | 7.50% | 0.00% | 7.50% | 43 | 7% | 0.50% |
| 50 | Arlington | TX | 8.25% | 0.00% | 8.25% | 28 | 8% | 0.25% |
(1) In Chicago, IL, the maximum restaurant tax rate (1.5%) applies to downtown and surrounding areas, where an additional 1% tax is imposed by the Metropolitan Pier and Exposition Authority (MPEA). In other areas, this tax is 0.5%.
(2) In Denver, CO, the combined tax on prepared food (8%) is lower than the combined tax on general merchandise (8.81%). This difference is due to the self-administered city and county sales tax rates, which are 4% for prepared food and 4.81% for general merchandise.
(3) Most of Kansas City, MO, is located in Jackson County, where the general sales tax rate used in this table (8.85%) applies. The rate is higher in Cass County (9.1%), which also encompasses part of Kansas City.
As we have noted elsewhere, meals tax regimes vary considerably across the states. Some states (e.g., Massachusetts, Rhode Island, South Carolina, Utah, and Virginia) allow all counties and/or localities to impose meals taxes. Other states allow only selected localities, cities, counties, or even resort areas (as in Maryland) to establish meals taxes. New Hampshire and Vermont have a statewide tax. Unlike tax rates in the largest cities, state meals tax regimes are relatively stable and not subject to frequent changes. A good practice from the perspective of transparency and neutrality—which is not followed by many states—is to limit any authorization for meals taxes to rates within a relatively narrow range and to avoid selective tax policies that apply only to specific cities or counties.
Meals taxes are a meaningful source of (mostly) local consumption taxes in the US. As people dine out at restaurants and similar establishments more frequently (or perhaps rely more on prepared foods at the grocery store), prepared food occupies a larger share of personal consumption expenditures and, consequently, a larger portion of the sales tax baseThe tax base is the total amount of income, property, assets, consumption, transactions, or other economic activity subject to taxation by a tax authority. A narrow tax base is non-neutral and inefficient. A broad tax base reduces tax administration costs and allows more revenue to be raised at lower rates. . Since meals taxes are generally difficult to evade and avoid (data from the Bureau of Economic Analysis indicate that dining out does not decrease in places with relatively high meals taxes), they are an attractive revenue-generating tool for state and local policymakers.
This does not, however, make them good policy. While dining out appears to be fairly unaffected by higher taxes, the higher taxes still put a dent in people’s pocketbooks, and policymakers must ask themselves what justification exists for imposing a second layer of tax on restaurant meals. While the general sales tax is designed to fall on a broad range of consumption, special excise taxes are typically justified as ways to disincentivize behavior, internalize some negative externalityAn externality, in economic terms, is a side effect or consequence of an activity that is not reflected in the cost of that activity, and not primarily borne by those directly involved in said activity. Externalities can be caused by either the production or consumption of a good or service and can be positive or negative. , or turn a government program into a user-pays system.
None of this seems to apply to meals taxes. Local governments aren’t trying to get people to dine out less. Eating prepared foods does not impose significant social costs that the government needs to offset. And there are no significant added governmental costs associated with people dining out. The chief justification for a unique tax on meals would appear to be that dining is relatively inelastic and the tax is partly exported: people will dine out with or without the tax, and some decent share of the tax will be borne by nonresidents.
These considerations are not irrelevant, of course. Economists tend to favor taxes that do less to distort economic decision-making. But special taxes on particular consumer choices should have some further justification as well, which is often lacking with meals taxes.
Furthermore, while special meals taxes generally meet the principle of revenue adequacy, policymakers should consider issues related to stability (as dining out often declines during times of crisis), transparency, and neutrality (since neighboring states and localities may have significantly different tax rates that are difficult to anticipate). States would do better to broaden the sales tax base to include currently exempt classes of final consumption than to impose disproportionate taxes on prepared foods. Until that happens, consumers should also be aware of high and rising meals tax rates in certain areas and plan their dining budgets accordingly.
Stay informed on the tax policies impacting you.
Subscribe to get insights from our trusted experts delivered straight to your inbox.
Subscribe