The latest tax gapThe tax gap is the difference between taxes legally owed and taxes collected. The gross tax gap in the U.S. accounts for at least $441 billion in lost revenue each year, according to the latest estimate by the IRS (2011 to 2013), suggesting a voluntary taxpayer compliance rate of 83.6 percent. The net tax gap is calculated by subtracting late tax collections from the gross tax gap: from 2011 to 2 report from the IRS has generated much media attention—and much misunderstanding. Indeed, a headline from CBS News reads, “Americans failed to pay record $688 billion in taxes in 2021, IRS says. Look for more audits.”
That headline is attention-getting but not quite right. First, the IRS report is not an estimate of how much Americans failed to pay in taxes in 2021. The IRS admits there is insufficient data to estimate the amount of compliance in 2021. So instead, the IRS used past estimates of taxpayer behavior, such as the 2014-2016 period, to project compliance rates for 2020 and 2021, assuming taxpayers behaved the same as they did in the past.
Projections are much less certain than actual estimates. As the IRS report explains, “TaxA tax is a mandatory payment or charge collected by local, state, and national governments from individuals or businesses to cover the costs of general government services, goods, and activities. law and the level of economic activity can affect the tax gap.” Indeed, the last IRS tax gap report spanned the 2017 to 2019 time period, which included the tax year before the Tax Cuts and Jobs Act took effect and the two years following. Averaging the tax gap across two different tax codes is questionable.
Next, while $688 billion sounds like a big number and is touted as a big increase from prior years, it is hardly different as a share of the economy than the tax gap figures from prior years. As the nearby table shows, the 2.9 percent gross tax gap in 2021 is two-tenths of one percentage point higher than the 2.7 percent estimate from 2014-2016. This 7 percent increase makes for a much less dramatic headline.
We see a similar story for the net tax gap figure, which accounts for late payments and enforcement revenues. The net tax gap was $625 billion in 2021, or 2.6 percent of GDP. It is three-tenths of a percentage point higher than the 2014 to 2016 estimated tax gap of 2.3 percent, an increase of 12.8 percent.
Tax Gap Estimates for Tax Years 2014-2016 and Projections for 2017-2019, 2020, and 2021
| 2014-2016 Estimate | 2017-2019 Projection Revised | 2020 Projected | 2021 Projected | |
|---|---|---|---|---|
| In Billions of Current U.S. Dollars | ||||
| Estimated Total True Tax Liability | $3,307 | $3,645 | $3,902 | $4,565 |
| Gross Tax Gap | $496 | $550 | $601 | $688 |
| Tax Paid Voluntarily and Timely | $2,811 | $3,095 | $3,301 | $3,877 |
| Enforced/Paid Late | $68 | $70 | $63 | $63 |
| Net Tax Gap | $428 | $480 | $538 | $625 |
| Voluntary Compliance Rate | 85.0% | 84.9% | 84.6% | 84.9% |
| Net Compliance Rate | 87.0% | 86.8% | 86.2% | 86.3% |
| As a Share of GDP | ||||
| Estimated Total True Tax Liability | 18.1% | 17.7% | 18.3% | 19.3% |
| Gross Tax Gap | 2.7% | 2.7% | 2.8% | 2.9% |
| Tax Paid Voluntarily and Timely | 15.4% | 15.0% | 15.5% | 16.4% |
| Enforced/Paid Late | 0.4% | 0.3% | 0.3% | 0.3% |
| Net Tax Gap | 2.3% | 2.3% | 2.5% | 2.6% |
| Calendar Year GDP | $18,236 | $20,597 | $21,323 | $23,594 |
The Tax Gap Is a Composite of Three Tax Gaps
The IRS points to three broad contributors to the tax gap: the nonfiling tax gap, the underreporting tax gap, and the underpayment tax gap. The projected tax gaps in 2020 and 2021 are primarily driven by underreporting and nonfiling. These two shortfalls combine for $619 billion of the projected $688 billion gross tax gap in 2021.
The underreporting tax gap results, as the name indicates, from people underreporting the correct amount of income on their tax returns. According to the IRS, the main culprit is the underreporting of business income, which totaled $182 billion in 2021. Across all income types, underreporting accounts for 79 percent of the projected gross tax gap in 2021.
Ten percent of the projected tax gap is caused by taxpayers paying less than what they owe when they submit their tax returns. Of the $68 billion in underpayments, $57 billion stems from individuals who underpay.
Individual Taxpayers Are Most Responsible for the Tax Gap
In 2021, corporations accounted for 7 percent of the gross tax gap. By contrast, individual taxpayers made up 60 percent.
In specific areas, corporate underreporting constituted 6 percent of the gross tax gap while corporate underpayments constituted just 1 percent. Meanwhile, individual underreporting composed 58 percent of the gross tax gap while individual underpayments constituted 8 percent.
Interestingly, filing issues with employment taxes—such as self-employment taxes and uncollected FICA taxes—constituted 32 percent of the projected 2021 tax gap.
The data suggests that corporations are some of the most compliant taxpayers in the U.S. Looking at the gross tax gap as a share of tax paid voluntarily and timely, that ratio was 17.4 percent for corporations in 2021 compared to 23.6 percent for individuals.
The IRS Absolves Congress and Itself from Contributing to the Tax Gap
A missing element of the IRS tax gap report is the IRS’s own tax enforcement and management failings, not to mention the poor manner in which Congress has designed the tax code. As we have reported previously, despite the IRS’s best efforts, it has been unable to stem the growth in improper payments in programs such as the Child Tax CreditA tax credit is a provision that reduces a taxpayer’s final tax bill, dollar-for-dollar. A tax credit differs from deductions and exemptions, which reduce taxable income rather than the taxpayer’s tax bill directly., Earned Income Tax Credit (EITC), and other credit programs.
In 2022, for example, the Inspector General for Tax Administration estimated that $26 billion of the $98 billion in refundable tax credits paid out that year were overpayments. These overpayments result from taxpayer errors, confusion, or outright fraud. Some of these issues are due to IRS failures, but faulty program design and complexity contribute to taxpayer errors and confusion.
Errors in the EITC program have been documented for years. Based on data available on PaymentAccuracy.gov, between 2004 and 2022, the EITC error rate averaged 25 percent. EITC overpayments during those 18 years totaled more than $350 billion after adjusting for inflationInflation is when the general price of goods and services increases across the economy, reducing the purchasing power of a currency and the value of certain assets. The same paycheck covers less goods, services, and bills. It is sometimes referred to as a “hidden tax,” as it leaves taxpayers less well-off due to higher costs and “bracket creep,” while increasing the government’s spendin.
It is also worth considering how much of the tax gap is caused by the IRS’s outdated systems and technology. The IRS’s National Taxpayer Advocate has been critical of the IRS for failing to implement scanning technology to digitally input paper tax returns into their computer system. During the 2022 filing season, the IRS had a backlog of 21 million paper tax returns that had to be keystroked into the computer system by hand.
The lack of modern technology can lead to human errors that may contribute to the tax gap.
100 Percent Compliance Is Not Enough
Many press reports give readers the impression that if the IRS could just close the tax gap, it would dramatically solve Washington’s fiscal problems. In reality, it would fall short.
The tax gap is based on the IRS’s benchmark estimate of how much the government would collect if taxpayers were 100 percent compliant, what they call the “Estimated Total True Tax Liability.” This, of course, is an ideal that has never been achieved in any tax system in history. Markets and people are remarkably adept at altering their behavior to minimize their tax burden. Compared to the rest of the world, the United States does not have a unique problem with tax evasion, and contrary to what headlines imply, is actually below average compared to tax gaps across the developed world.
However, as the nearby chart illustrates, even the most optimistic estimates of how much revenue the federal government could collect fall short of how much it spent as a percentage of GDP.
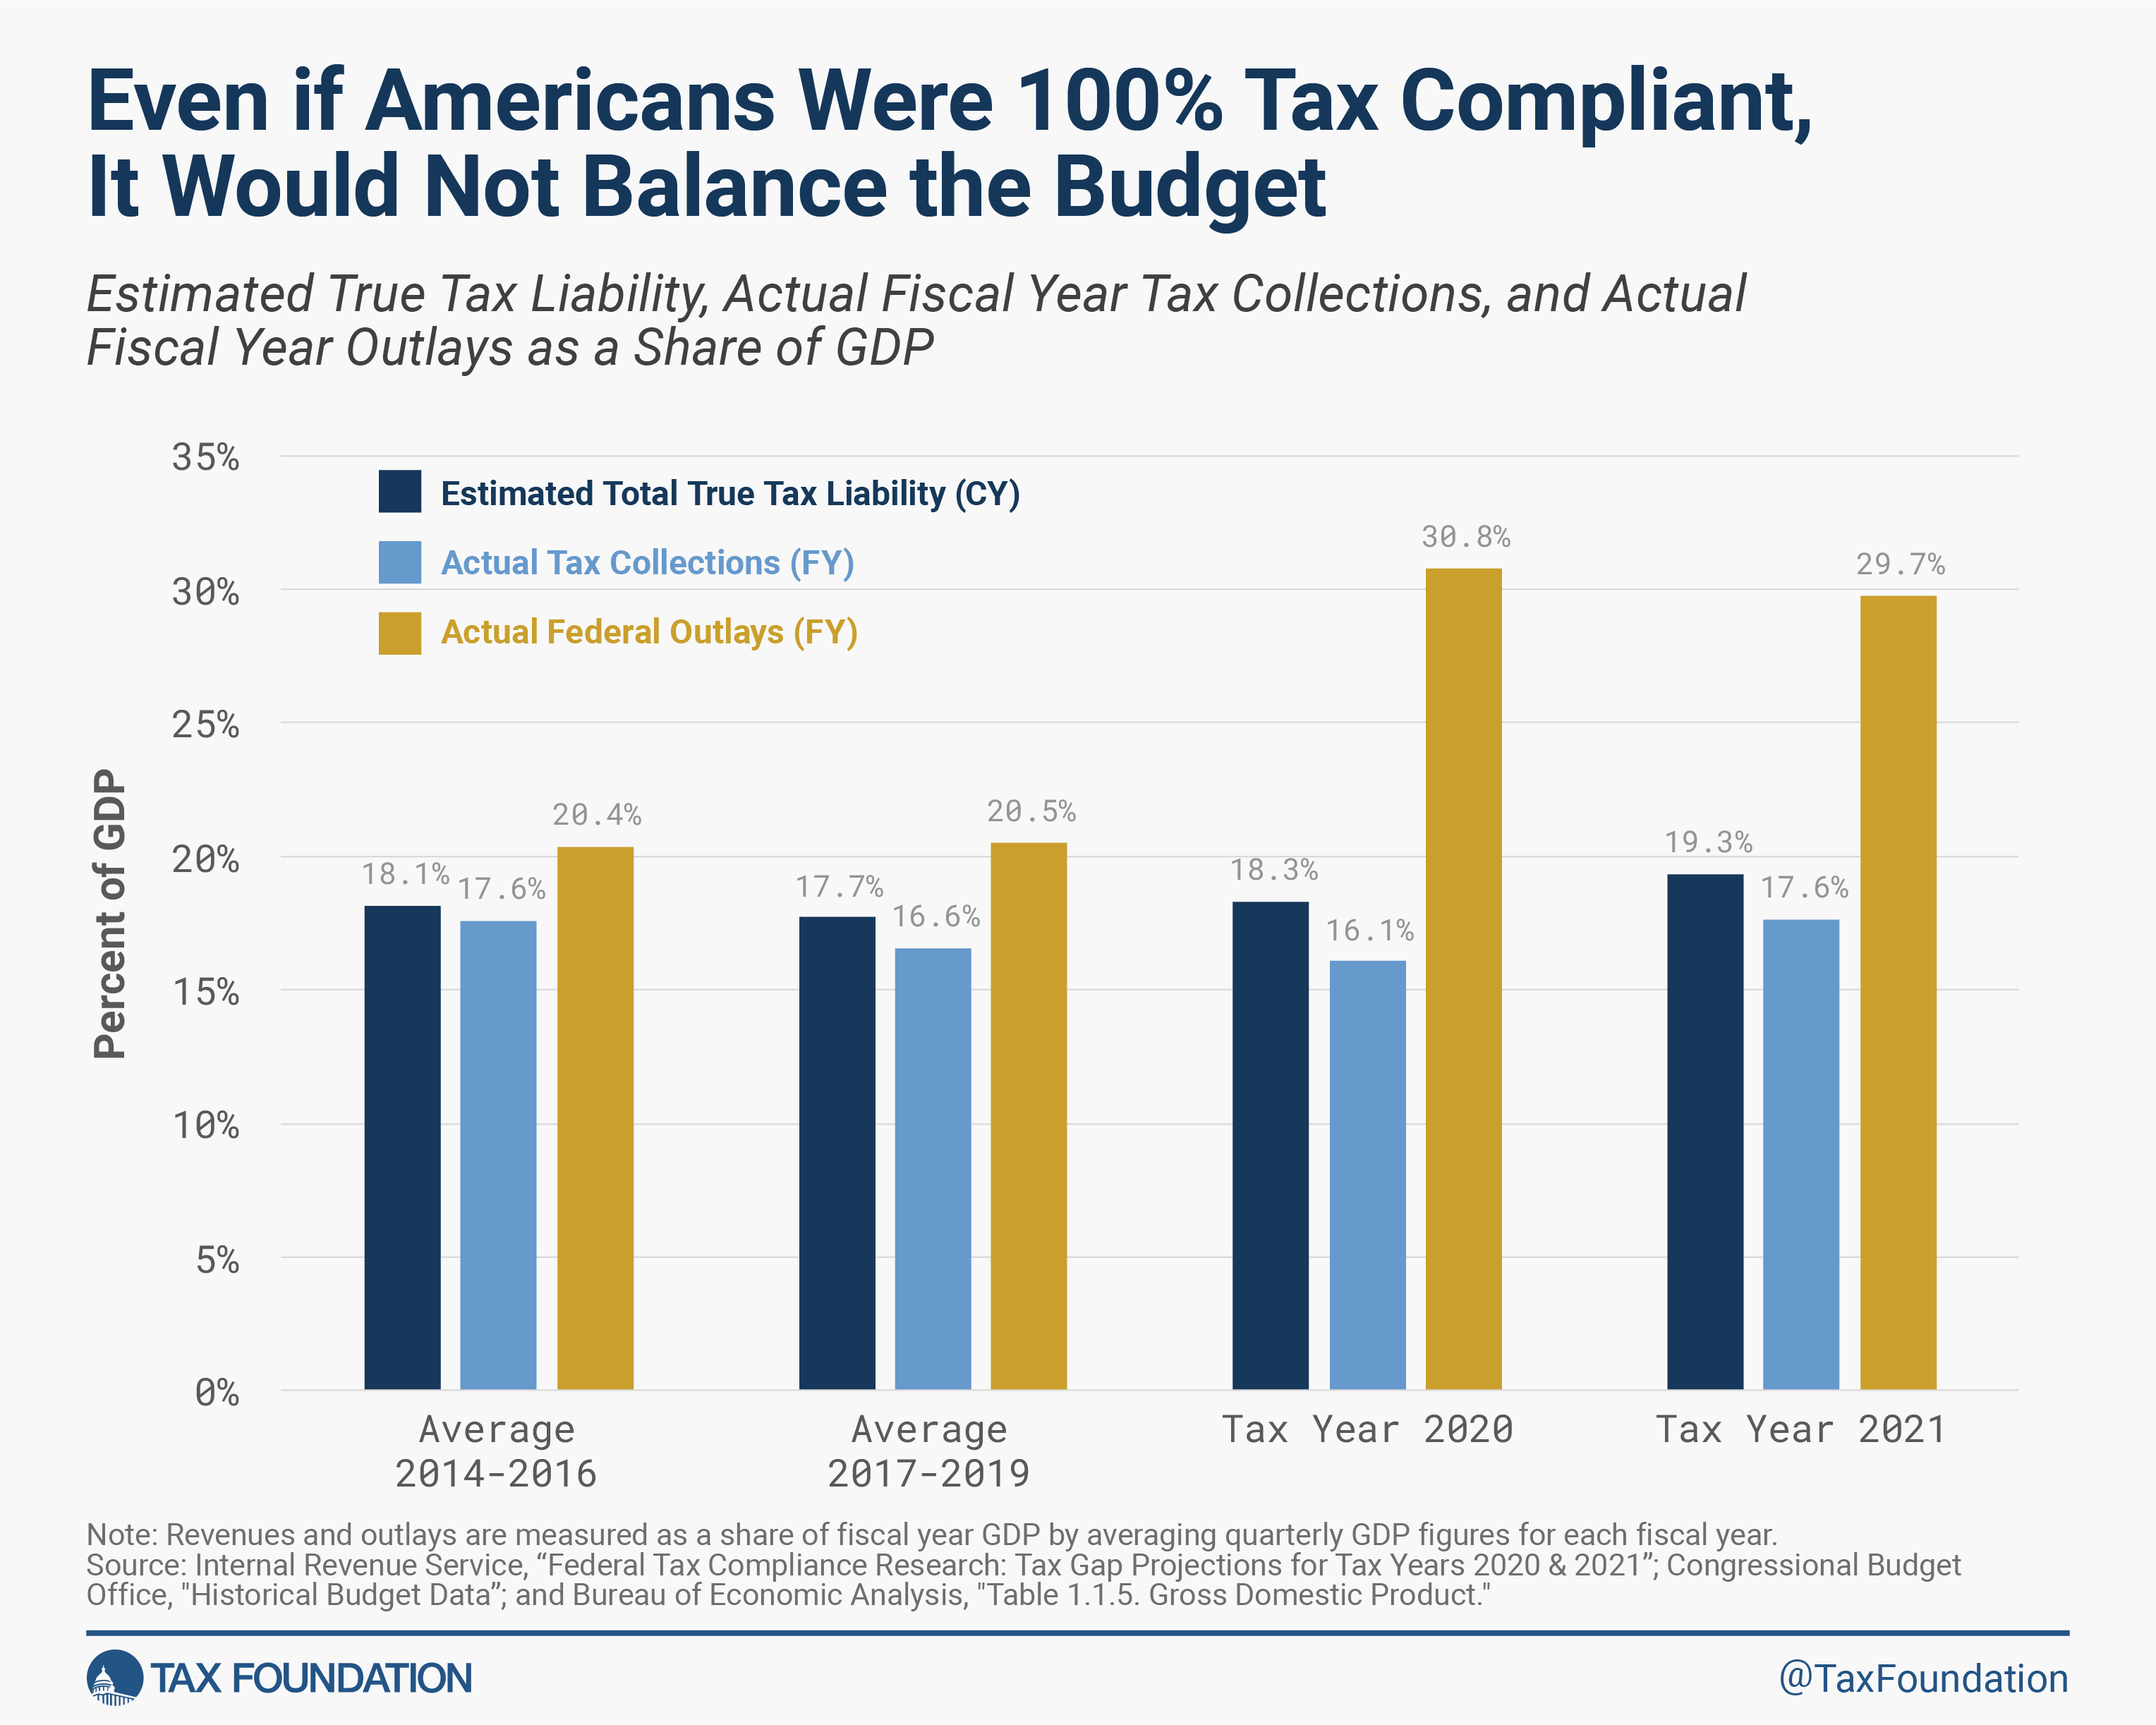
The measurements do not perfectly overlap. CBO’s revenue figures include additional types of taxes not in the IRS data, and both revenue and outlay figures from CBO cover fiscal years compared to tax years for the IRS data.
The overall picture shows that even perfect tax compliance—an impossible goal—would fall short of eliminating the deficit. While it would be unrealistic to expect revenues to match the level of spending during the pandemic years of 2020 and 2021, 100 percent tax compliance would have fallen well short of matching federal outlays even in pre-pandemic years, and it will continue to fall short moving forward. CBO projects the budget deficit as a share of GDP will reach 5.9 percent in 2023 and climb to 7.3 percent by 2033, compared to a net tax gap that currently averages between 2.3 percent and 2.6 percent of GDP.
While simplifying the tax code to improve tax compliance would be welcome, the inability of 100 percent tax compliance to narrow the federal deficit further proves that Washington has a spending problem, not a tax problem.
Taxes make more sense with us in your inbox.
Subscribe to our newsletter for tax insights that cut through the noise—and make sense of it.
Sign Up