Counterintuitive results always make good copy, so the Institute for Policy Studies (IPS) has a winner with a new analysis claiming that “New Data Shows Wealth Expands After Higher State Taxes on High-Income Earners.” But this is not at all what the data show. IPS only succeeds in demonstrating that America has more millionaires than it used to, not that high-taxA tax is a mandatory payment or charge collected by local, state, and national governments from individuals or businesses to cover the costs of general government services, goods, and activities. states are doing well in attracting or retaining them.
No study can include everything, but readers of the IPS report might be puzzled by a surprising omission: any sort of baseline whatsoever against which to compare the supposedly impressive outcomes in high-tax states. For instance, the study touts an increase in the number of Massachusetts filers with $1 million or more in nominal AGI between 2018 and 2022—a period when incomes grew rapidly across the country (up almost 12 percent in nominal terms), and when inflationInflation is when the general price of goods and services increases across the economy, reducing the purchasing power of a currency and the value of certain assets. The same paycheck covers less goods, services, and bills. It is sometimes referred to as a “hidden tax,” as it leaves taxpayers less well-off due to higher costs and “bracket creep,” while increasing the government’s spending power. ran hot. But it never mentions that Massachusetts’ performance is actually quite poor compared to the national average, letting the figure stand alone.
Similarly, the study cites a large increase in the number of households with nominal net worths above $1 million between 2010 and 2024, even though that’s true everywhere, due to income growth, inflation across the past 14 years, and, particularly, skyrocketing housing values since the pandemic, which drove up household net worth. Regrettably, the IPS study again provides no baseline, never comparing these high-tax states against national averages, let alone the performance of notably low-tax states. To do so, of course, would have obliterated the study’s thesis. Even with the years and states the Institute for Policy Studies chose, the data show exactly what we would expect: higher taxes suppress economic growth.
The Institute for Policy Studies (IPS) study considers four states that are currently contemplating or have recently implemented higher taxes on high earners and high-net-worth individuals: Massachusetts, New York, Rhode Island, and Washington. Of these, only two—New York and Massachusetts—have particularly high taxes already, and crucially, Massachusetts’ recent millionaires’ tax went into effect after some of the data on which they are relying, meaning that across one of their two measures, they are actually looking at the Commonwealth’s performance before it joined the ranks of notably high-tax states.
Beginning in 2023, Massachusetts implemented a high-earners surtaxA surtax is an additional tax levied on top of an already existing business or individual tax and can have a flat or progressive rate structure. Surtaxes are typically enacted to fund a specific program or initiative, whereas revenue from broader-based taxes, like the individual income tax, typically cover a multitude of programs and services. , abandoning its 5 percent flat rate income tax by imposing a top rate of 9 percent on income above $1 million. The IPS study highlights that, per Internal Revenue Service data, “the number of tax returns that reported an adjusted gross incomeFor individuals, gross income is the total of all income received from any source before taxes or deductions. It includes wages, salaries, tips, interest, dividends, capital gains, rental income, alimony, pensions, and other forms of income. For businesses, gross income (or gross profit) is the sum of total receipts or sales minus the cost of goods sold (COGS)—the direct costs of producing goods, including inventory and certain labor costs. (AGI) of a million dollars or more in Massachusetts has grown by 36 percent between 2018 and 2022,” noting that 2023 statistics are not yet available.
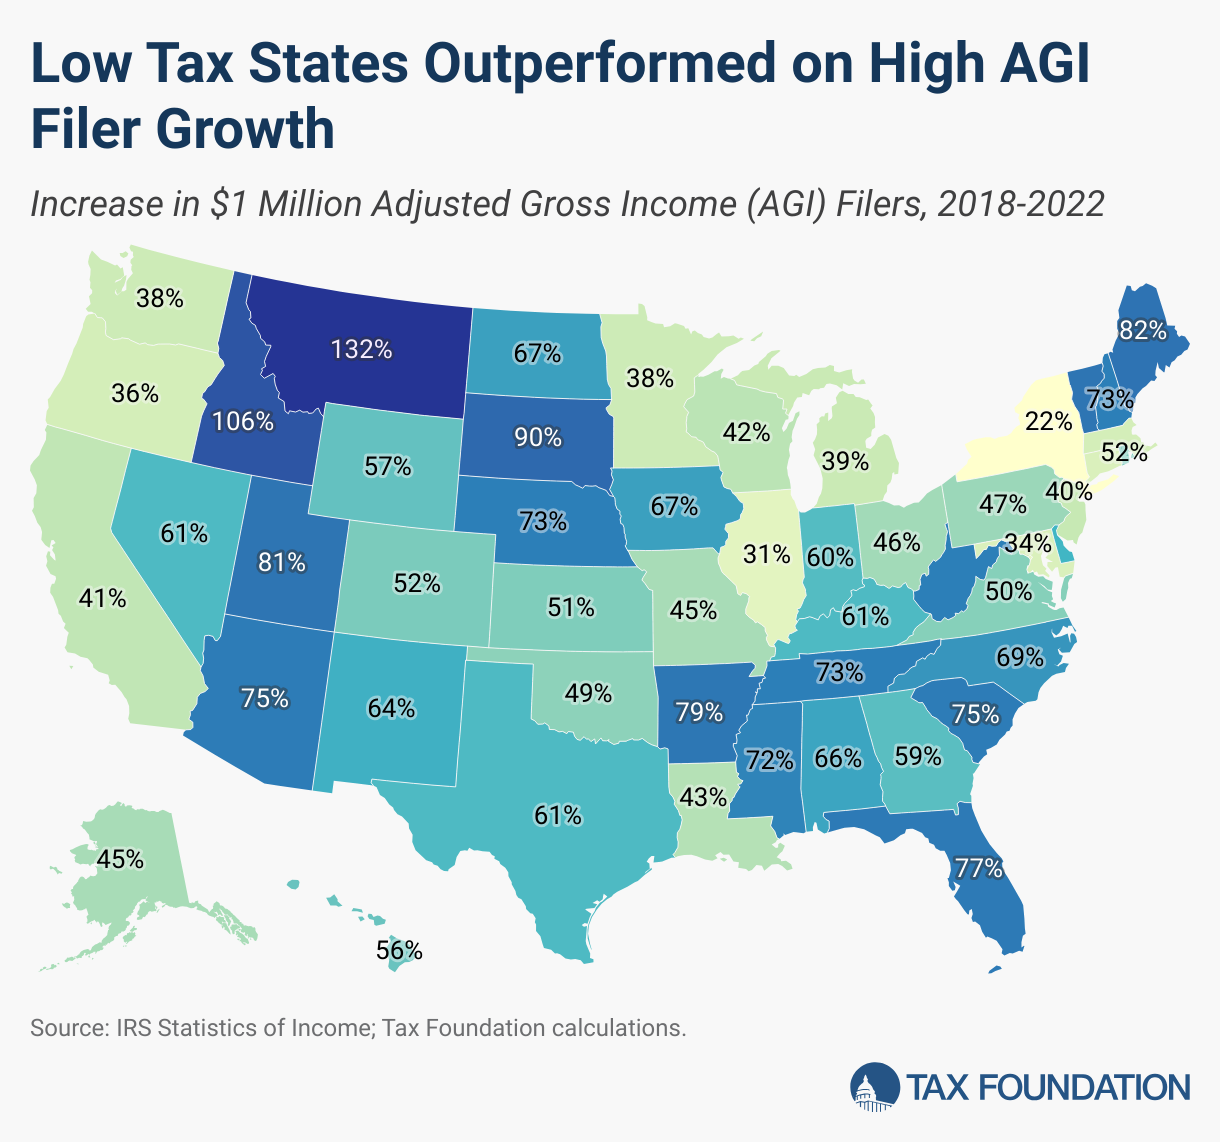
The relevance of data ending before the tax increase went into effect is unclear at best. But even for the years measured, when Massachusetts’ tax burdens were above average but nowhere near as high as now, the 36 percent increase in federal tax returns with an AGI of $1 million or more is far less impressive when compared to a national average of 49 percent, let alone against the 61 percent, 75 percent, and 77 percent increases in Texas, Arizona, and Florida, respectively—three notably low-tax states.
And the performance of a state like Massachusetts is particularly anemic against the boom in the low-tax mountain west, where Utah’s 81 percent increase, Idaho’s 106 percent increase, and Montana’s 132 percent increase are particularly astonishing. All three states have cut taxes in recent years.
Incomes rose everywhere in recent years—in low- and high-tax states alike—buoyed by a booming stock market and aided by robust federal pandemic relief programs that spiked incomes and increased profits. Observing that incomes rose in Massachusetts between 2018 and 2022 (which doesn’t even cover any years in which the new tax was in effect) is meaningless in the absence of a comparison to other states’ performance.
Of course, taxes aren’t the only reason a state might have seen its growth in high AGI filers either trail or outpace national averages. Greater remote work mobility allowed some workers to maximize on any number of preferences, which might include taxes and cost of living but could also involve moving closer to relatives, or finally getting that place in the mountains or at the beach. But there is nothing about Massachusetts’ 36 percent increase, or New York’s 22 percent, that offers the slightest support for IPS’s thesis that high taxes are consistent with high income growth. The same applies to the low growth in the Pacific Northwest, and for Connecticut, Illinois, Maryland, and other high-tax states.
The IPS study also touts the increase in households with a net worth of $1 million or more, citing a 108 percent increase in Massachusetts between 2010 and 2022, and a further large increase between 2022 and 2024, citing a commercial dataset. The study notes growth in New York and Rhode Island across this metric as well, but does not provide statistics for how many additional households crossed the $1 million threshold. Of course, even setting aside the substantial nationwide economic growth between 2010 and 2024, using a nominal $1 million threshold across 14 years is apples-and-oranges: $1 million in 2010 dollars is the equivalent of $1.33 million in 2024 dollars.
Still, at first blush, a 108 percent increase in the number of millionaire households in Massachusetts between 2010 and 2022 may seem like a lot, but again, the report fails to provide any context. According to the Federal Reserve’s Survey of Consumer Finances, the number of millionaire houses nationwide grew by 115 percent during that period—slightly faster than in Massachusetts. (The proprietary data purchased by IPS may not be a precise match for the Federal Reserve data.)
But what of the increase from 2022 to 2024? For this period, Massachusetts did have its new millionaires’ tax in effect, and the commercial dataset shows a further significant increase in the number of millionaire households in the state. Regrettably, there’s once again a telling omission: IPS doesn’t provide us with a national average to serve as a baseline for comparison.
Federal Reserve data on the number of millionaire households can’t help us here, because it currently only goes through 2022. But we would expect that every state saw a sharp uptick in million-dollar households between 2022 and 2024, since this was a period of personal income growth, strong investment returns, and, most importantly, a surge in home values. Overall household net worth levels rose more than 11 percent between the start of 2022 and the end of 2024.
The ultra-wealthy own expensive houses, but housing is often a relatively small part of their portfolio. For upper-middle-class households, by contrast, housing is a large share of net worth, meaning that a substantial increase in home values could push many households above the $1 million threshold.
Between 2022 and 2024, home sales prices jumped 20 percent. But since assessments tend to lag transactions prices, it may be even more pertinent that they rose 29 percent the prior two years, for a nominal increase of 54 percent over the past four years. And for the median homeowner, home equity accounts for about 45 percent of net worth.
The number of households worth at least $1 million in nominal dollars is much higher in 2024 than in 2022 because of investment returns and housing appreciation, and of course it’s dramatically higher than in 2010, a matter of inflation, economic growth, and the fact that in 2010, the US had just emerged from the Great RecessionA recession is a significant and sustained decline in the economy. Typically, a recession lasts longer than six months, but recovery from a recession can take a few years. .
(Data on the aggregate net worth of households with more than $1 million in assets—also referenced in the IPS piece—are not terribly useful, moreover, since if a household’s net worth rose from, say, $950,000 to $1,000,000 last year due to home price appreciation, all $1 million is counted as a wealth increase.)
In short, people’s net worths soared in recent years, driven in large part by skyrocketing home values, pushing many people above $1 million in assets. That’s true everywhere. That it is also true in Massachusetts, New York, or Rhode Island is evidence of precisely nothing.
The Institute for Policy Studies (IPS) report seizes upon the fact that incomes and net worths grew everywhere to make a point about high-tax states, while assiduously avoiding the sort of multistate comparisons that would have revealed the common sense truth that taxes still matter.
Share this article