Key Findings
- Federal policymakers are debating a legislative package focused on boosting U.S. competitiveness vis-a-vis China; however, it currently contains little to no improvements to the U.S. taxA tax is a mandatory payment or charge collected by local, state, and national governments from individuals or businesses to cover the costs of general government services, goods, and activities. code.
- The existing U.S. tax code is biased against capital investment and it is scheduled to worsen over the next decade. The tax bias against domestic investment would further worsen if tax increases included in President Biden’s budget proposal were enacted.
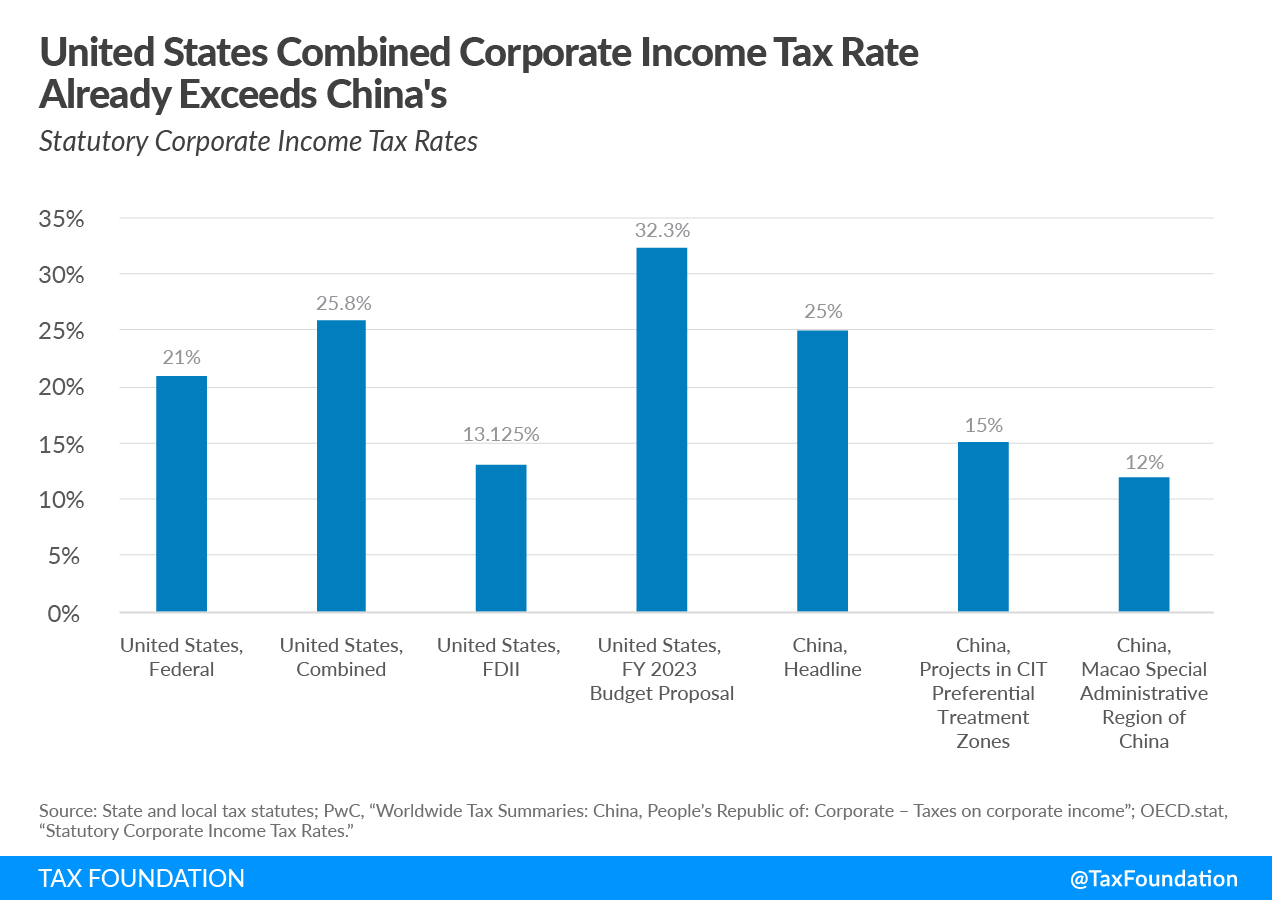
- The federal corporate income taxA corporate income tax (CIT) is levied by federal and state governments on business profits. Many companies are not subject to the CIT because they are taxed as pass-through businesses, with income reportable under the individual income tax. rate in the United States is currently 21 percent, and rises to 25.8 percent when factoring in the average state and local corporate tax rates. Profits earned from highly immobile intangible assets to support exports face a lower tax rate (13.125 percent) due to the deduction for Foreign-Derived Intangible Income (FDII). The headline corporate tax rate in China is 25 percent, and lower rates of 5 percent to 15 percent apply in certain districts.
- The marginal effective tax rate (METR) in the United States under current law is 18.3 percent, compared to 4.8 percent in China, indicating the U.S. places a higher burden on marginal investment than China.
- Within the realm of fiscal policy, rather than focus on providing subsidies to specific U.S. industries, lawmakers should consider improving the baseline tax treatment of domestic investment to boost U.S. competitiveness with China and other countries.
Introduction
Lawmakers on both sides of the aisle are considering a host of policies aimed at specific industries and higher government spending on research & development (R&D) in an effort to ensure the U.S. remains competitive with other countries, particularly China.[1]
The U.S. and China have deep economic ties to each other, as China remains one of the U.S.’s largest trading partners. In 2021, China was the third largest trading partner with the U.S.—the U.S. exported $151 billion worth of goods to China and imported $506 billion in goods from China.[2] The large trade deficit is offset by significant Chinese investment in the U.S., usually in the form of security holdings. As of 2019, China held nearly $1.3 trillion in U.S. government debt, and another $203 billion in U.S. private sector bonds and equities.[3] Due to Chinese restrictions on portfolio investment, U.S. investment in China has mostly taken the form of foreign direct investment (FDI), primarily in manufacturing. For 2019, the U.S. held about $116 billion of FDI stock in China, compared to $59 billion of Chinese FDI stock in the U.S.[4]
As China has continued to develop over the past few decades, its government has increasingly pursued large-scale investments in high-tech innovation, particularly through its state-owned enterprises (SOEs). The country’s investments in artificial intelligence, biotechnology, and telecommunications (5G), and other components of the so-called “fourth industrial revolution” have left U.S. policymakers concerned that the U.S. may be losing ground and led to calls to increase direct government support for these industries.[5]
Most of the proposals focus on providing additional funding, often in the form of industry-specific subsidies, without considering the baseline tax treatment of domestic investments made across industries. Overlooking the baseline tax treatment of capital investment is a costly misstep, as taxes affect decisions about the level and location of investments and affect the competitiveness of the United States with other locations where investment could take place.
Policymakers ought to first consider how the tax system treats capital investment and R&D expenses. We begin the paper with a review of how taxes affect decisions about the level and location of investment before comparing how China and the United States treat capital investment and R&D investment within their corporate tax systems, concluding with implications for U.S. policymakers.
The Tax Burden on Corporations in China and the United States
The corporate income tax affects investment incentives by raising the cost of capital, making it more costly for companies to invest in equipment, factories, and productive technologies. The tax burden on corporate investment consists of the statutory tax rate and structural elements of the corporate tax code such as deductions and credits. The burden of the corporate tax can be evaluated through different measures, particularly the statutory tax rate, the marginal effective tax rate, and the average effective tax rate.
Statutory tax rates affect the location of profits; at the margin, a higher statutory tax rate encourages profit shifting to jurisdictions with lower statutory tax rates.
In the United States, the statutory federal corporate income tax rate is 21 percent. Forty-four U.S. states and the District of Columbia also levy their own corporate income tax,[6] and factoring in the average rate across states, the combined U.S. corporate tax rate reaches 25.8 percent. Profits earned from highly immobile intangible assets to support exports face a lower tax rate (13.125 percent, scheduled to rise to 16.406 percent after 2025) due to the deduction for Foreign-Derived Intangible Income (FDII), discussed in more detail below. Under President Biden’s FY 2023 budget proposal, which proposes raising the federal corporate income tax rate to 28 percent, the combined rate in the U.S. would reach 32.3 percent—higher than that of China and the OECD average excluding the U.S.[7]
The standard statutory corporate income tax rate in China is 25 percent, while certain regions and industries receive preferential rates ranging from 2.5 percent to 15 percent (see Table 1).
| Business Type, Location, or Activity | Rate |
|---|---|
| Qualified new/high-tech enterprises | 15% |
| Encouraged designated key software enterprises and encouraged designated integrated circuits design enterprises | 10% |
| Qualified technology-advanced service enterprises | 15% |
| Qualified small and thin-profit enterprises | 2.5-5% |
| Qualified pollution prevention and control enterprises | 15% |
| Encouraged enterprises in the Western regions | 15% |
| Enterprises established in the Qianhai Shenzhen-Hong Kong Modern Services Industry Cooperation Zone* | 15% |
| Enterprises established in Zhuhai’s Hengqin New Area* | 15% |
| Enterprises established in the Pingtan Comprehensive Experimental Zone* | 15% |
| Enterprises registered and with operational substance in the Hainan Free Trade Port in encouraged industries | 15% |
| Enterprises engaged in substantial production or R&D in key industries in Lingang New Area of the Shanghai Pilot Free Trade Zone | 15% |
|
*— Provided that the enterprise is engaging in projects that fall within the Catalogue for CIT Preferential Treatments of the area Source: PwC, “Worldwide Tax Summaries: China, People’s Republic of: Corporate – Taxes on corporate income,” https://taxsummaries.pwc.com/peoples-republic-of-china/corporate/taxes-on-corporate-income. |
|
The statutory tax rate, however, does not fully reflect the burden of the corporate tax, because structural components such as depreciation deductions also affect the cost of making investments. Measures of effective tax rates capture many other important elements of the corporate tax system and illustrate how the corporate income tax affects incentives about how much to invest or where to locate investment.
The marginal effective tax rate (METR) measures the tax rate a hypothetical new, break-even investment would face, taking into account the statutory tax rate and other structural elements of the tax system such as depreciationDepreciation is a measurement of the “useful life” of a business asset, such as machinery or a factory, to determine the multiyear period over which the cost of that asset can be deducted from taxable income. Instead of allowing businesses to deduct the cost of investments immediately (i.e., full expensing), depreciation requires deductions to be taken over time, reducing their value and disco deductions, limitations on interest deductions, and special rates. The METR is used as an indicator of marginal investment incentives within a jurisdiction; a METR of zero indicates no tax on marginal investments.
The average effective tax rate (AETR) is similar but measures the tax rate for an investment that earns an above-normal return, or does better than breaking even. The AETR is used as an indicator of asset-location incentives; corporations have an incentive to shift high-return assets away from jurisdictions with relatively high AETRs.
If the United States maintained 100 percent bonus depreciationBonus depreciation allows firms to deduct a larger portion of certain “short-lived” investments in new or improved technology, equipment, or buildings in the first year. Allowing businesses to write off more investments partially alleviates a bias in the tax code and incentivizes companies to invest more, which, in the long run, raises worker productivity, boosts wages, and creates more jobs., immediate expensing of R&D, and other policies in place in 2021, its METR would be 11.2 percent, higher than China’s METR of 4.8 percent.[8] Because of scheduled policy changes in the U.S., however, tax treatment of domestic investment will worsen in the next several years.
Accordingly, using a current law baseline to reflect the upcoming changes shows the METR in the United States will reach 18.3 percent after all scheduled changes take place, much higher than in China and the average across industrialized countries (Table 2). Effective tax rates would be higher still if the Biden administration proposals to increase corporate taxes were adopted. Raising the METR and AETR in the United States reduces incentives to increase existing investments and to locate new investments domestically.
Next, we turn to the structural elements of the tax code that produce the higher effective tax rates in the United States.
| Jurisdiction, Notes | Marginal Effective Tax Rate | Average Effective Tax Rate |
|---|---|---|
| China, 2022 | 4.8% | 19.3% |
| United States, current law plus maintain 100% bonus, R&D expensing, EBITDA, and FDII | 11.2% | 21.5% |
| United States, current law | 18.3% | 23.4% |
| United States, Biden FY 2022 budget proposal | 23.7% | 29.5% |
| OECD average | 15.5% | 22.9% |
|
Note: Estimates do not account for R&D tax credits. Source: Estimates from Kyle Pomerleau, and Kyle Pomerleau, “The tax burden on corporations: A comparison of Organisation for Economic Co-operation and Development countries and proposals to reform the US tax system,” American Enterprise Institute, Oct. 13, 2021, https://www.aei.org/research-products/report/the-tax-burden-on-corporations-a-comparison-of-organisation-for-economic-co-operation-and-development-countries-and-proposals-to-reform-the-us-tax-system/. |
||
Depreciation Deductions
Businesses determine their profits by subtracting costs from revenue. Most jurisdictions, however, do not treat capital costs the same as other ordinary business costs such as paying utility bills or workers’ wages, for the purposes of calculating taxable income. Instead, governments set depreciation schedules to specify how different types of assets can be deducted over time.
Over the life of an asset, a business will deduct the capital cost in nominal terms, but in real terms, slower deductions increase the tax burden on investment because inflation and the time value of money erode the value of the deductions. Tax systems requiring depreciation deductions over time rather than immediate deductions when the expense occurs create a bias against investment, leading to a higher effective tax rate. Tax systems allowing full cost recovery through full and immediate deductions are neutral toward investment.
In the United States, purchases of physical capital must follow depreciation schedules set forth in the Modified Accelerated Cost RecoveryCost recovery refers to how the tax system permits businesses to recover the cost of investments through depreciation or amortization. Depreciation and amortization deductions affect taxable income, effective tax rates, and investment decisions. System (MACRS). MACRS details recovery periods of 3, 5, 7, 10, 20, 27.5, and 39 years depending on the type of property purchased. MACRS property with a recovery period of 20 years or less is permitted a special 100 percent deduction in its first year, known as 100 percent bonus depreciation, which provides full cost recovery for qualifying assets. Bonus depreciation, however, is scheduled to drop by 20 percentage points per year beginning in 2023 until it fully phases out after the end of 2026.[9]
Depending on the recovery period, faster depreciation methods may be permitted: 3-, 5-, 7-, and 10-year property may use the 200 percent declining balance method; 15- or 20-year property may use the 150 percent declining balance method; while other property (most prominently, investments in residential and commercial structures) must use the straight-line method.
By preventing full capital cost recovery, the U.S. tax system raises effective tax rates. The scheduled phaseout of bonus depreciation is the largest driver of higher effective tax rates the U.S. will experience in coming years.[10]
| Type of Property | Recovery Period |
|---|---|
| Tractor units for over-the-road use; any race horse over 2 years old when placed in service before Jan. 1, 2009 (Any race horse placed in service after Dec. 31, 2008, and before Jan. 1, 2022, is treated as 3-year property regardless of the age of the race horse.); any other horse (other than a race horse) over 12 years old when placed in service; qualified rent-to-own property (defined later) | 3 years |
| Automobiles, taxis, buses, and trucks; any qualified technological equipment; office machinery (such as typewriters, calculators, and copiers); any property used in research and experimentation; breeding cattle and dairy cattle; appliances, carpets, furniture, etc., used in a residential rental real estate activity; certain geothermal, solar, and wind energy property; any machinery equipment (other than any grain bin, cotton ginning asset, fence, or other land improvement) used in a farming business and placed in service after 2017, in tax years ending after 2017 | 5 years |
| Office furniture and fixtures (such as desks, files, and safes); used agricultural machinery and equipment placed in service after 2017, grain bins, cotton ginning assets, or fences used in a farming business (but no other land improvements); railroad track; any property that does not have a class life and has not been designated by law as being in any other class; certain motorsports entertainment complex property; any natural gas gathering line placed in service after Apr. 11, 2005 | 7 years |
| Vessels, barges, tugs, and similar water transportation equipment; any single-purpose agricultural or horticultural structure; any tree or vine-bearing fruits or nuts; qualified small electric meter and qualified smart electric grid system (defined later) placed in service on or after Oct. 3, 2008 | 10 years |
| Certain improvements made directly to land or added to it (such as shrubbery, fences, roads, sidewalks, and bridges); any retail motor fuels outlet (defined later), such as a convenience store; any municipal wastewater treatment plant; initial clearing and grading land improvements for gas utility property; electric transmission property (that is section 1245 property) used in the transmission at 69 or more kilovolts of electricity placed in service after Apr. 11, 2005; any natural gas distribution line placed in service after Apr. 11, 2005 and before Jan. 1, 2011; any telephone distribution plant and comparable equipment used for two-way exchange of voice and data communications; qualified improvement property placed in service after 2017 | 15 years |
| Farm buildings (other than single-purpose agricultural or horticultural structures); municipal sewers not classified as 25-year property; initial clearing and grading land improvements for electric utility transmission and distribution plants | 20 years |
| Residential rental property | 27.5 years |
| Nonresidential real property | 39 years |
|
Source: Internal Revenue Service, “How to Depreciate Property,” Publication 946, Mar. 3, 2022, https://www.irs.gov/pub/irs-pdf/p946.pdf. |
|
Similarly, for the purposes of corporate income taxes in China, purchases of physical capital assets must be depreciated over periods set forth in law. Notably, however, the longest recovery period in China is 20 years, compared to 39 years in the United States, both applying to structures. Generally, depreciation deductions follow the straight-line method; however, shorter lives or accelerated depreciation methods are permitted for certain types of assets due to their nature or if related to a favored industry such as manufacturing or R&D.
Additionally, from Jan. 1, 2018 to Dec. 31, 2023, newly acquired fixed assets, other than real estate properties, with unit value not exceeding 5 million yuan (US $762,000) are allowed to be fully deducted in the year of acquisition.
| Type of Property | Recovery Period |
|---|---|
| Electronic equipment; production-nature biological assets in the nature of livestock | 3 years |
| Means of transport other than aircraft, trains, and vessels | 4 years |
| Appliances, tools, and furniture, etc., related to production and business operations | 5 years |
| Aircraft, trains, vessels, machinery, mechanisms, and other production equipment; production-nature biological assets in the nature of forestry | 10 years |
| Buildings and structures | 20 years |
|
Source: PwC, “China, People’s Republic of: Corporate –Deductions,” https://taxsummaries.pwc.com/peoples-republic-of-china/corporate/deductions. |
|
Research and Development
China primarily supports R&D through its tax code by offering a generous R&D allowance, or “super deduction.” The super deduction allows businesses to deduct more than 100 percent of their R&D expenses from their taxable incomeTaxable income is the amount of income subject to tax, after deductions and exemptions. Taxable income differs from—and is less than—gross income. . As such, the super deduction is effectively a subsidy for R&D investment. Introduced in 1996, the deduction originally applied to only state-owned enterprises but now covers most private firms.[11]
In 2021, China extended its super deduction until 2023 and increased it to 175 percent, up from 150 percent, and enhanced it further to 200 percent for manufacturing firms.[12] Large firms with negative tax liabilities may also carry forward their credits up to five years, while small and medium-sized enterprises (SMEs) and firms classified as “high and new technology enterprises” may carry forward their credit up to 10 years. In 2017, SMEs accounted for more than half of all R&D tax relief in China.
China supports R&D investment through its tax code in other ways as well. Machinery and equipment used in R&D may be expensed immediately up to 1 million yuan ($152,000) and is then subject to a declining balance method of 40 percent above this cap. Purchases of R&D equipment may also be exempt from tariffs and value-added taxes. High and new technology enterprises and other R&D intensive firms qualify for a reduced corporate tax rate of 15 percent instead of the standard 25 percent.
Finally, taxes on R&D in China may be reduced further if the intellectual property (IP) is held in a patent boxA patent box—also referred to as intellectual property (IP) regime—taxes business income earned from IP at a rate below the statutory corporate income tax rate, aiming to encourage local research and development. Many patent boxes around the world have undergone substantial reforms due to profit shifting concerns. or part of a technology transfer. For example, a Chinese pharmaceutical firm that earned a significant share of its income from licensing its formulas to other firms would receive a reduction on import taxes from additional R&D purchases, an exemption from the corporate tax on the first 5 million yuan ($762,000) in income, and then a 50 percent reduction on its corporate taxes thereafter.[13]
In contrast with super deductions in China, the United States as of 2022 requires R&D expenses to be amortized over five years. Since 1954, companies in the U.S. had been able to fully and immediately deduct their R&D expenses, but due to a change included in the Tax Cuts and Jobs Act (TCJA) of 2017, beginning in 2022 the treatment changed to a five-year write-off period.[14] Research conducted outside of the U.S. must be amortized over 15 years. Spreading the deductions over time disincentivizes R&D investment because it means companies cannot fully deduct their investments in real terms. Canceling the switch to amortization would support R&D investment.
The U.S. also offers support for R&D investment through its tax code. The Economic Recovery Tax Act of 1981 first introduced the R&D tax creditA tax credit is a provision that reduces a taxpayer’s final tax bill, dollar-for-dollar. A tax credit differs from deductions and exemptions, which reduce taxable income rather than the taxpayer’s tax bill directly.,[15] and the credit has been updated and expanded since into four separate credits, two of which target energy and university R&D.
| Credit | Base |
|---|---|
| Regular credit | 20% of QREs above a base amount |
| Alternative simplified credit | 14% of QREs above half of average QREs over the previous three years |
| Energy research credit | 20% of QREs |
| University research credit | 20% of QREs above a base amount |
|
Source: Gary Guenther, “Research Tax Credit: Current Law and Policy Issues for the 114th Congress,” Congressional Research Service, Mar. 3, 2015, https://www.fas.org/sgp/crs/misc/RL31181.pdf. |
|
The regular R&D credit equals 20 percent of a firm’s QREs above a certain baseline level. However, the baseline levels have not been updated since the 1980s.[16] “Established firms” determine the baseline based on QREs from 1984 to 1988, while “start-up” firms calculate their baseline on QREs occurring in the first five tax years after 1993. Due to the complexity of calculating the baseline for the regular credit, taxpayers may use the alternative simplified credit (ASC) instead. Under the ASC, the credit equals 14 percent of QREs above half of the average QREs over the past three years. If the firm has no QREs, the credit equals 6 percent of QREs for the current year.
Despite its relative simplicity, the ASC provides smaller marginal incentives to invest due to smaller credit rates and how the credit is calculated using a moving average: an increase in spending each year increases the base amount of R&D excluded from eligibility for the credit in future years. And although the incremental designs of both the regular credit and the ASC aim to avoid providing windfalls to taxpayers for R&D investment that would have occurred even in the absence of the credit, the Government Accountability Office (GAO) identified numerous such cases. For example, in 2005 it estimated that more than 35 percent of all regular credit claimants received a windfall.[17]
The economic evidence generally finds the R&D tax credit has increased R&D investment and innovation, with positive spillovers for other firms as well.[18] Due to the complexity of the credit and the potential for windfalls, however, in some cases it might be more prudent to simply cut statutory corporate tax rates and improve cost recovery.
Finally, prior to changes made in the U.S. in the 2017 tax reform, it was common for intellectual property developed in the U.S. to end up in an offshore jurisdiction for tax reasons. While the location of IP does not necessarily correlate with activities, such as R&D or management related to IP, the relationship could potentially strengthen over time as countries have begun to create rules to require such activities to take place in the same jurisdiction in order to benefit from reduced tax rates on IP.
In the United States, the policy of FDII was enacted as part of the 2017 tax reform to change incentives that previously led to IP offshoring, and instead create a balance, or even make it more attractive, to keep IP in the U.S.[19] Through FDII, earnings from the sale of products related to IP held in the U.S to foreign customers face a lower tax rate of 13.125 percent. After 2025, the reduced rate is scheduled to increase to 16.406 percent.[20]
On the whole, the United States does not provide particularly large tax breaks for business R&D. According to the OECD, the tax subsidy rate for R&D investments in SMEs and large firms was around 0.07 in 2021 in the United States, compared to 0.08 for SMEs and 0.23 for large firms in China.[21] As a share of GDP, indirect government support through R&D tax incentives amounted to about 0.11 percent in the U.S. in 2018 and 0.07 percent in China in 2017 (latest years available).[22] Both countries also provide direct government support for private sector R&D, amounting to about 0.1 percent of GDP in the United States and 0.07 percent of GDP in China in 2019 (latest years available).[23]
U.S. government funding predominantly goes toward R&D in aerospace, electronics, and professional, technical, and scientific services.[24] Using a broader measure of government R&D support, in FY 2019 the U.S. federal government spent about 0.6 percent of GDP on R&D.[25] For comparison, in 2021 China spent about 2.4 percent of GDP on R&D,[26] though as we will discuss below, R&D investments in China do not necessarily translate into valuable innovation.
Overall, amortization of R&D and a highly complex R&D tax credit in the U.S. are far from ideal, and though the tax treatment of IP was improved by the 2017 tax law changes, it remains highly complex as well.
Business Net Interest Deductions
A firm’s new investments are usually financed with a mix of debt and equity, but the tax treatment of financing sources varies. Typically, debt financing has a tax advantage over equity financing since part of interest expense (or the whole interest payment, depending on the law) is tax-deductible while distributions to equity-holders are not.
In China, interest on loans is generally deductible across businesses. The exceptions are narrowly focused rules designed to prevent earnings stripping, which limit interest deductibility for payments to related parties for companies with debt levels far exceeding equity levels.[27] In particular, financial firms with debt-to-equity ratios exceeding 5 to 1 are subject to the limitations, while the ratio must not exceed 2 to 1 for all other industries.[28] Outside of rules for related-party payments, interest deductions are not limited.
In the United States, the limitation on interest deductions put in place under the 2017 tax law is more stringent because its focus is broader in that it applies to all interest payments, not just related-party payments.[29] Through 2021, the deduction for net interest expense was generally limited to 30 percent of earnings before interest, taxes, depreciation, and amortization (EBITDA), and beginning in 2022, limited to 30 percent of earnings before interest and taxes (EBIT). Disallowed interest expense can be carried forward indefinitely. The change from EBITDA to EBIT further tightens the limit on net interest deductions and increases the tax burden on business investment by making debt-financed investment more expensive for companies with depreciation and amortization expenses.
While the limitation is intended, at least in part, to reduce the tax code’s bias in favor of debt-financed investment,[30] the recent switch from EBITDA to EBIT can create disadvantages for companies undertaking domestic investment. It also diverges from international norms; for instance, most OECD countries limit their interest based on EBITDA, not EBIT.[31]
International Tax Provisions
Another distinction between the two corporate tax systems is that businesses headquartered in China face taxes on their worldwide income,[32] while businesses headquartered in the U.S. face a hybrid system that exempts some worldwide income and taxes other worldwide income above a certain return.
The four main components of the U.S. international tax system, put in place as part of the 2017 tax reform, are the participation exemption, GILTI, FDII, and BEAT.[33]
- The participation exemption moved the U.S. from a worldwide system like that of China towards a territorial system by exempting foreign profits paid back to the U.S. from domestic taxation.
- Global Intangible Low-Tax Income (GILTI) serves as a global minimum tax, under which foreign earnings from intellectual property owned by U.S. companies are taxed by the U.S. GILTI was designed to have a tax rate between 10.5 and 13.125 percent, but interaction effects with other policies mean some companies pay much higher tax rates on GILTI.
- FDII, discussed above, works in tandem with GILTI to incentivize companies to house or bring IP back to the United States by providing a lower tax rate of 13.125 percent on earnings from the use of IP in the United States in creating an export.
- The BEAT is essentially a 10 percent minimum tax meant to prevent foreign and domestic corporations operating in the United States from avoiding domestic tax liability by shifting profits out of the United States.
Both countries must also contend with the global agreement reached through the OECD to change international taxes, consisting of two pillars.[34] Pillar 1 would require large companies to pay more taxes in countries where they have customers and less in countries where their headquarters, employees, and operations are located. Pillar 2 would set up the adoption of a global minimum tax of 15 percent on large corporations.
GILTI, the current U.S. version of a minimum tax on foreign earnings, is different from the global agreement, and further, is overly complicated. How the U.S. will proceed with implementation is highly uncertain, as key differences exist between the current GILTI regime, President Biden’s proposed approach, and the model rules for the global agreement.[35] China is similarly contending with how to implement the two-pillar tax reform plan, noting challenges with several aspects including how to comply with consolidated taxation requirements, which differ from its current approach to taxing multinationals.[36]
The design of the minimum tax gives room to direct business subsidies while penalizing the standard tax credit approach taken in U.S. policy.
The global tax agreement sets a target effective date in 2023, but its implementation hinges on dispersed legislative efforts across more than 130 jurisdictions. The ultimate approach taken by the U.S. will affect cross-border investment decisions as well as profit-shifting incentives for multinational firms. As such, policymakers in the U.S. should consider ways to simplify the U.S. tax code in a manner consistent with the global minimum tax agreement, ensuring a more competitive international system than exists under the GILTI regime today.[37]
Gross Receipts and Value-added Taxes
Outside of the corporate tax system, other elements of the tax system in China may affect business investment decisions, in particular the structure of China’s consumption-based taxes and place-based incentives.
China has a two-tiered system of taxes on business receipts. China collects a value-added tax, or VAT. VATs are designed to tax the value added at each stage of the production process.[38] Under a properly designed VAT, companies deduct the cost of acquiring inputs from the sale of their goods to the next firm down the value chain. Additionally, China collects a gross receipts tax, which is a tax on business revenues.
Gross receipts taxes (GRTs) are more economically harmful than VATs, but China taxes some businesses (usually smaller firms and services firms) with a gross receipts taxGross receipts taxes are applied to a company’s gross sales, without deductions for a firm’s business expenses, like compensation, costs of goods sold, and overhead costs. Unlike a sales tax, a gross receipts tax is assessed on businesses and applies to transactions at every stage of the production process, leading to tax pyramiding., and other businesses, like manufacturers, with a VAT.[39] This difference partly stems from a GRT being simpler than a VAT to collect from smaller firms, and some of the distortion of GRTs is offset in shorter production processes.[40] VATs, on the other hand, have minimal economic harm, as they do not create a tax burden on capital investment.
Until reforms in the 2000s, however, China’s VAT did not allow deductions for the purchase of capital inputs when calculating VAT liability, creating another layer of tax on investment. The Chinese began a major reform to their VAT in 2004, fully enacting it in 2009, which allowed firms to deduct the purchase of most fixed assets, with the exception of buildings and imported capital goods. The result was substantially stronger investment: according to a paper in Economic Policy, from 2005 through 2012, the reforms grew investment by 38.4 percent and productivity by 8.9 percent among firms subject to the reforms.[41]
The United States forgoes a VAT at the national level, but most states and some local governments levy sales taxes. While such levies comprise a smaller share of collections overall relative to the VAT in China, they do fall on business-to-business transactions, which can result in negative effects similar to that of GRTs. Estimates indicate nearly 42 percent of state sales taxA sales tax is levied on retail sales of goods and services and, ideally, should apply to all final consumption with few exemptions. Many governments exempt goods like groceries; base broadening, such as including groceries, could keep rates lower. A sales tax should exempt business-to-business transactions which, when taxed, cause tax pyramiding. bases consist of business inputs.[42]
Special Economic Zones
China has also aggressively pursued place-based economic development strategies, where several policy levers (including tax, but also land, regulatory, and other governance choices) are altered in order to favor a specific location. In the tax policy space, the approach has entailed a lower corporate tax rate for corporations operating in a specific city or province—sometimes across the board, sometimes for specific industries of interest.
The U.S. has tried similar approaches with programs such as the New Markets Tax Credit, Empowerment Zones, and most recently, Opportunity Zones, to direct investment to targeted locations. The results of U.S. programs have been mixed, typically resulting in high costs and at best, small benefits, though it is worth noting that U.S. policies are dramatically smaller in scale than the Chinese ones, making direct comparisons difficult.[43]
The track record of China’s place-based policymaking is likewise mixed. On one hand, one could point to many success stories of extremely rapid development in specific areas. When China began to partially liberalize its economy beginning in the early 1980s, it started with a few specific areas, which it designated as Special Economic Zones (or SEZs). The SEZs were able to experiment with and benefit from more relaxed regulation in a wide variety of areas, and they received additional government incentives. China began with four major SEZs, but has since created many new ones (albeit often with different rules). The four original SEZs designated in 1980 have seen massive growth.[44] Most notably, the city of Shenzhen was a town of less than 100,000 in 1979 before it became one of the four original SEZs, and has since become one of the largest cities in the world with a population exceeding 12.8 million.[45]
It is not surprising that cities with policies much more favorable to business saw more growth. But determining the impacts of the policy on China as a whole, especially after the pilot period when they were the only economically open parts of China, is less clear. It is hard to isolate how much of the growth represents new activity that would not have occurred otherwise, and how much of the growth is just a result of shifting economic activity and investment from other areas where it would have occurred, particularly in light of broader liberalization.[46]
Some argue that by concentrating new investment in a few areas, place-based policies increased overall productivity growth thanks to agglomeration effects, or simply put, the idea that concentration of new firms in a few major areas can facilitate the exchange of new ideas, driving further innovation.[47] Other analyses support the more conventional story: place-based policies have led to a misallocation of capital as cities with preferential policy treatment, such as a lower cost of capital, attract resources that could be more productively used elsewhere.[48] Variation in corporate tax rates is only one lever of many playing a role in the misallocation of capital.[49] Estimates from a 2017 working paper suggest equalizing the cost of capital across cities could produce substantial welfare gains.[50]
Implications for the United States
Overall, China tends to have a better approach in some areas, such as a lower corporate tax rate than the combined U.S. rate, shorter depreciation lives for certain categories of assets, and a relatively well-structured VAT, but it also relies heavily on industrial policy and state-directed investment which lead to costly resource misallocation. Thus, emulating all tax policies used in China would not be a productive approach for the United States in terms of boosting competitiveness.
China’s massive “super-deductionA super-deduction is a tax deduction that permits businesses to deduct more than 100 percent of their eligible expenses from their taxable income. As such, the super-deduction is effectively a subsidy for certain costs. This policy sometimes applies to capital costs or research and development (R&D) spending.” for R&D, for example, has increased its R&D intensity (although it still does not match the U.S.), but it has not translated to new innovation. Innovation is difficult to measure; looking at the number of patents issued can help, but more individual patents does not necessarily mean major technological improvements.[51] While the number of patent applications has skyrocketed in China, the economic value of the patents is low.[52]
This points to one of the potential downsides of large subsidies for R&D—they can drive investment in at best incremental developments that ultimately provide little social value. The relative unproductivity of Chinese research suggests this dynamic may be at play. While subsidies for R&D, such as the R&D tax credit in the U.S., could help encourage some marginal socially beneficial investments, enormous-scale subsidies like in China could produce large misallocations of capital to unproductive R&D ventures.[53]
And while China’s tax preferences for certain regions have helped drive investments to specific areas, they also spur national-level resource misallocation.[54] Thus, distortionary geographical preferences are not an efficient way to spur investment.
Outside of the tax code the Chinese government employs many other policies to shift around or increase capital investment. China provides direct subsidies to specific companies and industries, including (but not limited to) state-owned enterprises. For example, China has focused heavily on developing a commercial airline manufacturer, intended to compete with the major American and European firms. They have spent tens of billions of dollars in support for the Commercial Aircraft Manufacturer of China (COMAC), but after over a decade of planning, the company is still not competitive with even Russian manufacturers.[55]
China’s approach to semiconductors has similarly floundered. Government support for the semiconductor sector has been aggressive, but South Korea and Taiwan have dominated in development.[56] Whether through the tax code or through more direct forms of support, the Chinese approach of subsidizing specific geographies or industries has fallen short and thus should not be emulated by the United States.
But neither should the U.S. follow the approach laid out in President Biden’s FY 2023 budget proposal, as it would move in the wrong direction by reducing incentives for domestic investment across industries.
President Biden’s FY 2023 budget proposal includes several tax increases on corporations and individuals.[57] Most prominently, it features an increase in the statutory corporate income tax rate to 28 percent, which when combined with state and local corporate taxes would give the United States a statutory corporate income tax rate of 32.3 percent.[58]
As illustrated in Table 2 above, the U.S. tax burden on marginal investment, measured by the METR, is already higher than China’s, and President Biden’s previous FY 2022 budget proposal (which largely mirrors the policies being considered now) would raise the U.S. METR significantly above China’s. In other words, the Biden administration tax agenda would reduce incentives for locating and increasing investment domestically relative to other countries including China.
Rather than pursuing industrial policy inspired by China, or raising the tax burden on private enterprise as proposed by the Biden administration, lawmakers should focus on removing the elements of the existing tax code standing in the way of domestic investments in physical capital and R&D. Other concerns with competitiveness and national security can be addressed with appropriate policies outside the tax system.[59] Additionally, the United States should seek to improve the competitiveness of its international tax system, rather than move toward international tax changes that would increase the burden on U.S. businesses.[60]
Conclusion
The Chinese tax code features many components targeted at specific industries and activities, an approach that has had mixed results. The United States tax code should, before anything else, avoid punishing domestic industries and activities. In the immediate term, bringing back full expensing for research and development costs, designing a better limitation on net interest expense, and ensuring continued 100 percent bonus depreciation of machinery and equipment would be the most important improvements. At the same time, rejecting the tax increases on private enterprise included in President Biden’s budget proposals would prevent further worsening of domestic investment incentives.
Stay informed on the tax policies impacting you.
Subscribe to our free newsletter to get the latest tax data, news and analysis.
Subscribe[1] For example, see S.1260: United States Innovation and Competition Act of 2021, https://www.congress.gov/bill/117th-congress/senate-bill/1260, and H.R.4521: America COMPETES Act of 2022, https://www.congress.gov/bill/117th-congress/house-bill/4521.
[2] U.S. Census Bureau, “Top Trading Partners – December 2021,” Mar. 11, 2022, https://www.census.gov/foreign-trade/statistics/highlights/top/top2112yr.html ,
[3] Andres Schwarenberg and Karen Sutter, “U.S. China-Investment Ties: Overview,” Congressional Research Service,
Jan. 15, 2021. https://sgp.fas.org/crs/row/IF11283.pdf
[4] Ibid.
[5] James L. Schoff and Asei Ito, “Competing with China on Technology and Innovation,” Carnegie Endowment for International Peace, Oct. 10, 2019, https://carnegieendowment.org/2019/10/10/competing-with-china-on-technology-and-innovation-pub-80010
[6] Janelle Cammenga, “State Corporate Income Tax Rates and Brackets for 2022,” Tax Foundation, Jan. 18, 2022, https://www.taxfoundation.org/state-corporate-income-tax-rates-brackets-2022/.
[7] William McBride and Alex Durante, “Biden Budget Would Raise Income Tax Rates to Highest in Developed World,” Tax Foundation, Mar. 31, 2022,”https://www.taxfoundation.org/biden-budget-tax/.
[8] Kyle Pomerleau, “The Tax Burden on Corporations: A Comparison of Organisation for Economic Co-operation and Development Countries and Proposals to Reform the US Tax System,” American Enterprise Institute, Oct. 13, 2021, https://www.aei.org/research-products/report/the-tax-burden-on-corporations-a-comparison-of-organisation-for-economic-co-operation-and-development-countries-and-proposals-to-reform-the-us-tax-system/; and Kyle Pomerleau. Note the estimates do not account for R&D tax credits.
[9] Erica York and Alex Muresianu, “The TCJA Alleviates the Tax Code’s Bias Against Certain Investments,” Tax Foundation, Sept. 5, 2018, https://www.taxfoundation.org/tcja-expensing-provision-benefits/.
[10] See Kyle Pomerleau, “The Tax Burden on Corporations: A Comparison of Organisation for Economic Co-operation and Development Countries and Proposals to Reform the US Tax System.”
[11] David Ling, “China: R&D 75% ‘Super Deduction’ Extended, Increased to 100% for Manufacturers,” KPMG, May 6, 2021, https://home.kpmg/us/en/home/insights/2021/05/tnf-china-rd-super-deduction-extended-increased-for-manufacturers.html.
[12] OECD, “R&D Tax Incentives: China, 2021,” Directorate for Science, Technology, and Innovation, 2021, https://www.oecd.org/sti/rd-tax-stats-china.pdf.
[13] Lydia Clowney, “China’s R&D Policies, Explained,” CrossBorder Solutions, September 2021, https://crossborder.ai/white-paper/chinas-rd-policies-explained/.
[14] Alex Muresianu and Garrett Watson, “To Stimulate R&D Investment, Stop Penalizing it in the Tax Code,” Tax Foundation, Mar. 16, 2022, https://www.taxfoundation.org/rd-expensing-tax-investment/.
[15] Gary Guenther, “Research Tax Credit: Current Law and Policy Issues for the 114th Congress,” Congressional Research Service, Mar. 3, 2015, https://www.fas.org/sgp/crs/misc/RL31181.pdf
[16] Ibid.
[17] Government Accountability Office, “The Research Tax Credit’s Design and Implementation Could be Improved,” Nov. 6, 2009, https://www.gao.gov/products/gao-10-136.
[18] Alex Muresianu and Garrett Watson, “Reviewing the Federal Tax Treatment for Research and Development Expenses,” Tax Foundation, Apr. 13, 2021, https://www.taxfoundation.org/research-and-development-tax/#_ftn8.
[19] Daniel Bunn, “The Balancing Act of GILTI and FDII,” Tax Foundation, Apr. 7, 2021, https://www.taxfoundation.org/intellectual-property-ip-tax-gilti-fdii/.
[20] Scott Greenberg, “Tax Reform Isn’t Done,” Tax Foundation, Mar. 8, 2018, https://taxfoundation.org/tax-reform-isnt-done/.
[21] OECD, “Implied tax subsidy rates on R&D expenditures,” https://stats.oecd.org/Index.aspx?DataSetCode=RDSUB.
[22] OECD, “R&D tax expenditureTax expenditures are departures from a “normal” tax code that lower the tax burden of individuals or businesses through an exemption, deduction, credit, or preferential rate. However, defining which tax expenditures grant special benefits to certain groups of people or types of economic activity is not always straightforward. and direct government funding of BERD,” https://stats.oecd.org/Index.aspx?DataSetCode=RDTAX.
[23] Ibid.
[24] Ibid.; see also Raymond Wolfe, “Businesses Reported an 11.8% Increase to Nearly a Half Trillion Dollars for U.S. R&D Performance During 2019,” National Center for Science and Engineering Statistics, Nov. 18, 2021, https://ncses.nsf.gov/pubs/nsf22303.
[25] Abby Joseph Cohen, “The coronavirus pandemic and US federal investment in science,” Goldman Sachs, Apr. 29, 2020, https://www.gspublishing.com/content/research/en/reports/2020/04/29/67c9cada-68a2-48af-b25c-0f5416c0c0c8.html.
[26] Global Times, “R&D spending reaches new high of 2.44% of GDP in 2021 as innovation ability grows,” Jan. 26, 2022, https://www.globaltimes.cn/page/202201/1247969.shtml.
[27] PwC, “China, People’s Republic of: Corporate – Deductions,” https://taxsummaries.pwc.com/peoples-republic-of-china/corporate/deductions.
[28] PwC, “China, People’s Republic of: Corporate – Group Taxation,” https://taxsummaries.pwc.com/peoples-republic-of-china/corporate/group-taxation.
[29] See discussion in Jane Gravelle, “Limits on Business Interest Deductions Under the Coronavirus Aid, Relief, and Economic Security (CARES) Act,” Congressional Research Service, updated June 1, 2020, https://crsreports.congress.gov/product/pdf/IN/IN11287.
[30] For more about the issue of interest deductibility and reforms to address the debt-equity bias, see Alan Cole, “Interest Deductibility – Issues and Reforms,” Tax Foundation, May 4, 2017, https://www.taxfoundation.org/interest-deductibility/.
[31] Kyle Pomerleau, Daniel Bunn, and Thomas Locher, “Anti-Base Erosion Provisions and Territorial Tax Systems in OECD Countries,” Tax Foundation, July 7, 2021, https://www.taxfoundation.org/anti-base-erosion-territorial-tax-systems/#Interest.
[32] PwC, “China, People’s Republic of: Corporate – Taxes on corporate income,” https://taxsummaries.pwc.com/peoples-republic-of-china/corporate/taxes-on-corporate-income.
[33] Kyle Pomerleau, “A Hybrid Approach: The Treatment of Foreign Profits under the Tax Cuts and Jobs Act,” Tax Foundation, May 3, 2018, https://www.taxfoundation.org/treatment-foreign-profits-tax-cuts-jobs-act/.
[34] Daniel Bunn and Sean Bray, “What’s in the New Global Tax Agreement?” Tax Foundation, Apr. 7, 2022, https://www.taxfoundation.org/global-tax-agreement/.
[35] Daniel Bunn, “Which Global Minimum Tax Will We Get?” Tax Foundation, Apr. 8, 2022, https://www.taxfoundation.org/biden-global-minimum-tax/.
[36] Stephanie Soong Johnston, “China Calls for Capacity-Building Aid For OECD Tax Reform Plan,” Tax Notes, Feb. 18, 2022, China Calls for Capacity-Building Aid for OECD Tax Reform Plan (taxnotes.com).
[37] Erica York, Will McBride, Garrett Watson, Alex Muresianu, Alex Durante, and Daniel Bunn, “10 Tax Reforms for Growth and Opportunity,” Tax Foundation, Feb. 22, 2022, https://www.taxfoundation.org/economic-growth-opportunity-tax-reforms/.
[38] TaxEDU, “Value Added Tax,” Tax Foundation, https://www.taxfoundation.org/tax-basics/value-added-tax-vat/.
[39] Zhao Chen, Yuxuan He, Zhikuo Liu, Juan Carlos Suarez Serrato, and Daniel Xu, “The Structure of Business Taxes in China,” in Tax Policy and the Economy 35 (2021), https://www.journals.uchicago.edu/doi/10.1086/713495.
[40] Garrett Watson, “Resisting the Allure of Gross Receipts Taxes: An Assessment of Their Costs and Consequences,” Tax Foundation, Feb. 6, 2019, https://www.taxfoundation.org/gross-receipts-tax/.
[41] Yongzheng Liu and Jie Mao, “How Do Tax Incentives Effect Productivity and Investment: Firm-Level Evidence from China,” American Economic Journal: Economic Policy 11:3 (August 2019), https://www.aeaweb.org/articles?id=10.1257/pol.20170478.
[42] Andrew Phillips, “Total State and Local Business Taxes for FY20,” EY, Nov. 18, 2021, https://www.ey.com/en_us/tax/fy-20-total-state-and-local-business-taxes.
[43] See Chad Qin, “An Overview of the New Markets Tax Credit,” Tax Foundation, July 8, 2019, https://www.taxfoundation.org/new-markets-tax-credit-nmtc/; and Scott Eastman, “Are Opportunity Zones Working as Intended,” Tax Foundation, June 26, 2019, https://www.taxfoundation.org/opportunity-zones-effectiveness/.
[44] Douglas Zhihua Zeng, “Global Experience with Special Economic Zones – With a Focus on China and Africa,” The World Bank, February 2015, https://www.worldbank.org/content/dam/Worldbank/Event/Africa/Investing%20in%20Africa%20Forum/2015/investing-in-africa-forum-global-experiences-with-special-economic-zones-with-a-focus-on-china-and-africa.pdf.
[45] World Population Review, “Shenzhen Population 2022,” data from National Bureau of Statistics of China and Government of Shenzhen Online, https://worldpopulationreview.com/world-cities/shenzhen-population.
[46] Douglas Zhihua Zeng, “China’s Special Economic Zones and Industrial Clusters: Successes and Challenges,” Lincoln Institute of Land Policy Working Paper (2012), https://www.lincolninst.edu/sites/default/files/pubfiles/2261_1600_Zeng_WP13DZ1.pdf.
[47] Ibid.
[48] Chang-Tai Hseih and Peter J. Klenow, “Misallocation and Manufacturing TFP in China and India,” Quarterly Journal of Economics CXXIV:4 (November 2009), http://klenow.com/MMTFP.pdf.
[49] Binkai Chen, Ming Lu, Christopher Timmins, and Kuanhu Xiang, “Spatial Misallocation: Evaluating Place-Based Policies Using a Natural Experiment in China,” National Bureau of Economic Research Working Paper No. 26148 (August 2019); see also Zhao Chen, Yuxuan He, Zhikuo Liu, Juan Carlos Suarez Serrato, and Daniel Xu, “The Structure of Business Taxes in China.”
[50] Shangming Yang, Yuming Fu, and Yi Lu, “The Spatial Misallocation of Capital and Labor in China: A Welfare Analysis Based on Urban Accounting,” Working Paper, Department of Real Estate, National University of Singapore (2017).
[51] Christof Ernst, Katharina Richter-Weiss, and Nadine Riedel, “Corporate Taxation and the Quality of Research and Development,” International Tax and Public Finance 21:4 (2014), https://econpapers.repec.org/article/kapitaxpf/v_3a21_3ay_3a2014_3ai_3a4_3ap_3a694-719.htm,; see also Alex Muresianu and Garrett Watson, “Reviewing the Federal Tax Treatment of Research and Development Expenses.”
[52] Scott Kennedy, “The Fat Tech Dragon: Benchmarking China’s Innovation Drive,” Center for Strategic and International Studies, August 2017, https://csis-website-prod.s3.amazonaws.com/s3fs-public/publication/170829_Kennedy_FatTechDragon_Web.pdf.
[53] Guiying Laura Wu, “Capital Misallocation in China: Financial Restrictions or Policy Distortions?” Journal of Development Economics 130 (January 2018), https://personal.ntu.edu.sg/guiying.wu/Wu_JDE_201801.pdf.
[54] Shangming Yang, Yuming Fu, and Yi Lu, “The Spatial Misallocation of Capital and Labor in China: A Welfare Analysis Based on Urban Accounting”; see also Binkai Chen, Ming Lu, Christopher Timmins, and Kuanhu Xiang, “Spatial Misallocation: Evaluating Place-Based Policies Using a Natural Experiment in China.”
[55] Scott Kennedy, “China’s COMAC: An Aerospace Minor Leaguer,” Center for Strategic and International Studies, Dec. 7, 2020, https://csis-website-prod.s3.amazonaws.com/s3fs-public/201204_Kennedy_COMAC.pdf.
[56] Scott Kennedy, “China’s Uneven High-Tech Drive: Implications for the U.S.,” Center for Strategic and International Studies, February 2020, https://csis-website-prod.s3.amazonaws.com/s3fs-public/publication/200302_Kennedy_ChinaUnevenDrive_v3.pdf?33r3oE.zYL35PXvcofD5frIVeK1lzS9G.
[57] Office of Management and Budget, “FY 2023 President’s Budget,” https://www.whitehouse.gov/omb/budget/.
[58] William McBride and Alex Durante, “Biden Budget Would Raise Income Tax Rates to Highest in Developed World,” Tax Foundation, Mar. 31, 2022, https://www.taxfoundation.org/biden-budget-tax/.
[59] See discussions in Erica York and Alex Durante, “Biden’s Trade Agenda Should End the Trade War and Promote Free Trade,” Tax Foundation, Mar. 30, 2022, https://www.taxfoundation.org/biden-tariffs-free-trade-war/; and Erica York, Alex Muresianu, and Alex Durante, “Taxes, Tariffs, and Industrial Policy: How the U.S. Tax Code Fails Manufacturing,” Tax Foundation, Mar. 17, 2022, https://www.taxfoundation.org/us-manufacturing-tax-industrial-policy/.
[60] Daniel Bunn, “TCJA is Not GILTI of Offshoring,” Tax Foundation, Mar. 18, 2021, https://www.taxfoundation.org/tax-cuts-and-jobs-act-offshoring/.
Share this article