Income inequality has been a prominent topic on the presidential campaign trail, leading to proposals for wealth taxes, higher marginal income taxA tax is a mandatory payment or charge collected by local, state, and national governments from individuals or businesses to cover the costs of general government services, goods, and activities. rates, and other policies. As scholars and everyday taxpayers continue to debate this issue and the question of increasing taxes on the richest Americans, one observation to keep in mind is the high degree of turnover among the highest-income Americans.
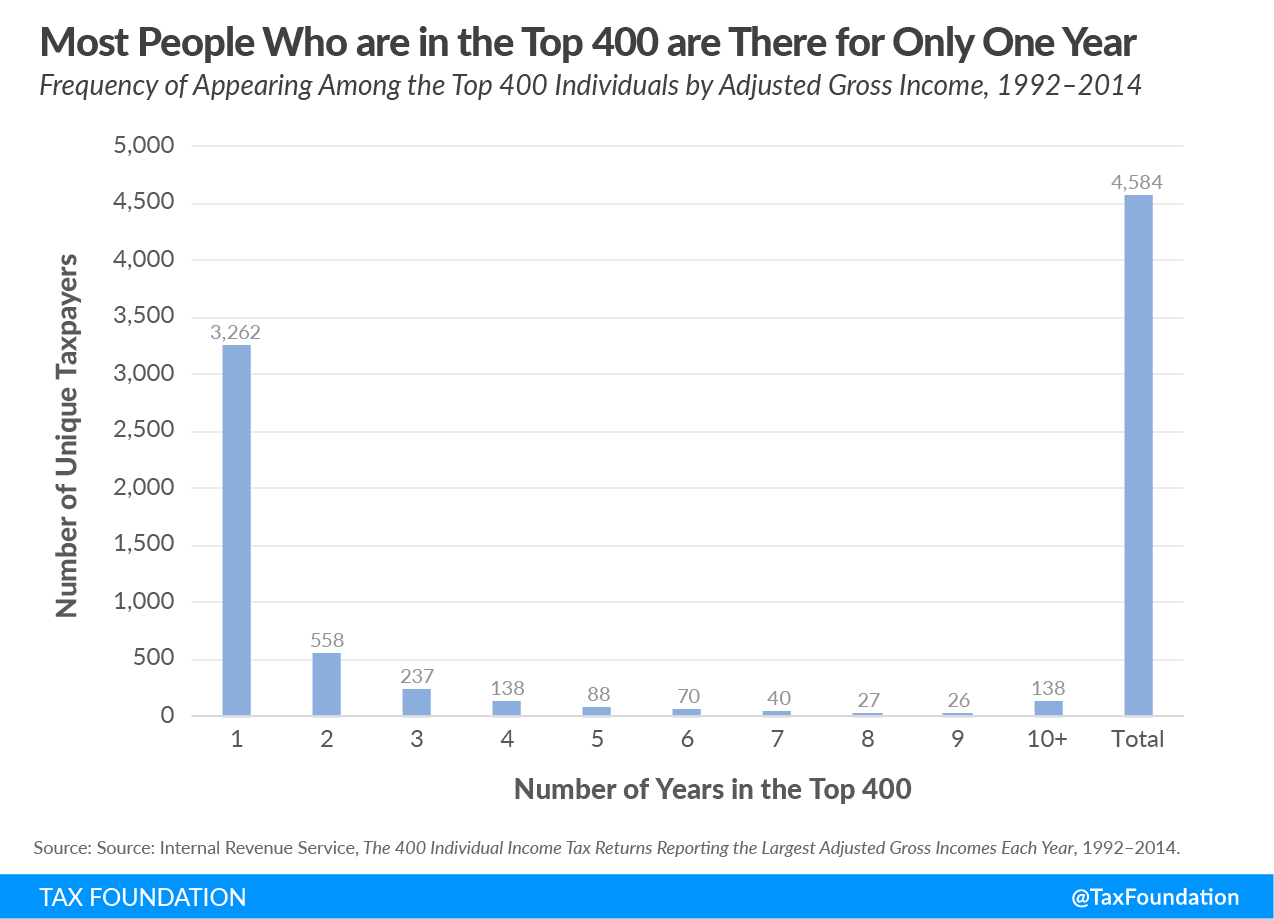
The following chart, using data from the Internal Revenue Service (IRS), shows the frequency of those filing who make the top 400 individual income tax returns with the highest adjusted gross incomeFor individuals, gross income is the total of all income received from any source before taxes or deductions. It includes wages, salaries, tips, interest, dividends, capital gains, rental income, alimony, pensions, and other forms of income. For businesses, gross income (or gross profit) is the sum of total receipts or sales minus the cost of goods sold (COGS)—the direct costs of producing goods from 1992 to 2014. Of the 4,584 people who made it into the top 400 at some point over that period, 3,262 qualified for only one year. In other words, 71.2 percent of those who were in the top 400 made it once and not again.
Of that same overall group, 138 people did qualify for at least a decade. Nevertheless, the top 400 remains far from a monolithic group that is impossible to enter or exit. As an older update of this data, from 1992-2006, concluded, “The data…mostly represent a changing group of taxpayers over time, rather than a fixed group of taxpayers.”
This data illustrates another important point about how tax rates, or the share of the tax burden on an income group, have changed over time: We should not conclude without evidence that it is the same people in that income group the entire time. For example, it can be easy to look at data on the top 1 percent’s tax rates over time and assume that the same people belong to that group in every year. However, such data on its own often doesn’t tell us whether a given income group represents the same people year after year, experiences a complete turnover annually, or something in between.
When the data does provide information on the people in a given group, as is the case here, the results can be surprising. At least among the top 400 such filers, there is more turnover than many might think. Policymakers and taxpayers should keep this in mind and be careful not to jump to unjustified conclusions as they consider the many changes to our tax code being debated today.
For more information on the taxation of the highest-income Americans, the evolution of the tax code, and the distribution of the tax burden, see our recent blog series, Putting a Face on America’s Tax Returns.
Taxes make more sense with us in your inbox.
Subscribe to our newsletter for tax insights that cut through the noise—and make sense of it.
Sign Up