As policymakers consider raising taxes on the richest Americans, it’s important to look at the top 1 percent’s taxA tax is a mandatory payment or charge collected by local, state, and national governments from individuals or businesses to cover the costs of general government services, goods, and activities. burden from a historical perspective. Though the United States has had high marginal income tax rates in the past, the rich weren’t necessarily paying those rates. Understanding how the top 1 percent’s taxes have changed over time requires looking at not only the top marginal income tax rate but also effective rates and the share of income taxes paid, as well as the many expenditures that carve out the tax baseThe tax base is the total amount of income, property, assets, consumption, transactions, or other economic activity subject to taxation by a tax authority. A narrow tax base is non-neutral and inefficient. A broad tax base reduces tax administration costs and allows more revenue to be raised at lower rates. .
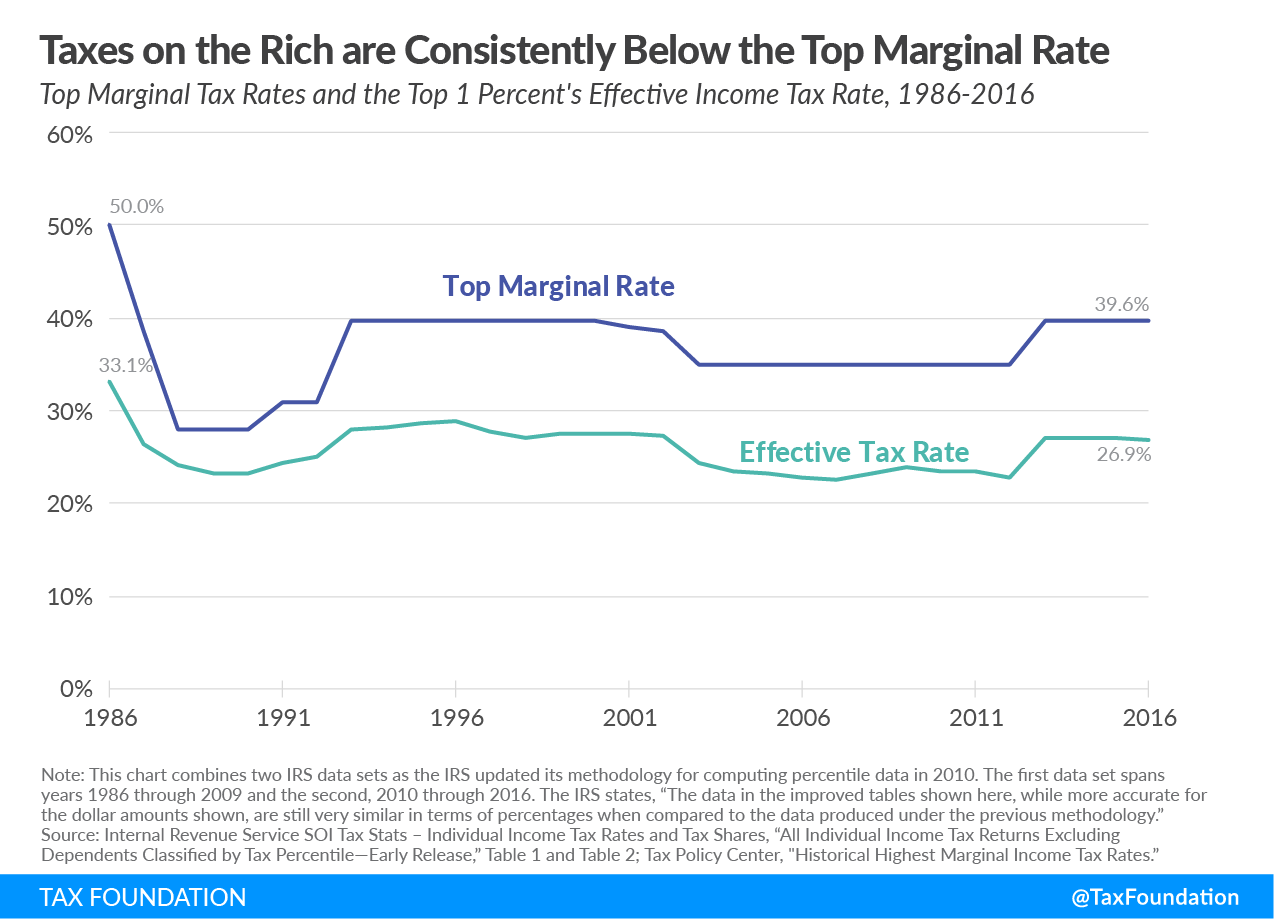
If we look at the top 1 percent’s effective tax rate (income tax liabilities divided by income), we see this story play out. The following chart shows the top marginal income tax rate and the top 1 percent’s effective tax rate.
Stay informed on the tax policies impacting you.
Subscribe to get insights from our trusted experts delivered straight to your inbox.
SubscribeThe top 1 percent’s effective tax rate has consistently been below the top marginal income tax rate. Though this IRS data set only reaches back to 1986, another data set shows that the difference between these two tax rates used to be even greater. For example, in the 1950s, when the top marginal income tax rate reached 92 percent, the top 1 percent of taxpayers paid an effective rate of only 16.9 percent. Although the two data sets are not strictly comparable, they nevertheless show the consistency of the gap between the top marginal income tax rate and the effective rate.
Behind this difference was a plethora of tax expenditures that carved out the base. Economists Thomas Piketty and Emmanuel Saez explain:
Within the 1960 version of the individual income taxAn individual income tax (or personal income tax) is levied on the wages, salaries, investments, or other forms of income an individual or household earns. The U.S. imposes a progressive income tax where rates increase with income. The Federal Income Tax was established in 1913 with the ratification of the 16th Amendment. Though barely 100 years old, individual income taxes are the largest source of tax revenue in the U.S. , lower rates on realized capital gains, as well as deductions for interest payments and charitable contributions, reduced dramatically what otherwise looked like an extremely progressive taxA progressive tax is one where the average tax burden increases with income. High-income families pay a disproportionate share of the tax burden, while low- and middle-income taxpayers shoulder a relatively small tax burden. schedule … The reduction in top marginal individual income tax rates has contributed only marginally to the decline of progressivity of the federal tax system, because with various deductions and exemptions, along with favored treatment for capital gains, the average tax rateThe average tax rate is the total tax paid divided by taxable income. While marginal tax rates show the amount of tax paid on the next dollar earned, average tax rates show the overall share of income paid in taxes. paid by those with very high income levels has changed much less over time than the top marginal rates.
The tax code continues to be full of deductions, exemptions, and credits that shrink the tax base and bring the effective rate below the top marginal income tax rate. Even after accounting for such expenditures, however, the income tax system remains progressive.
Stay informed on the tax policies impacting you.
Subscribe to get insights from our trusted experts delivered straight to your inbox.
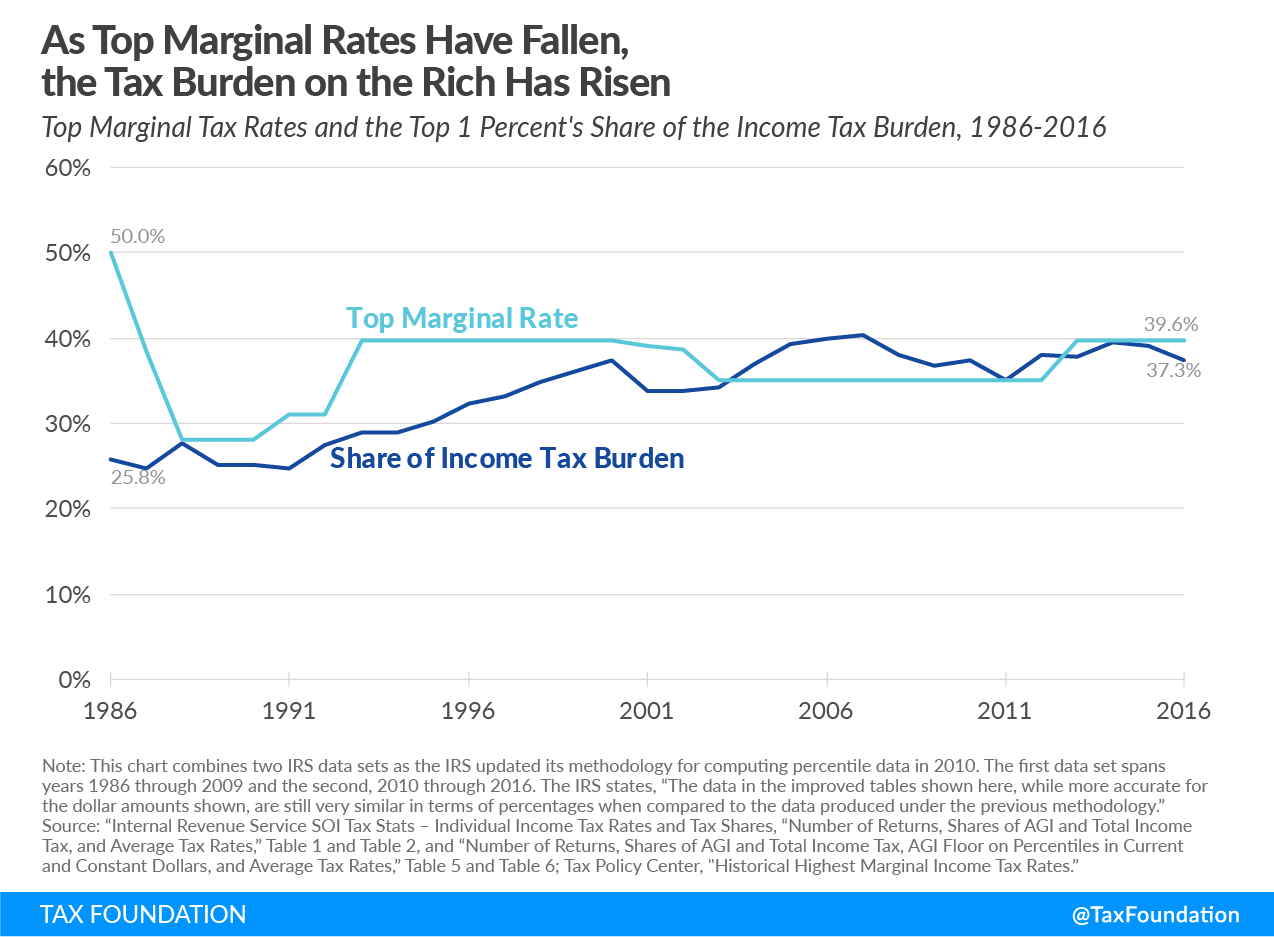
SubscribeAs this chart illustrates, higher marginal income tax rates didn’t necessarily result in a higher income tax burden for the wealthiest taxpayers. In fact, as the top marginal income tax rate has fallen, the top 1 percent’s income tax burden has increased. In 1986, the top marginal income tax rate was 50 percent, and the top 1 percent paid 25.8 percent of all income taxes; thirty years later, the top marginal income tax rate had fallen to 39.6 percent, but the top 1 percent’s share of income taxes had risen to 37.3 percent.
The growth of tax expenditures in recent decades has increased the percentage of nonpayers (taxpayers who owe zero income taxes after taking their deductions and exemptions), putting a greater share of the tax burden on those who continue to pay, meaning the top 1 percent now pays an increased share of the tax burden. The Tax Reform Act of 1986’s expansion of the standard deductionThe standard deduction reduces a taxpayer’s taxable income by a set amount determined by the government. It was nearly doubled for all classes of filers by the 2017 Tax Cuts and Jobs Act (TCJA) as an incentive for taxpayers not to itemize deductions when filing their federal income taxes. and the personal exemption, and more recently the creation and expansion of credits such as the Earned Income Tax CreditA tax credit is a provision that reduces a taxpayer’s final tax bill, dollar-for-dollar. A tax credit differs from deductions and exemptions, which reduce taxable income, rather than the taxpayer’s tax bill directly. and the Child Tax Credit, have increased the percentage of the population with a negative effective tax rate.
When looking at charts like these, one should be careful not to draw the wrong conclusions about whom the top 1 percent describes. Some might take the previous charts to show that this group includes the same people each year, but such a conclusion would be unfounded. These charts don’t tell us whether the top 1 percent contains the same people year after year, experiences a complete turnover annually, or something in between.
As it turns out, the composition of richest Americans has changed dramatically over time. As my colleague Erica York put it: “The wealthy aren’t a monolithic group of taxpayers. In fact, IRS data shows that there is typically a lot of churn within the group of top earners. For example, the number of taxpayers who report incomes of $1 million or more is highly variable and fluctuates with the business cycle.”
Looking at long-term trends can provide a valuable historical perspective to ongoing tax policy debates. As some policymakers call for raising the top marginal income tax rates, they should keep in mind that those rates and the top 1 percent’s tax burden don’t have a direct correlation. Policymakers would do well to remember that in some important respects, the taxation of the top 1 percent has not changed as much as they might think, and that marginal income tax rates are only part of the story.
Note: This is part of our “Putting a Face on America’s Tax Returns” blog series
- America Already Has a Progressive Tax System
- Income Taxes on the Top 0.1 Percent Weren’t Much Higher in the 1950s
- The Composition of Federal Revenue Has Changed Over Time
- Who Benefits from Itemized Deductions?
- How Do Transfers and Progressive Taxes Affect the Distribution of Income?
- A Growing Percentage of Americans Have Zero Income Tax Liability
Stay informed on the tax policies impacting you.
Subscribe to get insights from our trusted experts delivered straight to your inbox.
Subscribe