The Internal Revenue Service has recently released new data on individual income taxes for calendar year 2014, showing the number of taxpayers, adjusted gross incomeFor individuals, gross income is the total pre-tax earnings from wages, tips, investments, interest, and other forms of income and is also referred to as “gross pay.” For businesses, gross income is total revenue minus cost of goods sold and is also known as “gross profit” or “gross margin.” , and income taxA tax is a mandatory payment or charge collected by local, state, and national governments from individuals or businesses to cover the costs of general government services, goods, and activities. shares by income percentiles.[1]
The data demonstrates that the U.S. individual income tax continues to be very progressive, borne mainly by the highest income earners.
- In 2014, 139.6 million taxpayers reported earning $9.71 trillion in adjusted gross income and paid $1.37 trillion in individual income taxes.
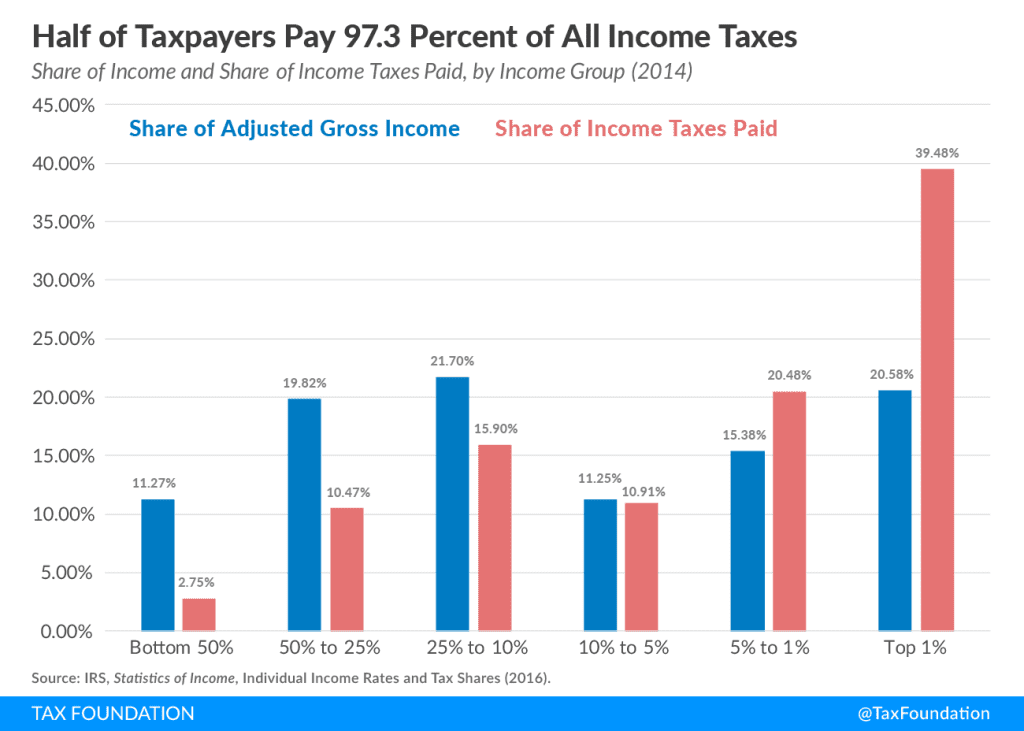
- The share of income earned by the top 1 percent of taxpayers rose to 20.6 percent in 2014. Their share of federal individual income taxes also rose, to 39.5 percent.
- In 2014, the top 50 percent of all taxpayers paid 97.3 percent of all individual income taxes while the bottom 50 percent paid the remaining 2.7 percent.
- The top 1 percent paid a greater share of individual income taxes (39.5 percent) than the bottom 90 percent combined (29.1 percent).
- The top 1 percent of taxpayers paid a 27.1 percent individual income taxAn individual income tax (or personal income tax) is levied on the wages, salaries, investments, or other forms of income an individual or household earns. The U.S. imposes a progressive income tax where rates increase with income. The Federal Income Tax was established in 1913 with the ratification of the 16th Amendment. Though barely 100 years old, individual income taxes are the largest source of tax revenue in the U.S. rate, which is more than seven times higher than taxpayers in the bottom 50 percent (3.5 percent).
Reported Income and Taxes Paid Both Increased Significantly in 2014
Taxpayers reported $9.71 trillion in adjusted gross income (AGI) on 139.5 million tax returns in 2014. Total AGI grew by $675 billion from the previous year’s levels. There were 1.2 million more returns filed in 2014 than in 2013, meaning that average AGI rose by $4,252 per return, or 6.5 percent.
Meanwhile, taxpayers paid $1.37 trillion in individual income taxes in 2014, an 11.5 percent increase from taxes paid in the previous year. The average individual income tax rate for all taxpayers rose from 13.64 percent to 14.16 percent. Moreover, the average tax rate increased for all income groups, except for the top 0.1 percent of taxpayers, whose average rate decreased from 27.91 percent to 27.67 percent.
The most likely explanation behind the higher tax rates in 2014 is a phenomenon known as “real bracket creepBracket creep occurs when inflation pushes taxpayers into higher income tax brackets or reduces the value of credits, deductions, and exemptions. Bracket creep results in an increase in income taxes without an increase in real income. Many tax provisions—both at the federal and state level—are adjusted for inflation. .” [2] As incomes rise, households are pushed into higher tax bracketsA tax bracket is the range of incomes taxed at given rates, which typically differ depending on filing status. In a progressive individual or corporate income tax system, rates rise as income increases. There are seven federal individual income tax brackets; the federal corporate income tax system is flat. , and are subject to higher overall tax rates on their income. On the other hand, the likely reason why the top 0.1 percent of households saw a slightly lower tax rate in 2014 is because a higher portion of their income consisted of long-term capital gains, which are subject to lower tax rates.[3]
The share of income earned by the top 1 percent rose to 20.58 percent of total AGI, up from 19.04 percent in 2013. The share of the income tax burden for the top 1 percent also rose, from 37.80 percent in 2013 to 39.48 percent in 2014.
| Top 1% | Top 5% | Top 10% | Top 25% | Top 50% | Bottom 50% | All Taxpayers | |
|---|---|---|---|---|---|---|---|
| Number of Returns | 1,395,620 | 6,978,102 | 13,956,203 | 34,890,509 | 69,781,017 | 69,781,017 | 139,562,034 |
| Adjusted Gross Income ($ millions) | $1,997,819 | $3,490,867 | $4,583,416 | $6,690,287 | $8,614,544 | $1,094,119 | $9,708,663 |
| Share of Total Adjusted Gross Income | 20.58% | 35.96% | 47.21% | 68.91% | 88.73% | 11.27% | 100.00% |
| Income Taxes Paid ($ millions) | $542,640 | $824,153 | $974,124 | $1,192,679 | $1,336,637 | $37,740 | $1,374,379 |
| Share of Total Income Taxes Paid | 39.48% | 59.97% | 70.88% | 86.78% | 97.25% | 2.75% | 100.00% |
| Income Split Point | $465,626 | $188,996 | $133,445 | $77,714 | $38,173 | ||
| Average Tax Rate | 27.16% | 23.61% | 21.25% | 17.83% | 15.52% | 3.45% | 14.16% |
| Note: Does not include dependent filers | |||||||
High-Income Americans Paid the Majority of Federal Taxes
In 2014, the bottom 50 percent of taxpayers (those with AGIs below $38,173) earned 11.27 percent of total AGI. This group of taxpayers paid approximately $38 billion in taxes, or 2.75 percent of all income taxes in 2014.
In contrast, the top 1 percent of all taxpayers (taxpayers with AGIs of $465,626 and above) earned 20.58 percent of all AGI in 2014, but paid 39.48 percent of all federal income taxes.
In 2014, the top 1 percent of taxpayers accounted for more income taxes paid than the bottom 90 percent combined. The top 1 percent of taxpayers paid $543 billion, or 39.48 percent of all income taxes, while the bottom 90 percent paid $400 billion, or 29.12 percent of all income taxes.
Figure 1.
High-Income Taxpayers Pay the Highest Average Tax Rates
The 2014 IRS data shows that taxpayers with higher incomes pay much higher average individual income tax rates than lower-income taxpayers.[4]
The bottom 50 percent of taxpayers (taxpayers with AGIs below $38,173) faced an average income tax rate of 3.45 percent. As household income increases, the IRS data shows that average income tax rates rise. For example, taxpayers with AGIs between the 10th and 5th percentile ($133,445 and $188,996) pay an average rate of 13.7 percent – almost four times the rate paid by those in the bottom 50 percent.
The top 1 percent of taxpayers (AGI of $465,626 and above) paid the highest effective income tax rate, at 27.2 percent, 7.9 times the rate faced by the bottom 50 percent of taxpayers.
Figure 2.
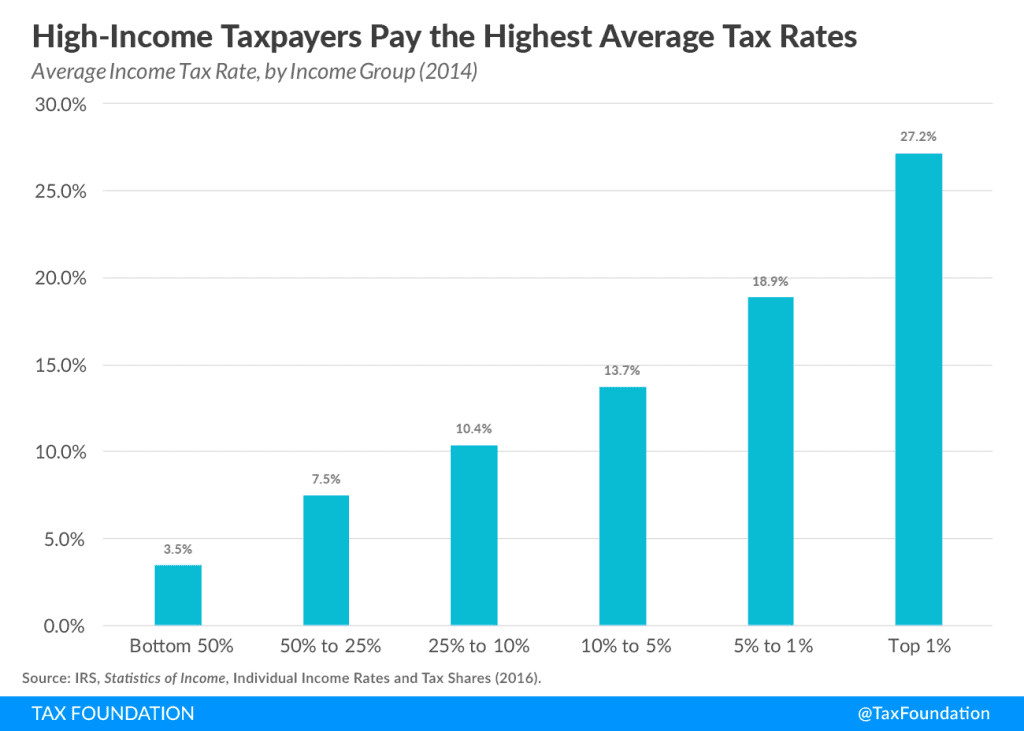
Taxpayers at the very top of the income distribution, the top 0.1 percent (with AGIs over $2.14 million), paid an even higher average tax rateThe average tax rate is the total tax paid divided by taxable income. While marginal tax rates show the amount of tax paid on the next dollar earned, average tax rates show the overall share of income paid in taxes. , of 27.7 percent.
Appendix
| Year | Total | Top 0.1% | Top 1% | Top 5% |
Between 5% & 10% |
Top 10% | Between 10% & 25% | Top 25% | Between 25% & 50% | Top 50% | Bottom 50% |
|---|---|---|---|---|---|---|---|---|---|---|---|
| Source: Internal Revenue Service. | |||||||||||
| 1980 | 93,239 | 932 | 4,662 | 4,662 | 9,324 | 13,986 | 23,310 | 23,310 | 46,619 | 46,619 | |
| 1981 | 94,587 | 946 | 4,729 | 4,729 | 9,459 | 14,188 | 23,647 | 23,647 | 47,293 | 47,293 | |
| 1982 | 94,426 | 944 | 4,721 | 4,721 | 9,443 | 14,164 | 23,607 | 23,607 | 47,213 | 47,213 | |
| 1983 | 95,331 | 953 | 4,767 | 4,767 | 9,533 | 14,300 | 23,833 | 23,833 | 47,665 | 47,665 | |
| 1984 | 98,436 | 984 | 4,922 | 4,922 | 9,844 | 14,765 | 24,609 | 24,609 | 49,218 | 49,219 | |
| 1985 | 100,625 | 1,006 | 5,031 | 5,031 | 10,063 | 15,094 | 25,156 | 25,156 | 50,313 | 50,313 | |
| 1986 | 102,088 | 1,021 | 5,104 | 5,104 | 10,209 | 15,313 | 25,522 | 25,522 | 51,044 | 51,044 | |
| The Tax Reform Act of 1986 changed the definition of AGI, so data above and below this line not strictly comparable | |||||||||||
| 1987 | 106,155 | 1,062 | 5,308 | 5,308 | 10,615 | 15,923 | 26,539 | 26,539 | 53,077 | 53,077 | |
| 1988 | 108,873 | 1,089 | 5,444 | 5,444 | 10,887 | 16,331 | 27,218 | 27,218 | 54,436 | 54,436 | |
| 1989 | 111,313 | 1,113 | 5,566 | 5,566 | 11,131 | 16,697 | 27,828 | 27,828 | 55,656 | 55,656 | |
| 1990 | 112,812 | 1,128 | 5,641 | 5,641 | 11,281 | 16,922 | 28,203 | 28,203 | 56,406 | 56,406 | |
| 1991 | 113,804 | 1,138 | 5,690 | 5,690 | 11,380 | 17,071 | 28,451 | 28,451 | 56,902 | 56,902 | |
| 1992 | 112,653 | 1,127 | 5,633 | 5,633 | 11,265 | 16,898 | 28,163 | 28,163 | 56,326 | 56,326 | |
| 1993 | 113,681 | 1,137 | 5,684 | 5,684 | 11,368 | 17,052 | 28,420 | 28,420 | 56,841 | 56,841 | |
| 1994 | 114,990 | 1,150 | 5,749 | 5,749 | 11,499 | 17,248 | 28,747 | 28,747 | 57,495 | 57,495 | |
| 1995 | 117,274 | 1,173 | 5,864 | 5,864 | 11,727 | 17,591 | 29,319 | 29,319 | 58,637 | 58,637 | |
| 1996 | 119,442 | 1,194 | 5,972 | 5,972 | 11,944 | 17,916 | 29,860 | 29,860 | 59,721 | 59,721 | |
| 1997 | 121,503 | 1,215 | 6,075 | 6,075 | 12,150 | 18,225 | 30,376 | 30,376 | 60,752 | 60,752 | |
| 1998 | 123,776 | 1,238 | 6,189 | 6,189 | 12,378 | 18,566 | 30,944 | 30,944 | 61,888 | 61,888 | |
| 1999 | 126,009 | 1,260 | 6,300 | 6,300 | 12,601 | 18,901 | 31,502 | 31,502 | 63,004 | 63,004 | |
| 2000 | 128,227 | 1,282 | 6,411 | 6,411 | 12,823 | 19,234 | 32,057 | 32,057 | 64,114 | 64,114 | |
| The IRS changed methodology, so data above and below this line not strictly comparable | |||||||||||
| 2001 | 119,371 | 119 | 1,194 | 5,969 | 5,969 | 11,937 | 17,906 | 29,843 | 29,843 | 59,685 | 59,685 |
| 2002 | 119,851 | 120 | 1,199 | 5,993 | 5,993 | 11,985 | 17,978 | 29,963 | 29,963 | 59,925 | 59,925 |
| 2003 | 120,759 | 121 | 1,208 | 6,038 | 6,038 | 12,076 | 18,114 | 30,190 | 30,190 | 60,379 | 60,379 |
| 2004 | 122,510 | 123 | 1,225 | 6,125 | 6,125 | 12,251 | 18,376 | 30,627 | 30,627 | 61,255 | 61,255 |
| 2005 | 124,673 | 125 | 1,247 | 6,234 | 6,234 | 12,467 | 18,701 | 31,168 | 31,168 | 62,337 | 62,337 |
| 2006 | 128,441 | 128 | 1,284 | 6,422 | 6,422 | 12,844 | 19,266 | 32,110 | 32,110 | 64,221 | 64,221 |
| 2007 | 132,655 | 133 | 1,327 | 6,633 | 6,633 | 13,265 | 19,898 | 33,164 | 33,164 | 66,327 | 66,327 |
| 2008 | 132,892 | 133 | 1,329 | 6,645 | 6,645 | 13,289 | 19,934 | 33,223 | 33,223 | 66,446 | 66,446 |
| 2009 | 132,620 | 133 | 1,326 | 6,631 | 6,631 | 13,262 | 19,893 | 33,155 | 33,155 | 66,310 | 66,310 |
| 2010 | 135,033 | 135 | 1,350 | 6,752 | 6,752 | 13,503 | 20,255 | 33,758 | 33,758 | 67,517 | 67,517 |
| 2011 | 136,586 | 137 | 1,366 | 6,829 | 6,829 | 13,659 | 20,488 | 34,146 | 34,146 | 68,293 | 68,293 |
| 2012 | 136,080 | 136 | 1,361 | 6,804 | 6,804 | 13,608 | 20,412 | 34,020 | 34,020 | 68,040 | 68,040 |
| 2013 | 138,313 | 138 | 1,383 | 6,916 | 6,916 | 13,831 | 20,747 | 34,578 | 34,578 | 69,157 | 69,157 |
| 2014 | 139,562 | 140 | 1,396 | 6,978 | 6,978 | 13,956 | 20,934 | 34,891 | 34,891 | 69,781 | 69,781 |
| Year | Total | Top 0.1% | Top 1% | Top 5% | Between 5% & 10% | Top 10% | Between 10% & 25% | Top 25% | Between 25% & 50% | Top 50% | Bottom 50% |
|---|---|---|---|---|---|---|---|---|---|---|---|
| Source: Internal Revenue Service. | |||||||||||
| 1980 | $1,627 | $138 | $342 | $181 | $523 | $400 | $922 | $417 | $1,339 | $288 | |
| 1981 | $1,791 | $149 | $372 | $201 | $573 | $442 | $1,015 | $458 | $1,473 | $318 | |
| 1982 | $1,876 | $167 | $398 | $207 | $605 | $460 | $1,065 | $478 | $1,544 | $332 | |
| 1983 | $1,970 | $183 | $428 | $217 | $646 | $481 | $1,127 | $498 | $1,625 | $344 | |
| 1984 | $2,173 | $210 | $482 | $240 | $723 | $528 | $1,251 | $543 | $1,794 | $379 | |
| 1985 | $2,344 | $235 | $531 | $260 | $791 | $567 | $1,359 | $580 | $1,939 | $405 | |
| 1986 | $2,524 | $285 | $608 | $278 | $887 | $604 | $1,490 | $613 | $2,104 | $421 | |
| The Tax Reform Act of 1986 changed the definition of AGI, so data above and below this line not strictly comparable | |||||||||||
| 1987 | $2,814 | $347 | $722 | $316 | $1,038 | $671 | $1,709 | $664 | $2,374 | $440 | |
| 1988 | $3,124 | $474 | $891 | $342 | $1,233 | $718 | $1,951 | $707 | $2,658 | $466 | |
| 1989 | $3,299 | $468 | $918 | $368 | $1,287 | $768 | $2,054 | $751 | $2,805 | $494 | |
| 1990 | $3,451 | $483 | $953 | $385 | $1,338 | $806 | $2,144 | $788 | $2,933 | $519 | |
| 1991 | $3,516 | $457 | $943 | $400 | $1,343 | $832 | $2,175 | $809 | $2,984 | $532 | |
| 1992 | $3,681 | $524 | $1,031 | $413 | $1,444 | $856 | $2,299 | $832 | $3,131 | $549 | |
| 1993 | $3,776 | $521 | $1,048 | $426 | $1,474 | $883 | $2,358 | $854 | $3,212 | $563 | |
| 1994 | $3,961 | $547 | $1,103 | $449 | $1,552 | $929 | $2,481 | $890 | $3,371 | $590 | |
| 1995 | $4,245 | $620 | $1,223 | $482 | $1,705 | $985 | $2,690 | $938 | $3,628 | $617 | |
| 1996 | $4,591 | $737 | $1,394 | $515 | $1,909 | $1,043 | $2,953 | $992 | $3,944 | $646 | |
| 1997 | $5,023 | $873 | $1,597 | $554 | $2,151 | $1,116 | $3,268 | $1,060 | $4,328 | $695 | |
| 1998 | $5,469 | $1,010 | $1,797 | $597 | $2,394 | $1,196 | $3,590 | $1,132 | $4,721 | $748 | |
| 1999 | $5,909 | $1,153 | $2,012 | $641 | $2,653 | $1,274 | $3,927 | $1,199 | $5,126 | $783 | |
| 2000 | $6,424 | $1,337 | $2,267 | $688 | $2,955 | $1,358 | $4,314 | $1,276 | $5,590 | $834 | |
| The IRS changed methodology, so data above and below this line not strictly comparable | |||||||||||
| 2001 | $6,116 | $492 | $1,065 | $1,934 | $666 | $2,600 | $1,334 | $3,933 | $1,302 | $5,235 | $881 |
| 2002 | $5,982 | $421 | $960 | $1,812 | $660 | $2,472 | $1,339 | $3,812 | $1,303 | $5,115 | $867 |
| 2003 | $6,157 | $466 | $1,030 | $1,908 | $679 | $2,587 | $1,375 | $3,962 | $1,325 | $5,287 | $870 |
| 2004 | $6,735 | $615 | $1,279 | $2,243 | $725 | $2,968 | $1,455 | $4,423 | $1,403 | $5,826 | $908 |
| 2005 | $7,366 | $784 | $1,561 | $2,623 | $778 | $3,401 | $1,540 | $4,940 | $1,473 | $6,413 | $953 |
| 2006 | $7,970 | $895 | $1,761 | $2,918 | $841 | $3,760 | $1,652 | $5,412 | $1,568 | $6,980 | $990 |
| 2007 | $8,622 | $1,030 | $1,971 | $3,223 | $905 | $4,128 | $1,770 | $5,898 | $1,673 | $7,571 | $1,051 |
| 2008 | $8,206 | $826 | $1,657 | $2,868 | $905 | $3,773 | $1,782 | $5,555 | $1,673 | $7,228 | $978 |
| 2009 | $7,579 | $602 | $1,305 | $2,439 | $878 | $3,317 | $1,740 | $5,058 | $1,620 | $6,678 | $900 |
| 2010 | $8,040 | $743 | $1,517 | $2,716 | $915 | $3,631 | $1,800 | $5,431 | $1,665 | $7,096 | $944 |
| 2011 | $8,317 | $737 | $1,556 | $2,819 | $956 | $3,775 | $1,866 | $5,641 | $1,716 | $7,357 | $961 |
| 2012 | $9,042 | $1,017 | $1,977 | $3,331 | $997 | $4,328 | $1,934 | $6,262 | $1,776 | $8,038 | $1,004 |
| 2013 | $9,034 | $816 | $1,720 | $3,109 | $1,034 | $4,143 | $2,008 | $6,152 | $1,844 | $7,996 | $1,038 |
| 2014 | $9,709 | $986 | $1,998 | $3,491 | $1,093 | $4,583 | $2,107 | $6,690 | $1,924 | $8,615 | $1,094 |
| Year | Total | Top 0.1% | Top 1% | Top 5% | Between 5% & 10% | Top 10% | Between 10% & 25% | Top 25% | Between 25% & 50% | Top 50% | Bottom 50% |
|---|---|---|---|---|---|---|---|---|---|---|---|
| Source: Internal Revenue Service. | |||||||||||
| 1980 | $249 | $47 | $92 | $31 | $123 | $59 | $182 | $50 | $232 | $18 | |
| 1981 | $282 | $50 | $99 | $36 | $135 | $69 | $204 | $57 | $261 | $21 | |
| 1982 | $276 | $53 | $100 | $34 | $134 | $66 | $200 | $56 | $256 | $20 | |
| 1983 | $272 | $55 | $101 | $34 | $135 | $64 | $199 | $54 | $252 | $19 | |
| 1984 | $297 | $63 | $113 | $37 | $150 | $68 | $219 | $57 | $276 | $22 | |
| 1985 | $322 | $70 | $125 | $41 | $166 | $73 | $238 | $60 | $299 | $23 | |
| 1986 | $367 | $94 | $156 | $44 | $201 | $78 | $279 | $64 | $343 | $24 | |
| The Tax Reform Act of 1986 changed the definition of AGI, so data above and below this line not strictly comparable | |||||||||||
| 1987 | $369 | $92 | $160 | $46 | $205 | $79 | $284 | $63 | $347 | $22 | |
| 1988 | $413 | $114 | $188 | $48 | $236 | $85 | $321 | $68 | $389 | $24 | |
| 1989 | $433 | $109 | $190 | $51 | $241 | $93 | $334 | $73 | $408 | $25 | |
| 1990 | $447 | $112 | $195 | $52 | $248 | $97 | $344 | $77 | $421 | $26 | |
| 1991 | $448 | $111 | $194 | $56 | $250 | $96 | $347 | $77 | $424 | $25 | |
| 1992 | $476 | $131 | $218 | $58 | $276 | $97 | $374 | $78 | $452 | $24 | |
| 1993 | $503 | $146 | $238 | $60 | $298 | $101 | $399 | $80 | $479 | $24 | |
| 1994 | $535 | $154 | $254 | $64 | $318 | $108 | $425 | $84 | $509 | $25 | |
| 1995 | $588 | $178 | $288 | $70 | $357 | $115 | $473 | $88 | $561 | $27 | |
| 1996 | $658 | $213 | $335 | $76 | $411 | $124 | $535 | $95 | $630 | $28 | |
| 1997 | $727 | $241 | $377 | $82 | $460 | $134 | $594 | $102 | $696 | $31 | |
| 1998 | $788 | $274 | $425 | $88 | $513 | $139 | $652 | $103 | $755 | $33 | |
| 1999 | $877 | $317 | $486 | $97 | $583 | $150 | $733 | $109 | $842 | $35 | |
| 2000 | $981 | $367 | $554 | $106 | $660 | $164 | $824 | $118 | $942 | $38 | |
| The IRS changed methodology, so data above and below this line not strictly comparable | |||||||||||
| 2001 | $885 | $139 | $294 | $462 | $101 | $564 | $158 | $722 | $120 | $842 | $43 |
| 2002 | $794 | $120 | $263 | $420 | $93 | $513 | $143 | $657 | $104 | $761 | $33 |
| 2003 | $746 | $115 | $251 | $399 | $85 | $484 | $133 | $617 | $98 | $715 | $30 |
| 2004 | $829 | $142 | $301 | $467 | $91 | $558 | $137 | $695 | $102 | $797 | $32 |
| 2005 | $932 | $176 | $361 | $549 | $98 | $647 | $145 | $793 | $106 | $898 | $33 |
| 2006 | $1,020 | $196 | $402 | $607 | $108 | $715 | $157 | $872 | $113 | $986 | $35 |
| 2007 | $1,112 | $221 | $443 | $666 | $117 | $783 | $170 | $953 | $122 | $1,075 | $37 |
| 2008 | $1,029 | $187 | $386 | $597 | $115 | $712 | $168 | $880 | $117 | $997 | $32 |
| 2009 | $863 | $146 | $314 | $502 | $101 | $604 | $146 | $749 | $93 | $842 | $21 |
| 2010 | $949 | $170 | $355 | $561 | $110 | $670 | $156 | $827 | $100 | $927 | $22 |
| 2011 | $1,043 | $168 | $366 | $589 | $123 | $712 | $181 | $893 | $120 | $1,012 | $30 |
| 2012 | $1,185 | $220 | $451 | $699 | $133 | $831 | $193 | $1,024 | $128 | $1,152 | $33 |
| 2013 | $1,232 | $228 | $466 | $721 | $139 | $860 | $203 | $1,063 | $135 | $1,198 | $34 |
| 2014 | $1,374 | $273 | $543 | $824 | $150 | $974 | $219 | $1,193 | $144 | $1,337 | $38 |
| Year | Total | Top 0.1% | Top 1% | Top 5% | Between 5% & 10% | Top 10% | Between 10% & 25% | Top 25% | Between 25% & 50% | Top 50% | Bottom 50% |
|---|---|---|---|---|---|---|---|---|---|---|---|
| Source: Internal Revenue Service. | |||||||||||
| 1980 | 100% | 8.46% | 21.01% | 11.12% | 32.13% | 24.57% | 56.70% | 25.62% | 82.32% | 17.68% | |
| 1981 | 100% | 8.30% | 20.78% | 11.20% | 31.98% | 24.69% | 56.67% | 25.59% | 82.25% | 17.75% | |
| 1982 | 100% | 8.91% | 21.23% | 11.03% | 32.26% | 24.53% | 56.79% | 25.50% | 82.29% | 17.71% | |
| 1983 | 100% | 9.29% | 21.74% | 11.04% | 32.78% | 24.44% | 57.22% | 25.30% | 82.52% | 17.48% | |
| 1984 | 100% | 9.66% | 22.19% | 11.06% | 33.25% | 24.31% | 57.56% | 25.00% | 82.56% | 17.44% | |
| 1985 | 100% | 10.03% | 22.67% | 11.10% | 33.77% | 24.21% | 57.97% | 24.77% | 82.74% | 17.26% | |
| 1986 | 100% | 11.30% | 24.11% | 11.02% | 35.12% | 23.92% | 59.04% | 24.30% | 83.34% | 16.66% | |
| The Tax Reform Act of 1986 changed the definition of AGI, so data above and below this line not strictly comparable | |||||||||||
| 1987 | 100% | 12.32% | 25.67% | 11.23% | 36.90% | 23.85% | 60.75% | 23.62% | 84.37% | 15.63% | |
| 1988 | 100% | 15.16% | 28.51% | 10.94% | 39.45% | 22.99% | 62.44% | 22.63% | 85.07% | 14.93% | |
| 1989 | 100% | 14.19% | 27.84% | 11.16% | 39.00% | 23.28% | 62.28% | 22.76% | 85.04% | 14.96% | |
| 1990 | 100% | 14.00% | 27.62% | 11.15% | 38.77% | 23.36% | 62.13% | 22.84% | 84.97% | 15.03% | |
| 1991 | 100% | 12.99% | 26.83% | 11.37% | 38.20% | 23.65% | 61.85% | 23.01% | 84.87% | 15.13% | |
| 1992 | 100% | 14.23% | 28.01% | 11.21% | 39.23% | 23.25% | 62.47% | 22.61% | 85.08% | 14.92% | |
| 1993 | 100% | 13.79% | 27.76% | 11.29% | 39.05% | 23.40% | 62.45% | 22.63% | 85.08% | 14.92% | |
| 1994 | 100% | 13.80% | 27.85% | 11.34% | 39.19% | 23.45% | 62.64% | 22.48% | 85.11% | 14.89% | |
| 1995 | 100% | 14.60% | 28.81% | 11.35% | 40.16% | 23.21% | 63.37% | 22.09% | 85.46% | 14.54% | |
| 1996 | 100% | 16.04% | 30.36% | 11.23% | 41.59% | 22.73% | 64.32% | 21.60% | 85.92% | 14.08% | |
| 1997 | 100% | 17.38% | 31.79% | 11.03% | 42.83% | 22.22% | 65.05% | 21.11% | 86.16% | 13.84% | |
| 1998 | 100% | 18.47% | 32.85% | 10.92% | 43.77% | 21.87% | 65.63% | 20.69% | 86.33% | 13.67% | |
| 1999 | 100% | 19.51% | 34.04% | 10.85% | 44.89% | 21.57% | 66.46% | 20.29% | 86.75% | 13.25% | |
| 2000 | 100% | 20.81% | 35.30% | 10.71% | 46.01% | 21.15% | 67.15% | 19.86% | 87.01% | 12.99% | |
| The IRS changed methodology, so data above and below this line not strictly comparable | |||||||||||
| 2001 | 100% | 8.05% | 17.41% | 31.61% | 10.89% | 42.50% | 21.80% | 64.31% | 21.29% | 85.60% | 14.40% |
| 2002 | 100% | 7.04% | 16.05% | 30.29% | 11.04% | 41.33% | 22.39% | 63.71% | 21.79% | 85.50% | 14.50% |
| 2003 | 100% | 7.56% | 16.73% | 30.99% | 11.03% | 42.01% | 22.33% | 64.34% | 21.52% | 85.87% | 14.13% |
| 2004 | 100% | 9.14% | 18.99% | 33.31% | 10.77% | 44.07% | 21.60% | 65.68% | 20.83% | 86.51% | 13.49% |
| 2005 | 100% | 10.64% | 21.19% | 35.61% | 10.56% | 46.17% | 20.90% | 67.07% | 19.99% | 87.06% | 12.94% |
| 2006 | 100% | 11.23% | 22.10% | 36.62% | 10.56% | 47.17% | 20.73% | 67.91% | 19.68% | 87.58% | 12.42% |
| 2007 | 100% | 11.95% | 22.86% | 37.39% | 10.49% | 47.88% | 20.53% | 68.41% | 19.40% | 87.81% | 12.19% |
| 2008 | 100% | 10.06% | 20.19% | 34.95% | 11.03% | 45.98% | 21.71% | 67.69% | 20.39% | 88.08% | 11.92% |
| 2009 | 100% | 7.94% | 17.21% | 32.18% | 11.59% | 43.77% | 22.96% | 66.74% | 21.38% | 88.12% | 11.88% |
| 2010 | 100% | 9.24% | 18.87% | 33.78% | 11.38% | 45.17% | 22.38% | 67.55% | 20.71% | 88.26% | 11.74% |
| 2011 | 100% | 8.86% | 18.70% | 33.89% | 11.50% | 45.39% | 22.43% | 67.82% | 20.63% | 88.45% | 11.55% |
| 2012 | 100% | 11.25% | 21.86% | 36.84% | 11.03% | 47.87% | 21.39% | 69.25% | 19.64% | 88.90% | 11.10% |
| 2013 | 100% | 9.03% | 19.04% | 34.42% | 11.45% | 45.87% | 22.23% | 68.10% | 20.41% | 88.51% | 11.49% |
| 2014 | 100% | 10.16% | 20.58% | 35.96% | 11.25% | 47.21% | 21.70% | 68.91% | 19.82% | 88.73% | 11.27% |
| Year | Total | Top 0.1% | Top 1% | Top 5% | Between 5% & 10% | Top 10% | Between 10% & 25% | Top 25% | Between 25% & 50% | Top 50% | Bottom 50% |
|---|---|---|---|---|---|---|---|---|---|---|---|
| Source: Internal Revenue Service. | |||||||||||
| 1980 | 100% | 19.05% | 36.84% | 12.44% | 49.28% | 23.74% | 73.02% | 19.93% | 92.95% | 7.05% | |
| 1981 | 100% | 17.58% | 35.06% | 12.90% | 47.96% | 24.33% | 72.29% | 20.26% | 92.55% | 7.45% | |
| 1982 | 100% | 19.03% | 36.13% | 12.45% | 48.59% | 23.91% | 72.50% | 20.15% | 92.65% | 7.35% | |
| 1983 | 100% | 20.32% | 37.26% | 12.44% | 49.71% | 23.39% | 73.10% | 19.73% | 92.83% | 7.17% | |
| 1984 | 100% | 21.12% | 37.98% | 12.58% | 50.56% | 22.92% | 73.49% | 19.16% | 92.65% | 7.35% | |
| 1985 | 100% | 21.81% | 38.78% | 12.67% | 51.46% | 22.60% | 74.06% | 18.77% | 92.83% | 7.17% | |
| 1986 | 100% | 25.75% | 42.57% | 12.12% | 54.69% | 21.33% | 76.02% | 17.52% | 93.54% | 6.46% | |
| The Tax Reform Act of 1986 changed the definition of AGI, so data above and below this line not strictly comparable | |||||||||||
| 1987 | 100% | 24.81% | 43.26% | 12.35% | 55.61% | 21.31% | 76.92% | 17.02% | 93.93% | 6.07% | |
| 1988 | 100% | 27.58% | 45.62% | 11.66% | 57.28% | 20.57% | 77.84% | 16.44% | 94.28% | 5.72% | |
| 1989 | 100% | 25.24% | 43.94% | 11.85% | 55.78% | 21.44% | 77.22% | 16.94% | 94.17% | 5.83% | |
| 1990 | 100% | 25.13% | 43.64% | 11.73% | 55.36% | 21.66% | 77.02% | 17.16% | 94.19% | 5.81% | |
| 1991 | 100% | 24.82% | 43.38% | 12.45% | 55.82% | 21.46% | 77.29% | 17.23% | 94.52% | 5.48% | |
| 1992 | 100% | 27.54% | 45.88% | 12.12% | 58.01% | 20.47% | 78.48% | 16.46% | 94.94% | 5.06% | |
| 1993 | 100% | 29.01% | 47.36% | 11.88% | 59.24% | 20.03% | 79.27% | 15.92% | 95.19% | 4.81% | |
| 1994 | 100% | 28.86% | 47.52% | 11.93% | 59.45% | 20.10% | 79.55% | 15.68% | 95.23% | 4.77% | |
| 1995 | 100% | 30.26% | 48.91% | 11.84% | 60.75% | 19.62% | 80.36% | 15.03% | 95.39% | 4.61% | |
| 1996 | 100% | 32.31% | 50.97% | 11.54% | 62.51% | 18.80% | 81.32% | 14.36% | 95.68% | 4.32% | |
| 1997 | 100% | 33.17% | 51.87% | 11.33% | 63.20% | 18.47% | 81.67% | 14.05% | 95.72% | 4.28% | |
| 1998 | 100% | 34.75% | 53.84% | 11.20% | 65.04% | 17.65% | 82.69% | 13.10% | 95.79% | 4.21% | |
| 1999 | 100% | 36.18% | 55.45% | 11.00% | 66.45% | 17.09% | 83.54% | 12.46% | 96.00% | 4.00% | |
| 2000 | 100% | 37.42% | 56.47% | 10.86% | 67.33% | 16.68% | 84.01% | 12.08% | 96.09% | 3.91% | |
| The IRS changed methodology, so data above and below this line not strictly comparable | |||||||||||
| 2001 | 100% | 15.68% | 33.22% | 52.24% | 11.44% | 63.68% | 17.88% | 81.56% | 13.54% | 95.10% | 4.90% |
| 2002 | 100% | 15.09% | 33.09% | 52.86% | 11.77% | 64.63% | 18.04% | 82.67% | 13.12% | 95.79% | 4.21% |
| 2003 | 100% | 15.37% | 33.69% | 53.54% | 11.35% | 64.89% | 17.87% | 82.76% | 13.17% | 95.93% | 4.07% |
| 2004 | 100% | 17.12% | 36.28% | 56.35% | 10.96% | 67.30% | 16.52% | 83.82% | 12.31% | 96.13% | 3.87% |
| 2005 | 100% | 18.91% | 38.78% | 58.93% | 10.52% | 69.46% | 15.61% | 85.07% | 11.35% | 96.41% | 3.59% |
| 2006 | 100% | 19.24% | 39.36% | 59.49% | 10.59% | 70.08% | 15.41% | 85.49% | 11.10% | 96.59% | 3.41% |
| 2007 | 100% | 19.84% | 39.81% | 59.90% | 10.51% | 70.41% | 15.30% | 85.71% | 10.93% | 96.64% | 3.36% |
| 2008 | 100% | 18.20% | 37.51% | 58.06% | 11.14% | 69.20% | 16.37% | 85.57% | 11.33% | 96.90% | 3.10% |
| 2009 | 100% | 16.91% | 36.34% | 58.17% | 11.72% | 69.89% | 16.85% | 86.74% | 10.80% | 97.54% | 2.46% |
| 2010 | 100% | 17.88% | 37.38% | 59.07% | 11.55% | 70.62% | 16.49% | 87.11% | 10.53% | 97.64% | 2.36% |
| 2011 | 100% | 16.14% | 35.06% | 56.49% | 11.77% | 68.26% | 17.36% | 85.62% | 11.50% | 97.11% | 2.89% |
| 2012 | 100% | 18.60% | 38.09% | 58.95% | 11.22% | 70.17% | 16.25% | 86.42% | 10.80% | 97.22% | 2.78% |
| 2013 | 100% | 18.48% | 37.80% | 58.55% | 11.25% | 69.80% | 16.47% | 86.27% | 10.94% | 97.22% | 2.78% |
| 2014 | 100% | 19.85% | 39.48% | 59.97% | 10.91% | 70.88% | 15.90% | 86.78% | 10.47% | 97.25% | 2.75% |
| Year | Total | Top 1% | Top 5% | Top 10% | Top 25% | Top 50% |
|---|---|---|---|---|---|---|
| 1980 | $80,580 | $43,792 | $35,070 | $23,606 | $12,936 | |
| 1981 | $85,428 | $47,845 | $38,283 | $25,655 | $14,000 | |
| 1982 | $89,388 | $49,284 | $39,676 | $27,027 | $14,539 | |
| 1983 | $93,512 | $51,553 | $41,222 | $27,827 | $15,044 | |
| 1984 | $100,889 | $55,423 | $43,956 | $29,360 | $15,998 | |
| 1985 | $108,134 | $58,883 | $46,322 | $30,928 | $16,688 | |
| 1986 | $118,818 | $62,377 | $48,656 | $32,242 | $17,302 | |
| The Tax Reform Act of 1986 changed the definition of AGI, so data above and below this line not strictly comparable | ||||||
| 1987 | $139,289 | $68,414 | $52,921 | $33,983 | $17,768 | |
| 1988 | $157,136 | $72,735 | $55,437 | $35,398 | $18,367 | |
| 1989 | $163,869 | $76,933 | $58,263 | $36,839 | $18,993 | |
| 1990 | $167,421 | $79,064 | $60,287 | $38,080 | $19,767 | |
| 1991 | $170,139 | $81,720 | $61,944 | $38,929 | $20,097 | |
| 1992 | $181,904 | $85,103 | $64,457 | $40,378 | $20,803 | |
| 1993 | $185,715 | $87,386 | $66,077 | $41,210 | $21,179 | |
| 1994 | $195,726 | $91,226 | $68,753 | $42,742 | $21,802 | |
| 1995 | $209,406 | $96,221 | $72,094 | $44,207 | $22,344 | |
| 1996 | $227,546 | $101,141 | $74,986 | $45,757 | $23,174 | |
| 1997 | $250,736 | $108,048 | $79,212 | $48,173 | $24,393 | |
| 1998 | $269,496 | $114,729 | $83,220 | $50,607 | $25,491 | |
| 1999 | $293,415 | $120,846 | $87,682 | $52,965 | $26,415 | |
| 2000 | $313,469 | $128,336 | $92,144 | $55,225 | $27,682 | |
| The IRS changed methodology, so data above and below this line not strictly comparable | ||||||
| 2001 | $1,393,718 | $306,635 | $132,082 | $96,151 | $59,026 | $31,418 |
| 2002 | $1,245,352 | $296,194 | $130,750 | $95,699 | $59,066 | $31,299 |
| 2003 | $1,317,088 | $305,939 | $133,741 | $97,470 | $59,896 | $31,447 |
| 2004 | $1,617,918 | $339,993 | $140,758 | $101,838 | $62,794 | $32,622 |
| 2005 | $1,938,175 | $379,261 | $149,216 | $106,864 | $64,821 | $33,484 |
| 2006 | $2,124,625 | $402,603 | $157,390 | $112,016 | $67,291 | $34,417 |
| 2007 | $2,251,017 | $426,439 | $164,883 | $116,396 | $69,559 | $35,541 |
| 2008 | $1,867,652 | $392,513 | $163,512 | $116,813 | $69,813 | $35,340 |
| 2009 | $1,469,393 | $351,968 | $157,342 | $114,181 | $68,216 | $34,156 |
| 2010 | $1,634,386 | $369,691 | $161,579 | $116,623 | $69,126 | $34,338 |
| 2011 | $1,717,675 | $388,905 | $167,728 | $120,136 | $70,492 | $34,823 |
| 2012 | $2,161,175 | $434,682 | $175,817 | $125,195 | $73,354 | $36,055 |
| 2013 | $1,860,848 | $428,713 | $179,760 | $127,695 | $74,955 | $36,841 |
| 2014 | $2,136,762 | $465,626 | $188,996 | $133,445 | $77,714 | $38,173 |
| Source: Internal Revenue Service. | ||||||
| Year | Total | Top 0.1% | Top 1% | Top 5% | Between 5% & 10% | Top 10% | Between 10% & 25% | Top 25% | Between 25% & 50% | Top 50% | Bottom 50% |
|---|---|---|---|---|---|---|---|---|---|---|---|
| Source: Internal Revenue Service. | |||||||||||
| 1980 | 15.31% | 34.47% | 26.85% | 17.13% | 23.49% | 14.80% | 19.72% | 11.91% | 17.29% | 6.10% | |
| 1981 | 15.76% | 33.37% | 26.59% | 18.16% | 23.64% | 15.53% | 20.11% | 12.48% | 17.73% | 6.62% | |
| 1982 | 14.72% | 31.43% | 25.05% | 16.61% | 22.17% | 14.35% | 18.79% | 11.63% | 16.57% | 6.10% | |
| 1983 | 13.79% | 30.18% | 23.64% | 15.54% | 20.91% | 13.20% | 17.62% | 10.76% | 15.52% | 5.66% | |
| 1984 | 13.68% | 29.92% | 23.42% | 15.57% | 20.81% | 12.90% | 17.47% | 10.48% | 15.35% | 5.77% | |
| 1985 | 13.73% | 29.86% | 23.50% | 15.69% | 20.93% | 12.83% | 17.55% | 10.41% | 15.41% | 5.70% | |
| 1986 | 14.54% | 33.13% | 25.68% | 15.99% | 22.64% | 12.97% | 18.72% | 10.48% | 16.32% | 5.63% | |
| The Tax Reform Act of 1986 changed the definition of AGI, so data above and below this line not strictly comparable | |||||||||||
| 1987 | 13.12% | 26.41% | 22.10% | 14.43% | 19.77% | 11.71% | 16.61% | 9.45% | 14.60% | 5.09% | |
| 1988 | 13.21% | 24.04% | 21.14% | 14.07% | 19.18% | 11.82% | 16.47% | 9.60% | 14.64% | 5.06% | |
| 1989 | 13.12% | 23.34% | 20.71% | 13.93% | 18.77% | 12.08% | 16.27% | 9.77% | 14.53% | 5.11% | |
| 1990 | 12.95% | 23.25% | 20.46% | 13.63% | 18.50% | 12.01% | 16.06% | 9.73% | 14.36% | 5.01% | |
| 1991 | 12.75% | 24.37% | 20.62% | 13.96% | 18.63% | 11.57% | 15.93% | 9.55% | 14.20% | 4.62% | |
| 1992 | 12.94% | 25.05% | 21.19% | 13.99% | 19.13% | 11.39% | 16.25% | 9.42% | 14.44% | 4.39% | |
| 1993 | 13.32% | 28.01% | 22.71% | 14.01% | 20.20% | 11.40% | 16.90% | 9.37% | 14.90% | 4.29% | |
| 1994 | 13.50% | 28.23% | 23.04% | 14.20% | 20.48% | 11.57% | 17.15% | 9.42% | 15.11% | 4.32% | |
| 1995 | 13.86% | 28.73% | 23.53% | 14.46% | 20.97% | 11.71% | 17.58% | 9.43% | 15.47% | 4.39% | |
| 1996 | 14.34% | 28.87% | 24.07% | 14.74% | 21.55% | 11.86% | 18.12% | 9.53% | 15.96% | 4.40% | |
| 1997 | 14.48% | 27.64% | 23.62% | 14.87% | 21.36% | 12.04% | 18.18% | 9.63% | 16.09% | 4.48% | |
| 1998 | 14.42% | 27.12% | 23.63% | 14.79% | 21.42% | 11.63% | 18.16% | 9.12% | 16.00% | 4.44% | |
| 1999 | 14.85% | 27.53% | 24.18% | 15.06% | 21.98% | 11.76% | 18.66% | 9.12% | 16.43% | 4.48% | |
| 2000 | 15.26% | 27.45% | 24.42% | 15.48% | 22.34% | 12.04% | 19.09% | 9.28% | 16.86% | 4.60% | |
| The IRS changed methodology, so data above and below this line not strictly comparable | |||||||||||
| 2001 | 14.47% | 28.17% | 27.60% | 23.91% | 15.20% | 21.68% | 11.87% | 18.35% | 9.20% | 16.08% | 4.92% |
| 2002 | 13.28% | 28.48% | 27.37% | 23.17% | 14.15% | 20.76% | 10.70% | 17.23% | 8.00% | 14.87% | 3.86% |
| 2003 | 12.11% | 24.60% | 24.38% | 20.92% | 12.46% | 18.70% | 9.69% | 15.57% | 7.41% | 13.53% | 3.49% |
| 2004 | 12.31% | 23.06% | 23.52% | 20.83% | 12.53% | 18.80% | 9.41% | 15.71% | 7.27% | 13.68% | 3.53% |
| 2005 | 12.65% | 22.48% | 23.15% | 20.93% | 12.61% | 19.03% | 9.45% | 16.04% | 7.18% | 14.01% | 3.51% |
| 2006 | 12.80% | 21.94% | 22.80% | 20.80% | 12.84% | 19.02% | 9.52% | 16.12% | 7.22% | 14.12% | 3.51% |
| 2007 | 12.90% | 21.42% | 22.46% | 20.66% | 12.92% | 18.96% | 9.61% | 16.16% | 7.27% | 14.19% | 3.56% |
| 2008 | 12.54% | 22.67% | 23.29% | 20.83% | 12.66% | 18.87% | 9.45% | 15.85% | 6.97% | 13.79% | 3.26% |
| 2009 | 11.39% | 24.28% | 24.05% | 20.59% | 11.53% | 18.19% | 8.36% | 14.81% | 5.76% | 12.61% | 2.35% |
| 2010 | 11.81% | 22.84% | 23.39% | 20.64% | 11.98% | 18.46% | 8.70% | 15.22% | 6.01% | 13.06% | 2.37% |
| 2011 | 12.54% | 22.82% | 23.50% | 20.89% | 12.83% | 18.85% | 9.70% | 15.82% | 6.98% | 13.76% | 3.13% |
| 2012 | 13.11% | 21.67% | 22.83% | 20.97% | 13.33% | 19.21% | 9.96% | 16.35% | 7.21% | 14.33% | 3.28% |
| 2013 | 13.64% | 27.91% | 27.08% | 23.20% | 13.40% | 20.75% | 10.11% | 17.28% | 7.31% | 14.98% | 3.30% |
| 2014 | 14.16% | 27.67% | 27.16% | 23.61% | 13.73% | 21.25% | 10.37% | 17.83% | 7.48% | 15.52% | 3.45% |
- For data prior to 2001, all tax returns that have a positive AGI are included, even those that do not have a positive income tax liability. For data from 2001 forward, returns with negative AGI are also included, but dependent returns are excluded.
- Income tax after credits (the measure of “income taxes paid” above) does not account for the refundable portion of EITC. If it were included, the tax share of the top income groups would be higher. The refundable portion is classified as a spending program by the Office of Management and Budget and therefore is not included by the IRS in these figures.
- The only tax analyzed here is the federal individual income tax, which is responsible for more than 25 percent of the nation’s taxes paid (at all levels of government). Federal income taxes are much more progressive than federal payroll taxes, which are responsible for about 20 percent of all taxes paid (at all levels of government), and are more progressive than most state and local taxes.
- AGI is a fairly narrow income concept and does not include income items like government transfers (except for the portion of Social Security benefits that is taxed), the value of employer-provided health insurance, underreported or unreported income (most notably that of sole proprietors), income derived from municipal bond interest, net imputed rental income, and others.
- The unit of analysis here is that of the tax return. In the figures prior to 2001, some dependent returns are included. Under other units of analysis (like the Treasury Department’s Family Economic Unit), these returns would likely be paired with parents’ returns.
- These figures represent the legal incidence of the income tax. Most distributional tables (such as those from CBO, Tax Policy Center, Citizens for Tax Justice, the Treasury Department, and JCT) assume that the entire economic incidence of personal income taxes falls on the income earner.
[1] Individual Income Tax Rates and Tax Shares, Internal Revenue Service Statistics of Income, http://www.irs.gov/uac/SOI-Tax-Stats-Individual-Income-Tax-Rates-and-Tax-Shares.
[2] See Congressional Budget Office, The Budget and Economic Outlook: 2017 to 2027, Jan. 2017, https://www.cbo.gov/sites/default/files/115th-congress-2017-2018/reports/52370-outlook.pdf.
[3] There is strong reason to believe that capital gains realizations were unusually depressed in 2013, due to the increase in the top capital gains tax rate from 15 percent to 23.8 percent. In 2013, capital gains accounted for 26.6 percent of the income of taxpayers with over $1 million in AGI received, compared to 31.7 percent in 2014 (these calculations apply for net capital gains reported on Schedule D). Table 1.4, Publication 1304, “Individual Income Tax Returns 2014,” Internal Revenue Service, https://www.irs.gov/uac/soi-tax-stats-individual-income-tax-returns-publication-1304-complete-report.
[4] Here, “average income tax rate” is defined as income taxes paid divided by adjusted gross income.
Share this article